First Calibration using CuCu data
Runs used: 6013134 (13 Jan) - 6081062 (22 Mar)
The procedure for performing the relative calibration can be divided into 3 steps:
- Create a histogram of the pedestal-subtracted ADC values for minimum-ionizing particles in each tower
- Identify the working towers (those with a clearly identifiable MIP-peak)
- Use the peak of each histogram together with the location of the tower in eta to calculate a new gain
- Create new gain tables and rerun the data, this time looking for electrons
- Use the electrons to establish an absolute energy scale for each eta-ring
Using Mike's code from the calibration of the 2004 data, an executable was created to run over the 62GeV CuCu data from Run 5, produce the 2400 histograms, and calculate a new gain for each tower. It was necessary to check these histograms by hand to identify the working towers. The output of the executable is available as a 200 page PDF file:
2005_mip_spec.pdf (2400 towers - 21.6 MB)
Towers marked red or yellow are excluded from the calibration. Condensed PDFs of the excluded towers are available at the bottom of the page ("bad" and "weird"). In all, we have included 2212 / 2400 = 92% of the towers in the calibration.
Systematic Behavior of the Gains
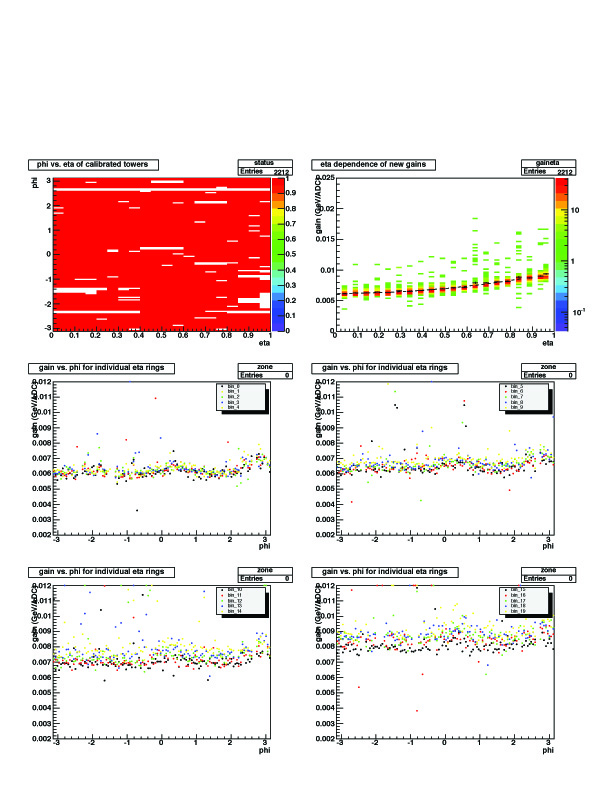
The first plot in the top left shows the excluded towers (white blocks) in eta_phi space
In the second plot we collect the towers into 20 eta-rings (delta-eta = 0.05) and look at the change in gain as we move out in eta. This plot shows the expected increase in gain as we move into the forward region (except for eta-rings 19 and 20).
Finally we look at each individual eta-ring for for systematic variations in azimuth. There appears to be some structure around phi=0.2 and phi=3.
Electron Calibration Status
We have made an attempt to realize the absolute energy scales using electrons. Unfortunately, there does not appear to be a sufficient number of electrons in the processed 62GeV data to do this for each eta-ring. We will revisit this later when more statistics are available, but in the meantime we have established the following workaround:
- Fit the average gains of the first 17 eta-rings with a function that goes as 1/sin(theta)
- Caclulate the expected gains for eta-rings 18, 19, and 20 from this function
- Scale the forward eta-rings accordingly
The results of this procedure are seen in an updated plot of gain vs. eta:
Here are new bemcCalib and bemcStatus .root files created using these rescaled gains:
bemcCalib.20050113.053235.root
bemcStatus.20050113.053235.root
The text file is a list of tower-gain pairs. A gain of zero indicates a tower that has been masked out. Finally, we have a plot of p/E summed over all eta:

Update: Addition of the East BEMC Towers
We have calculated new gains for the 1200 towers in the east half of the barrel that were turned on by March 22. Only data from March 22 were used in this calibration. The results can be found in 2005_mip_spec_newtowers.pdf
bemcCalib.20050322.000000.root
bemcStatus.20050322.000000.root
The gains for towers 1-2400 are the same as before. These files include those entries, as well as new gains for towers 2401-4800. No attempt has been made to get an absolute energy scale for the east towers, so we still see the drop in gain for large eta:
