Performance
Below is a listing of adjustable mysql performance parameters, their descriptions and their current settings. Where applicable, the reasons and decisions that went into the current setting is provied. Also presented is the health of the parameter with the date the study was done. These parmaters should be reveiwed every six months or when the system warrents a review.
| Parameter | Setting | Definition | Mysql Default | Reasoning | Health | Last Checked | ||
|---|---|---|---|---|---|---|---|---|
| bulk_insert_buffer_size | 8388608 | |||||||
| join_buffer_size | 131072 | |||||||
| table_cache | 1024 | Increases the amount of table that can be held open | 64 | |||||
| key_buffer_size | 268435456 | amount of memory available for index buffer | 523264 | |||||
| myisam_sort_buffer_size | 67108864 | |||||||
| net_buffer_length | 16384 | |||||||
| read_buffer_size | 1044480 | |||||||
| read_rnd_buffer_size | 262144 | |||||||
| sort_buffer_size | 1048568 | Each thread that needs to do a sort allocates a buffer of this size. Increasing the variable gives faster ORDER BY or GROUP BY operations |
MySQL Performance Tuning
MySQL performance tuning
Primary purpose:
a) performance optimization of the existing Offline and FileCatalog databases at MySQL level (faster response time, more queries per second, less disk usage etc);
b) future db needs projections, e.g. what hardware we should use (or buy) to meet desired quality of service for STAR experiment in next few years;
c) STAR DB API performance bottlenecks search;
Expected speed-up factor from MySQL optimizations (buffers, query modes) is about 20-50%, API optimization gain *potentially* could be much higher than that.
Test node(s)
OFFLINE: dbslave03.star.bnl.gov, which is not included in Offline DB activies (backup-only); OFFLINE DB is READ-HEAVY.
FILECATALOG: dbslave04.star.bnl.gov, which is not included in FC DB activies (backup-only); FILECATALOG DB is WRITE-HEAVY.
Measured db response values
1. Queries Per Second (QPS) - defined as QPS = (Total Queries / Uptime ) for cold start, and QPS = (dQueries/dUptime) for hot start;
2. Time to process typical reco sample - a) 5, 50, 500 events single job; b) several parallel jobs 500 events each (N jobs - tbd) - defined as TPS = (first job start time - last job stop time) for both cold and hot regimes;
Both parameters would be estimated in two cases :
a) cold start - sample runs just after mysql restart - all buffers and caches are empty;
b) hot start - 1000 events already processed, so caches are full with data;
MySQL varied parameters
per thread buffers : preload_buffer_size, read_buffer_size, read_rnd_buffer_size, sort_buffer_size, join_buffer_size, thread_stack;
global buffers : key_buffer_size, query_cache_size, max_heap_table_size, tmp_table_size;
insert parameters : bulk_insert_buffer_size, concurrent_insert [e.g.=2 vs =1], pack_keys (enabled, disabled)
compression features : do we need compression for blobs at API level?
DNS parameters : HOST_CACHE_SIZE (default = 128);
Initial parameter values are :
| Per Thread Buffers | Default Value | Default HighPerf | Modified Value | Description |
|---|---|---|---|---|
| preload_buffer_size | 32K | 32K | The size of the buffer that is allocated when preloading indexes. | |
| read_buffer_size | 128K | 1M | Each thread that does a sequential scan allocates a buffer of this size (in bytes) for each table it scans. | |
| read_rnd_buffer_size | 256K | 256K | When reading rows in sorted order following a key-sorting operation, the rows are read through this buffer to avoid disk seeks.Setting the variable to a large value can improve ORDER BY performance by a lot. However, this is a buffer allocated for each client, so you should not set the global variable to a large value. Instead, change the session variable only from within those clients that need to run large queries. |
|
| sort_buffer_size | 2M | 2M | Each thread that needs to do a sort allocates a buffer of this size. Increase this value for faster ORDER BY or GROUP BY operations. |
|
| myisam_sort_buffer_size | 8M | 64M | The size of the buffer that is allocated when sorting MyISAM indexes during a REPAIR TABLE or when creating indexes with CREATE INDEX or ALTER TABLE. |
|
| join_buffer_size | 128K | 128K | The size of the buffer that is used for plain index scans, range index scans, and joins that do not use indexes and thus perform full table scans. Normally, the best way to get fast joins is to add indexes. Increase the value of join_buffer_size to get a faster full join when adding indexes is not possible. |
|
| thread_stack | 192K | 192K | The stack size for each thread. |
| Global Buffers | Default Value | Default HighPerf | Modified Value | Description |
|---|---|---|---|---|
| key_buffer_size | 8M | 256M | Index blocks for MyISAM tables are buffered and are shared by all threads. key_buffer_size is the size of the buffer used for index blocks. The key buffer is also known as the key cache. |
|
| query_cache_size | 0 | 0 | The amount of memory allocated for caching query results. The default value is 0, which disables the query cache. The allowable values are multiples of 1024; other values are rounded down to the nearest multiple. | |
| max_heap_table_size | 16M | 16M | This variable sets the maximum size to which MEMORY tables are allowed to grow. The value of the variable is used to calculate MEMORY table MAX_ROWS values. |
|
| tmp_table_size | system-dependent | 32M | The maximum size of internal in-memory temporary tables. If an in-memory temporary table exceeds the limit, MySQL automatically converts it to an on-disk MyISAM table. Increase the value of tmp_table_size (and max_heap_table_size if necessary) if you do many advanced GROUP BY queries and you have lots of memory. |
| Write operations | Default Value | HighPerf Value | Modified Value | Description |
|---|---|---|---|---|
| bulk_insert_buffer_size | 8M | 8M | MyISAM uses a special tree-like cache to make bulk inserts faster for INSERT ... SELECT, INSERT ... VALUES (...), (...), ..., and LOAD DATA INFILE when adding data to non-empty tables. This variable limits the size of the cache tree in bytes per thread. Setting it to 0 disables this optimization. |
|
| concurrent_insert | 1 | 1 | 0 = Off 1 = (Default) Enables concurrent insert for MyISAM tables that don't have holes2 = Enables concurrent inserts for all MyISAM tables, even those that have holes. For a table with a hole, new rows are inserted at the end of the table if it is in use by another thread. Otherwise, MySQL acquires a normal write lock and inserts the row into the hole. |
"concurrent_insert" is interesting for FileCatalog database - we do many inserts quite often.
DNS
Quote from MySQL manual : "If you have a very slow DNS and many hosts, you can get more performance by either disabling DNS lookop with --skip-name-resolve or by increasing the HOST_CACHE_SIZE define (default: 128) and recompile mysqld." - we definitely have more than 128 hosts accessing our databases simultaneously, which means that we need to increase it to something like 2048 or so (to account for RCF farm nodes). Currently, both stock mysql distribution and HighPerformance version have 128 hosts set as buffer default.
Node FileSystem parameters
1. We should check "dir_index" feature of ext3 filesystem, which allows
Brando $> tune2fs -l /dev/hdb1 | grep "dir_index" => dir_index enabled
Duvall $> tune2fs -l /dev/sdc1 |grep "dir_index" => dir_index disabled
2. "noatime" mount option for /db0X disks, to reduce IO load a little bit. Both Duvall and Brando have no "noatime" attribute set (11 May 2009).
3. /tmp location (same disk, separate disk, RAM disk).
FC Duvall at duvall is using /dbtemp (ext. disk, raid?);
FC Brando is not using /dbtemp, because there's no /dbtemp defined in system yet;
Node varied parameters
Number of CPUs scaling (1,2,4);
CPU power dependence;
RAM capacity dependence (1 Gb, 2Gb, 2+ Gb);
HDD r/w speed;
FileCatalog DB performance study
FileCatalog DB is ~ 30% READ / 70% WRITE database. Spiders frequently update file locations (on local disks), new files constantly appear during Run period etc.. Therefore, INSERT/UPDATE performance will be studied first.
Typical R/W percentage could be seen here :
Duvall profile information,
or here :
Brando profile information
PLOTS - Query Cache
Query cache does not seem to help under 150 connections.....
Note different Y axis for Bogart
Bogart - No Query Cache
Bogart - Query Cache DEMAND Size = 26255360
DB02- No Query Cache
DB02- Query Cache DEMAND Size = 26255360
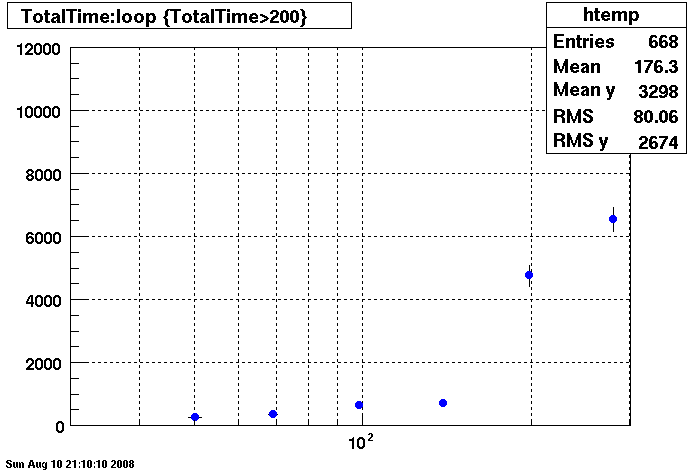
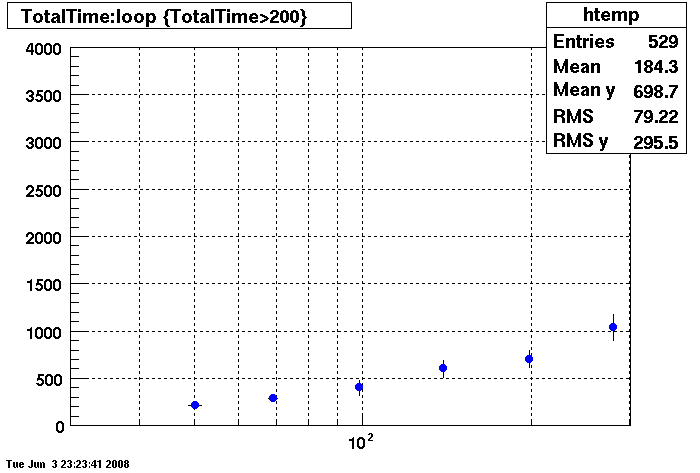
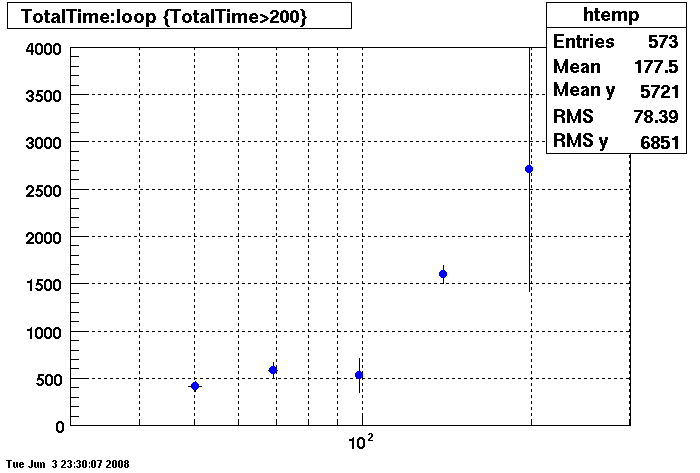
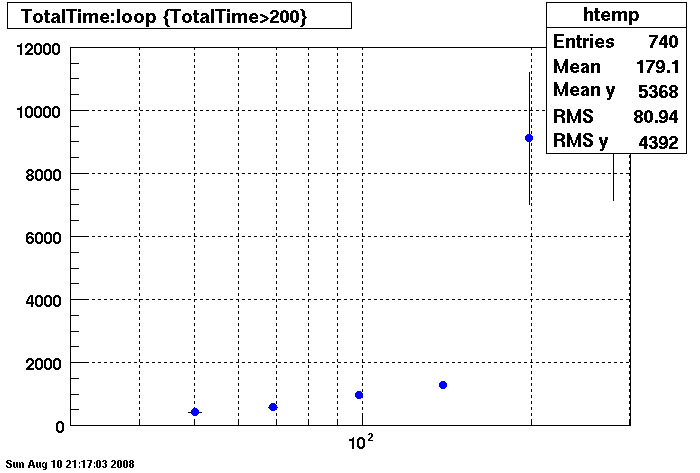
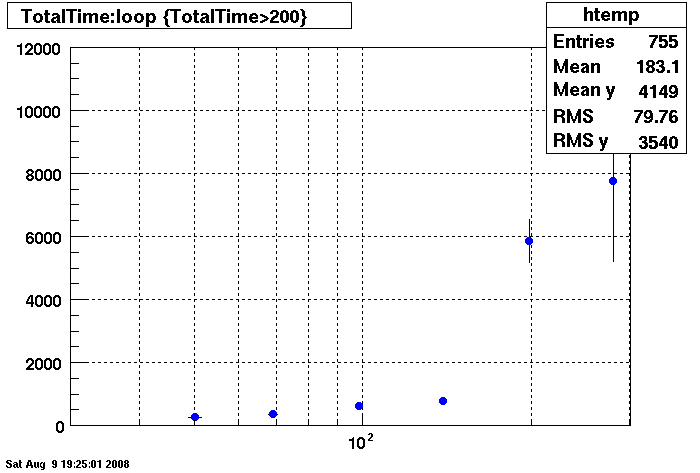
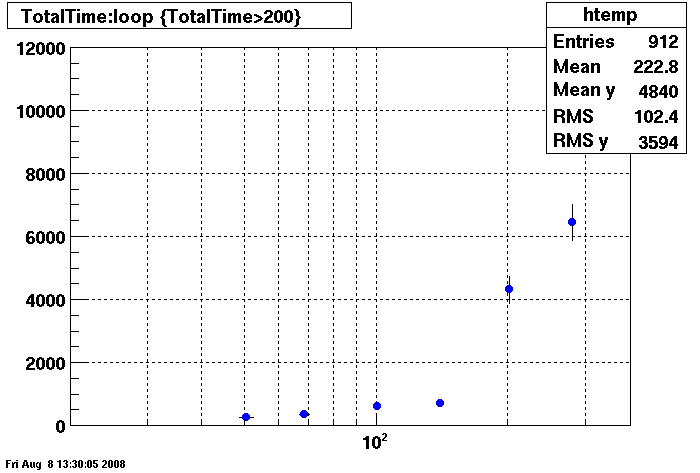
Plots - DB02 old/new Compare
Penguin Relion 230 vrs. Dell Precision 530 (specs here link to be added....)
Note the different time scales on the Y axis.
Summary: The new penguin has faster db access under 150 connection but responds much slower than the dell
when connections are greater than 150 connection.
There is an additional point under the htemp box for 350 connections, @~11000 seconds. This point was taken with 8 clients (instead of 4 clients) to see if the clients where influencing results, slope is the same, apparently not.
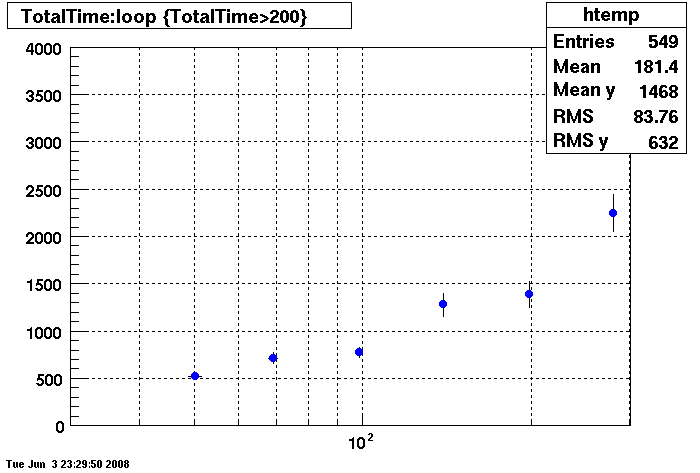
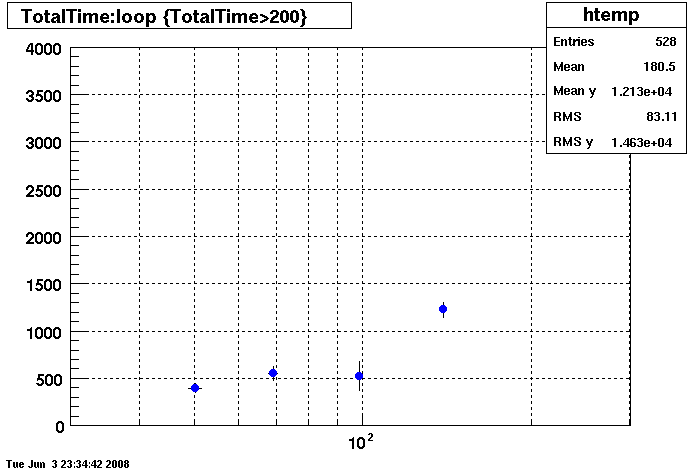
There are two plots of the Penguin each showing a differnent RAID array. The results are essentially identical under 150 connections. Over 150 connections the first RAID array is much better.
The first plot is of the Penguin with first RAID array (Wayne please edit with specifics:
Penguin with Second RAID Array
Dell:
Plots - Key Buffer = 52
This plot shows x=number of connections , y=time it takes for the StDbLib to retrun a complete data set for all the Star Offline databases. This set of plot returns the key_buffer_size from the STAR defualt of 268435456 to the mysql defualt of 523264.
Bogart
DB02
DB03
DB08
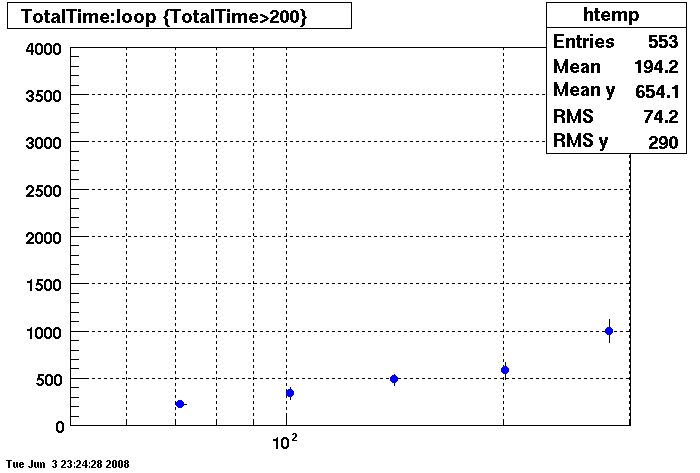
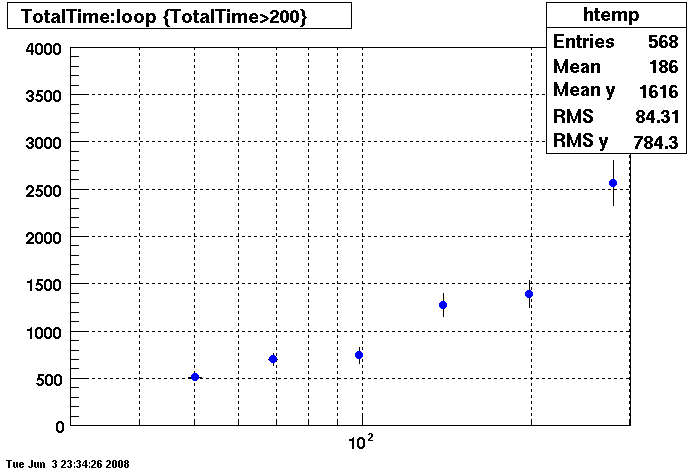
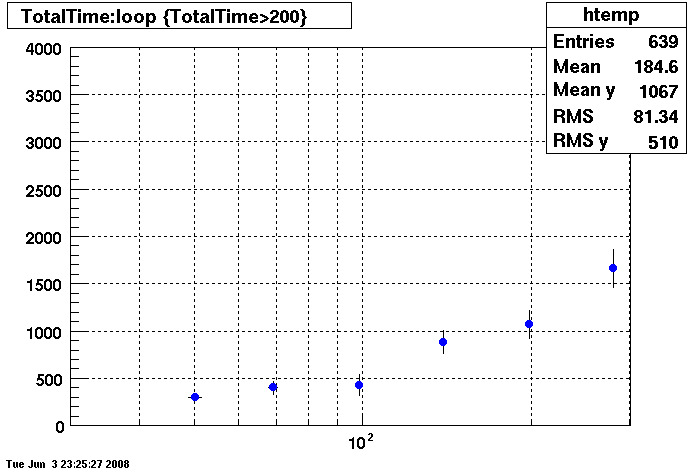
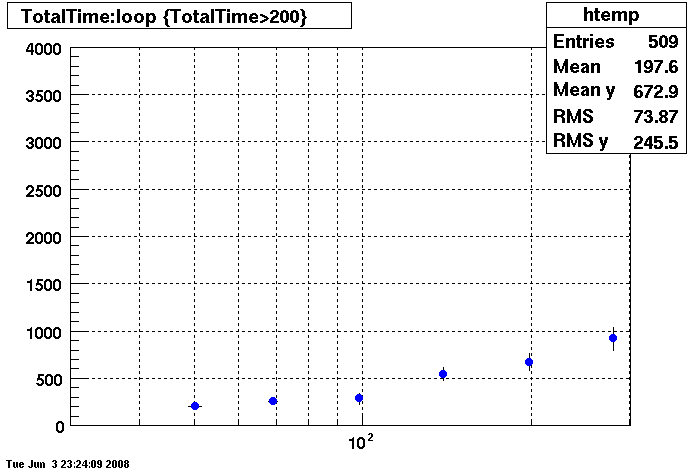
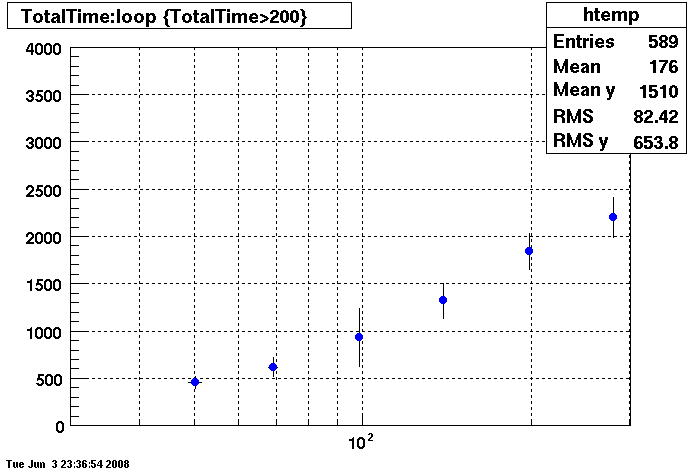
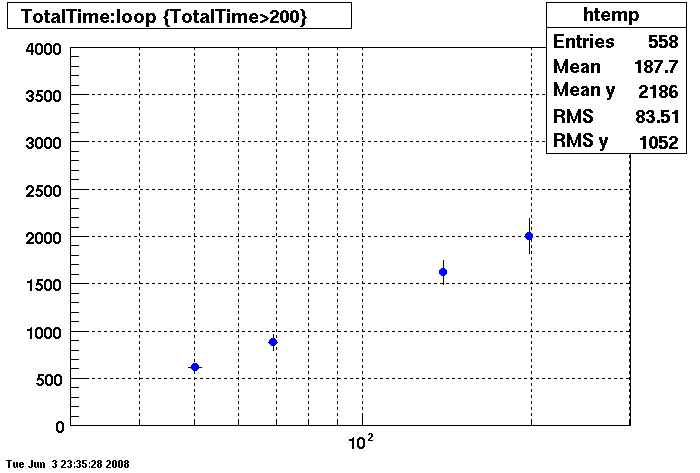
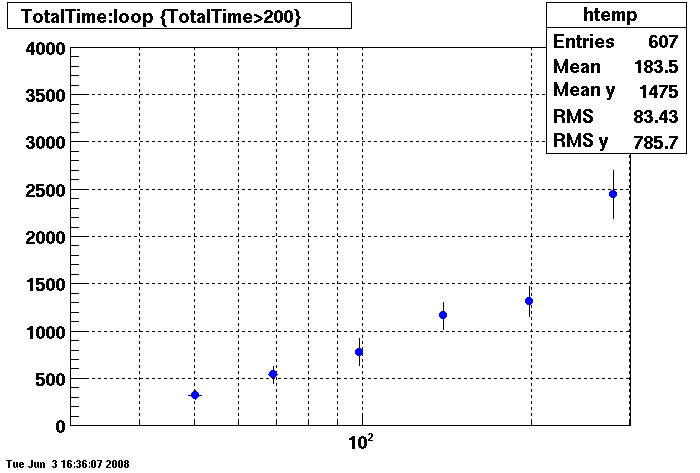
Plots - Star Default
This plot shows x=number of connections , y=time it takes for the StDbLib to retrun a complete data set for all the Star Offline databases. This set of plot uses the STAR defualt parameters as described one page up. This is to be used as a baseline for comparisions.
Bogart
DB02
DB03
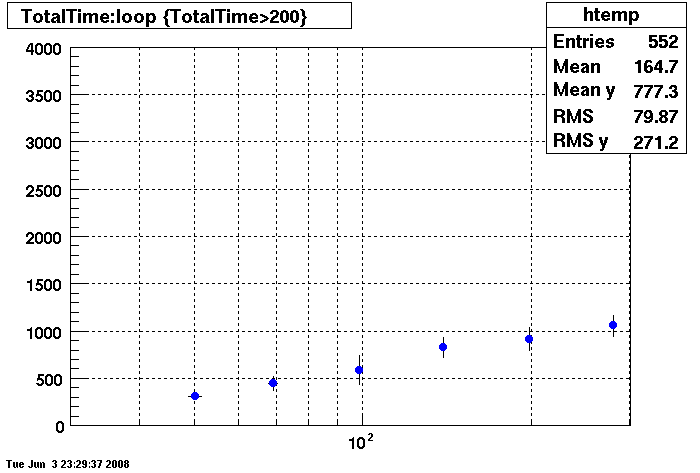
DB08
Plots = Table Cache 64
This plot shows x=number of connections , y=time it takes for the StDbLib to retrun a complete data set for all the Star Offline databases. This set of plot returns the table_cache from the STAR defualt of 1024 to the mysql defualt of 64.
Bogart
DB02
DB03
DB08