P06ib
QA Plots Phi(Feb 2009)
QA P06ib (Phi->K +K)
This is the QA for P06ib (Phi- > KK). reconstruction on Global Tracks (Kaons)
1. dEdx
Reconstruction on Kaon Daugthers. Plot shows MOntecarlo tracks and Ghost Tracsks.
/P06ib_dedx_Phi(Ghost).gif)
2. DCA Distributions
An original 3D histogram had been created and filled with pT, Eta and DCA as the 3 coordinates. Projection on PtBins and EtaBins had been made to create this "matrix" of plots. (MonteCarlo and MuDst) (MuDst taken from pdsf > /eliza12/starprod/reco/cuProductionMinBias/ReversedFullField/P06ib/2005/022/st_physics_adc_6022048_raw*.MuDst.root)
Pt Bin array used : { 0.5, 0.6, 0.8, 1.0} (moves down) and
Eta Bin array : {0.2, 0.5, 0.8, 1.0} (moves to the right)
For the Error bars, i used the option hist->Sumw2();
/dca_eta_pt_phi.gif)
3. NFit Distributions
Similarly An Original 3D Histogram had been created with Pt, Eta and Nfit as coordinates. Respective projections had been made in the same pT and Eta Bins as the DCa distributions. (MonteCarlo and MuDst)
Pt Bin array used : { 0.5, 0.6, 0.8, 1.0} (moves down) and
Eta Bin array : {0.2, 0.5, 0.8, 1.0} (moves to the right)
For the Error bars, i used the option hist->Sumw2();
/nfit_eta_pt_phi.gif)
4. Delta Vertex
The following are the Delta Vertex ( Vertex Reconstructed - Vertex Embedded) plot for the 3 diiferent coordinates (x, y and z) (Cuts of vz =30 cm , NFitCut= 25 are applied)
/Delta_vertex_Phi.gif)
5. Z Vertex and X vs Y vertex
/vertex_Phi.gif)
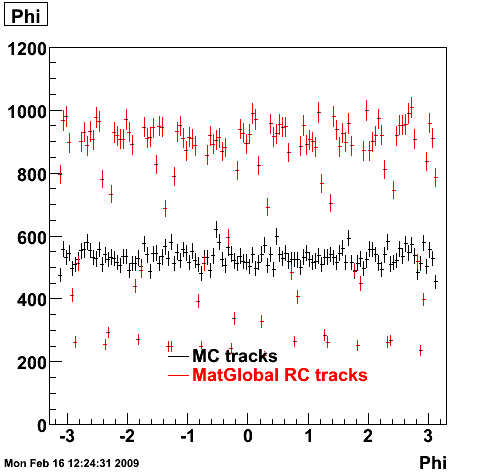
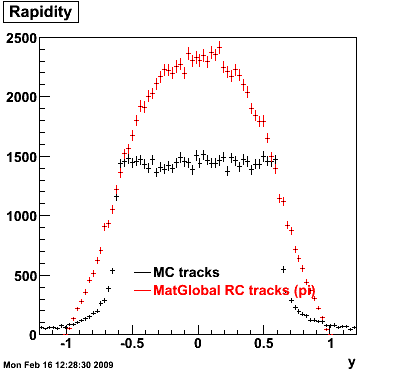
6. Global Variables : Phi and Rapidity
/y_f_phi(1).gif)
/phi_f_phi.gif)
7. Pt
Embedded Phi meson with flat pt (black)and Reconstructed Kaon Daugther (red).
/pt_f_phi.gif)
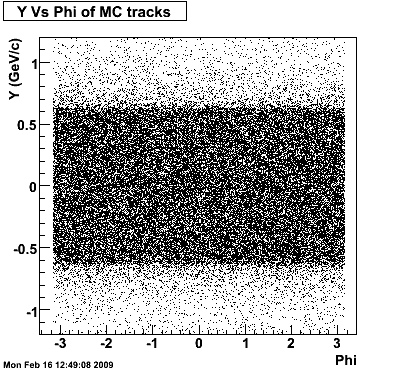
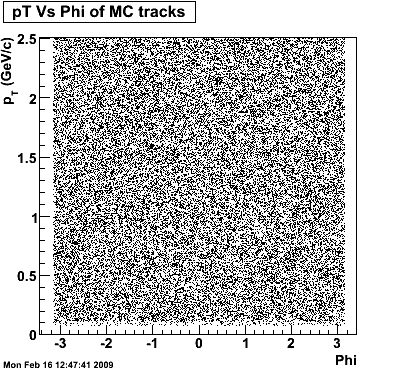
8. Randomness Plots
The following plots, are to check the randomness of the input Monte Carlo (MC) tracks.
/mc_pt_y_Phi_K.gif)
/mc_y_phi_phi_K.gif)
QA plots Rho (February 16 2009)
QA P06ib (Rho->pi+pi)
This is the QA for P06ib (Rho- > pi+pi). reconstruction on Global Tracks (pions)
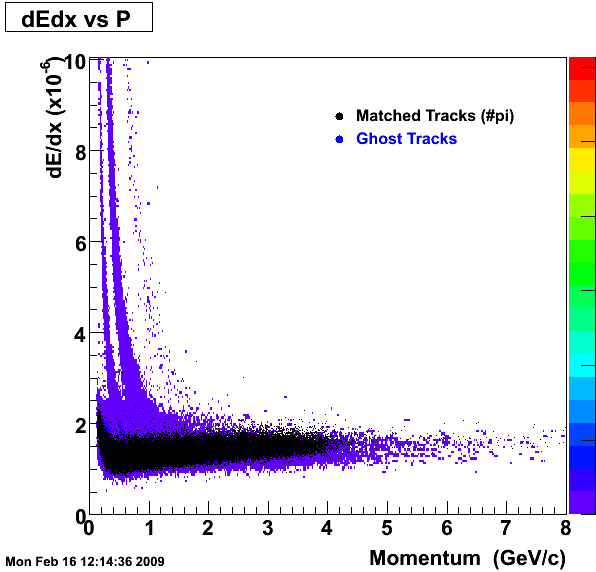
1. dEdx
Reconstruction on Pion Daugthers.
2. DCA Distributions
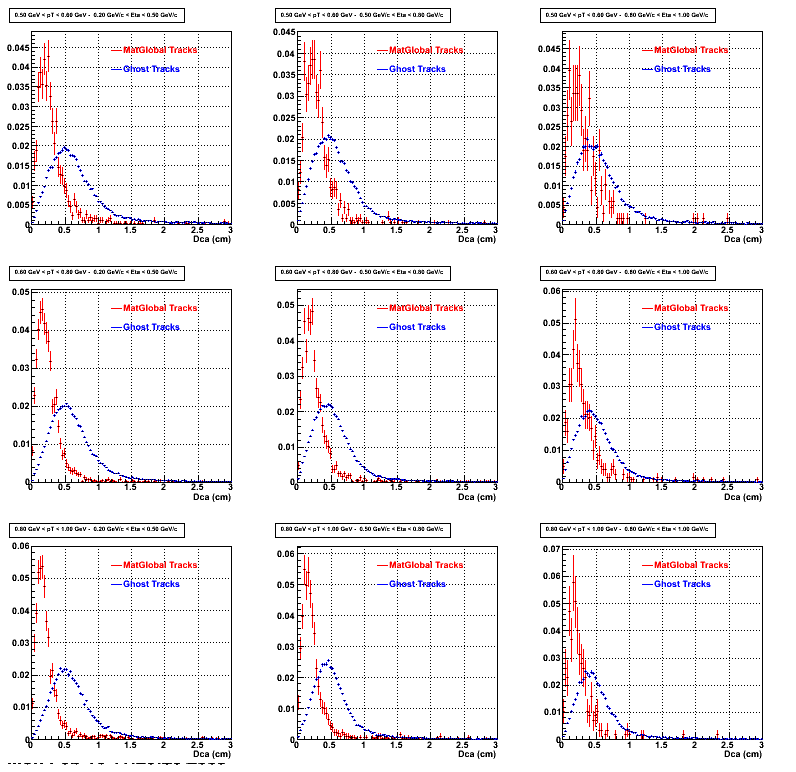
An original 3D histogram had been created and filled with pT, Eta and DCA as the 3 coordinates. Projection on PtBins and EtaBins had been made to create this "matrix" of plots.
Pt Bin array used : { 0.5, 0.6, 0.8, 1.0} (moves down) and
Eta Bin array : {0.2, 0.5, 0.8, 1.0} (moves to the right)
For the Error bars, i used the option hist->Sumw2();
2b. Compared with MuDst
.gif)
3. NFit Distributions
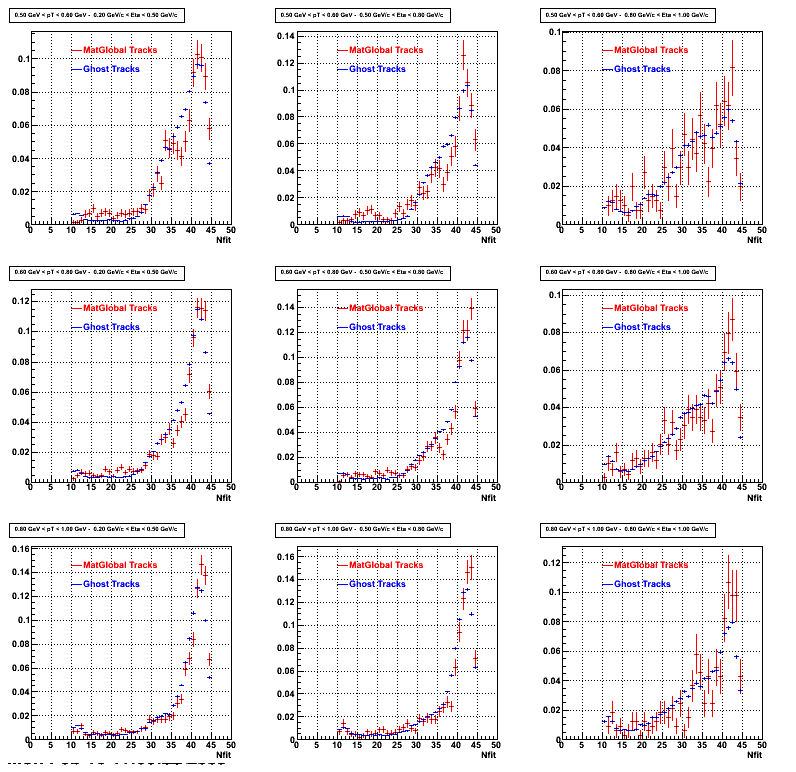
Similarly An Original 3D Histogram had been created with Pt, Eta and Nfit as coordinates. Respective projections had been made in the same pT and Eta Bins as the DCa distributions.
Pt Bin array used : { 0.5, 0.6, 0.8, 1.0} (moves down) and
Eta Bin array : {0.2, 0.5, 0.8, 1.0} (moves to the right)
For the Error bars, i used the option hist->Sumw2();
3b. Reconstructed compared with MuDsts
.gif)
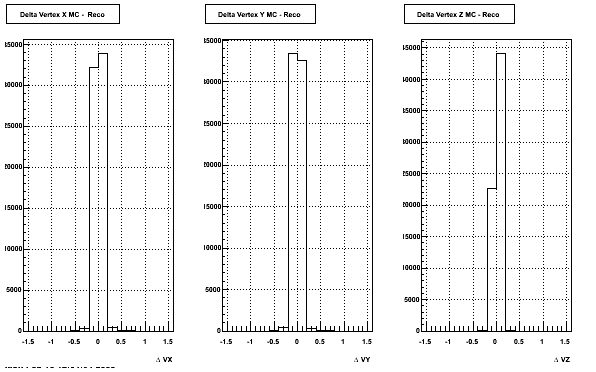
4. Delta Vertex
The following are the Delta Vertex ( Vertex Reconstructed - Vertex Embedded) plot for the 3 diiferent coordinates (x, y and z) (Cuts of vz =30 cm , NFitCut= 25 are applied)
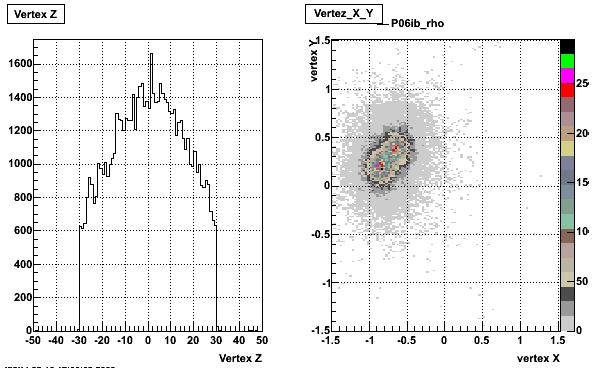
5. Z Vertex and X vs Y vertex
6. Global Variables : Phi and Rapidity
7. Pt
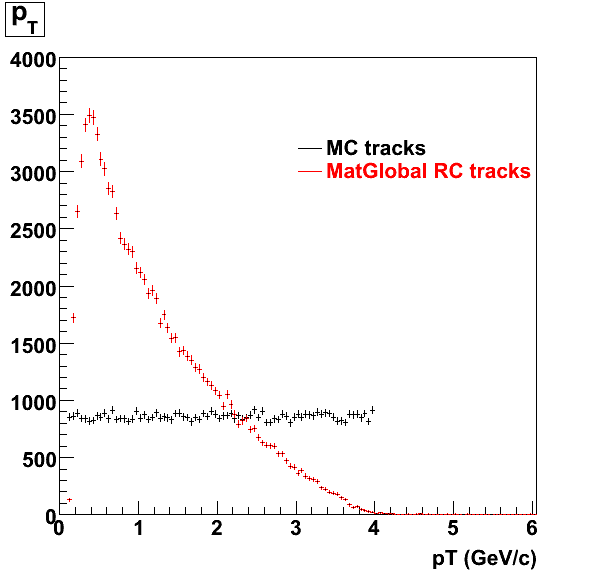
Embedded Rho meson with flat pt (black)and Recosntructed Pion (red).
8. Randomness Plots
The following plots, are to check the randomness of the input Monte Carlo (MC) tracks.
.gif)
QA plots Rho (October 21 2008)
Some QA plots for Rho:
MiniDst files are at PDSF under the path /eliza13/starprod/embedding/p06ib/MiniDst/rho_101/*.minimc.root
MuDst files are at PDSF under /eliza13/starprod/embedding/P06ib/MuDst/10*/*.MuDst.root Reconstruction had been done on PionPlus.
DCA and Nfit Distributions had been scaled by the Integral in different pt ranges
QAPlots_D0
Some QA Plots for D0 located under the path :
/eliza12/starprod/embedding/P06ib/D0_001_1216876386/*
/eliza12/starprod/embedding/P06ib/D0_002_1216876386/ -> Directory empty
Global pairs are used as reconstructed tracks. SOme quality tractst plotiing level were :
Vz Cut 30 cm ;
NfitCut : 25,
Ncommonhits : 10 ;
maxDca :1 cm ; Assuming D0- >pi + pi