Previous results - May 2002
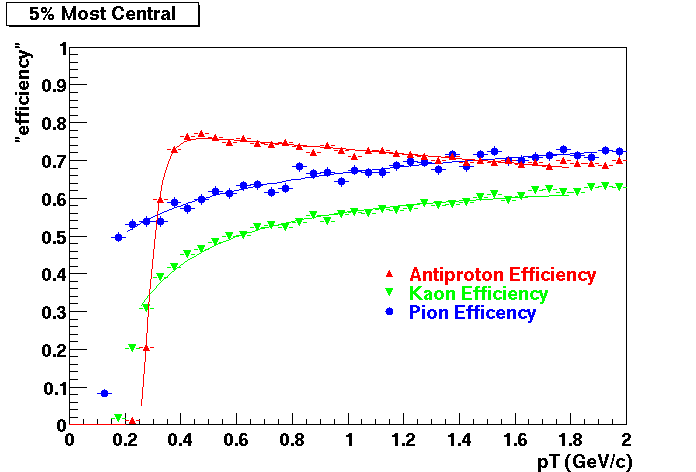
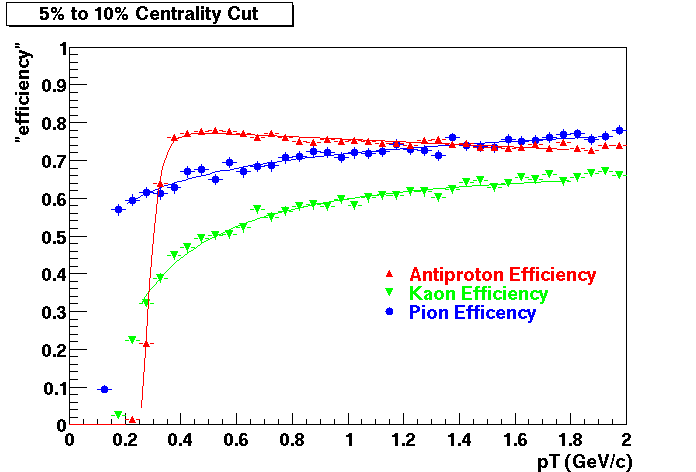
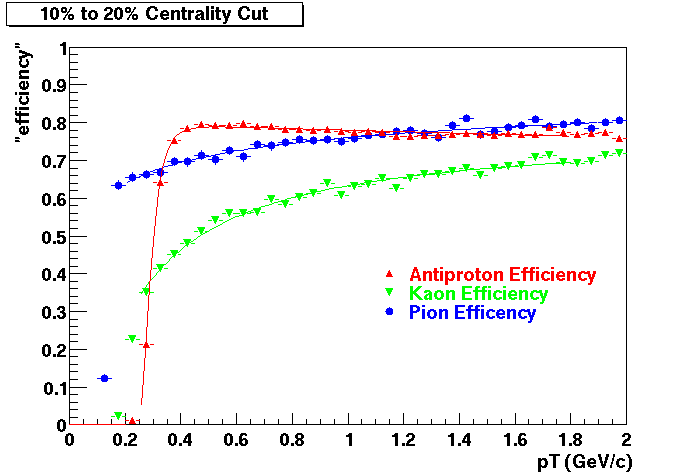
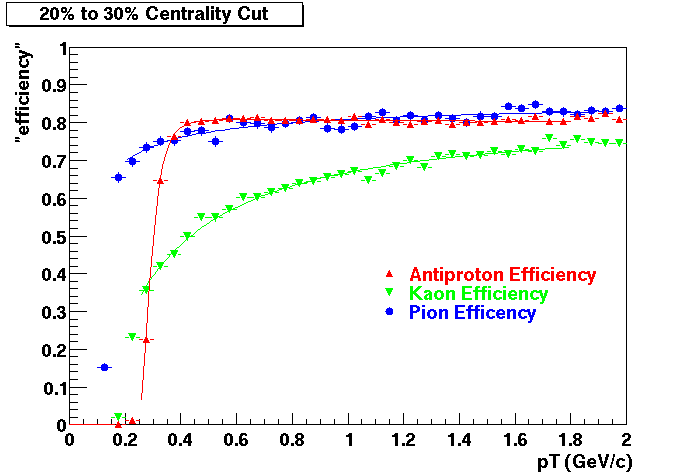
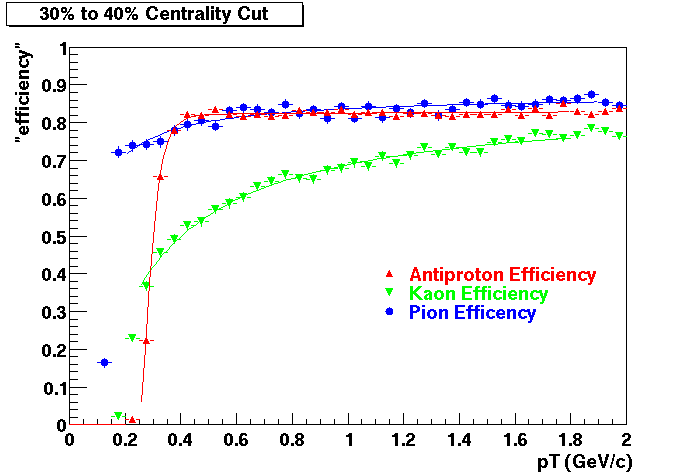
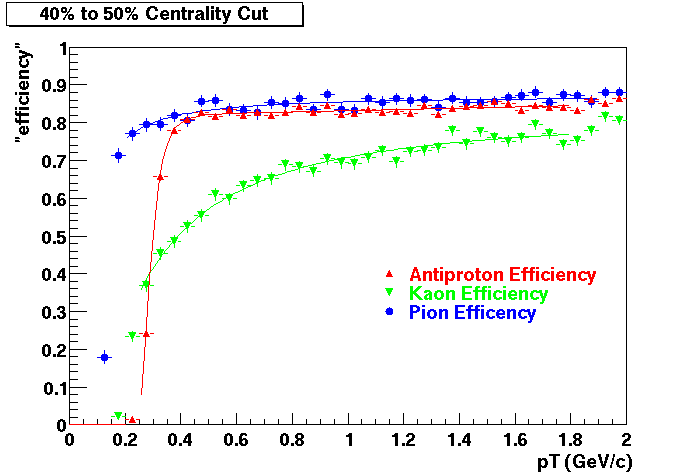
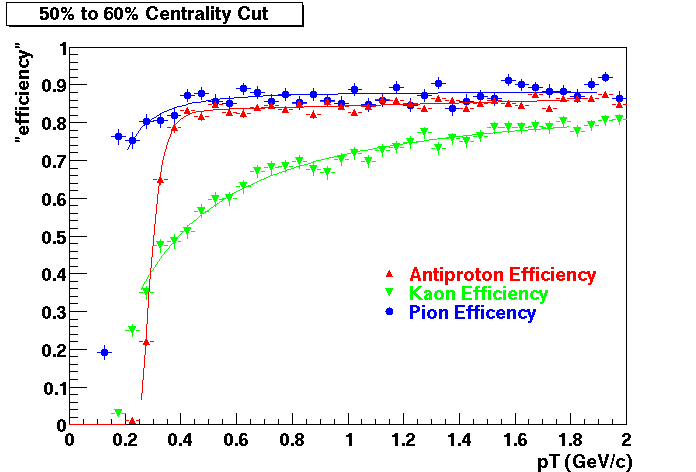
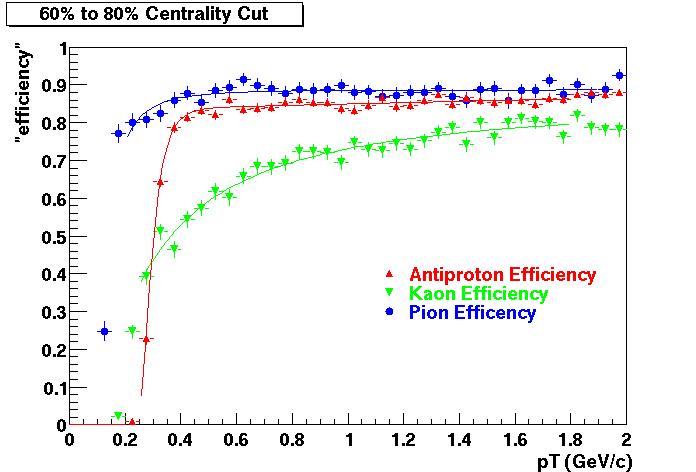
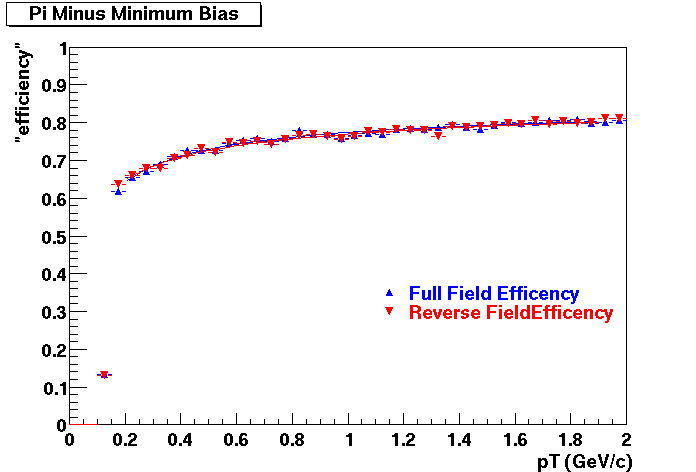
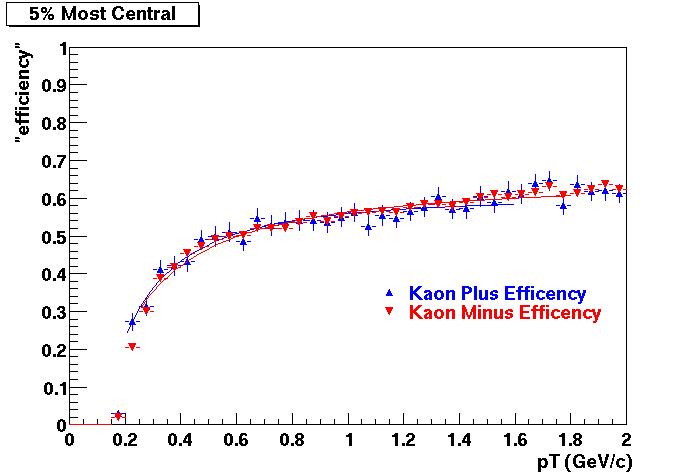
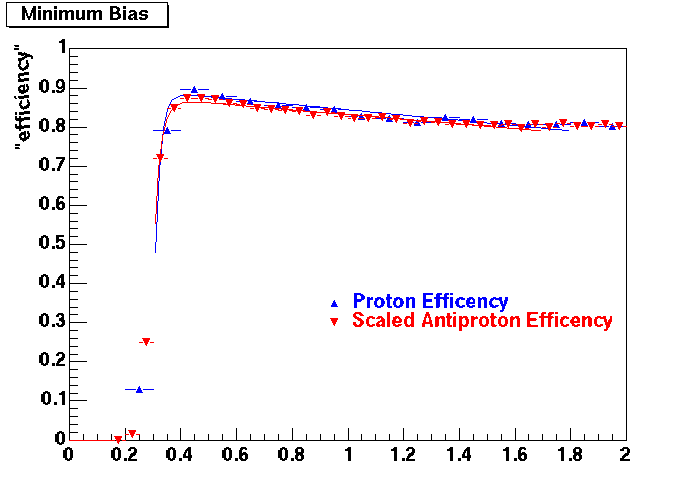
This document is intended to provide all the information available for previous productions such that results for Quality Control studies and Productions Cross checks. Part of quality control studies include identification of missing/dead detector areas, distance of closest approach distributions (dca), and fit points distributions(Nfit). As part of production cross checks, some results in centrality dependance and efficiency are shown
Quality Control
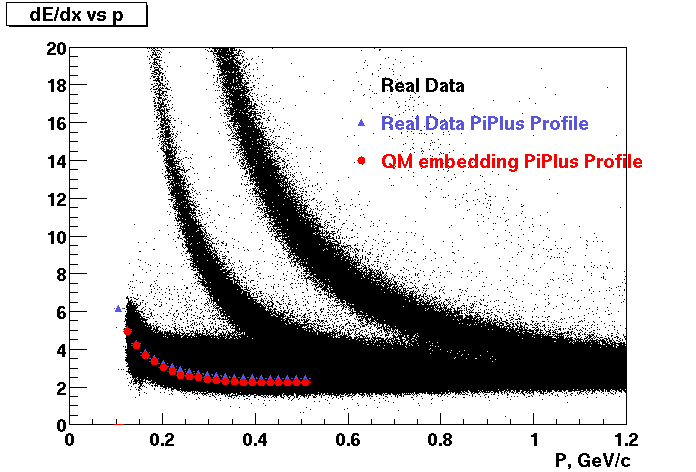
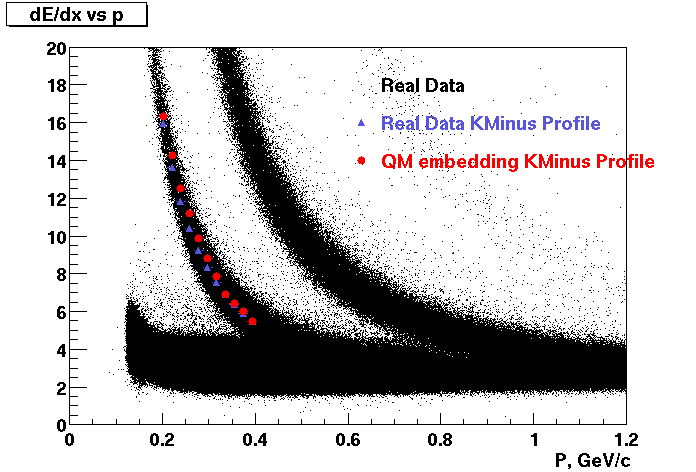
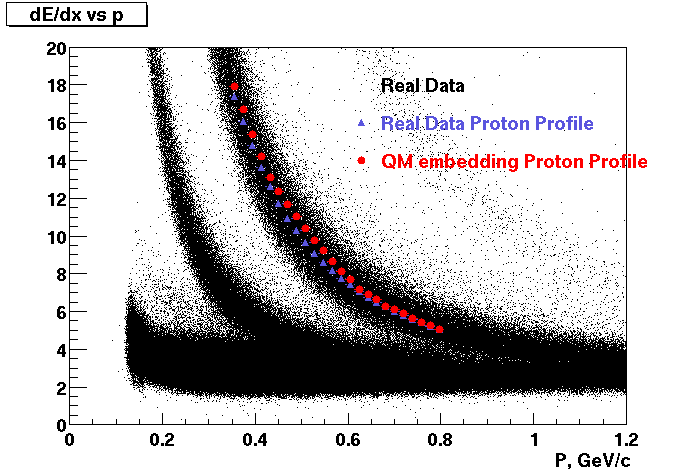
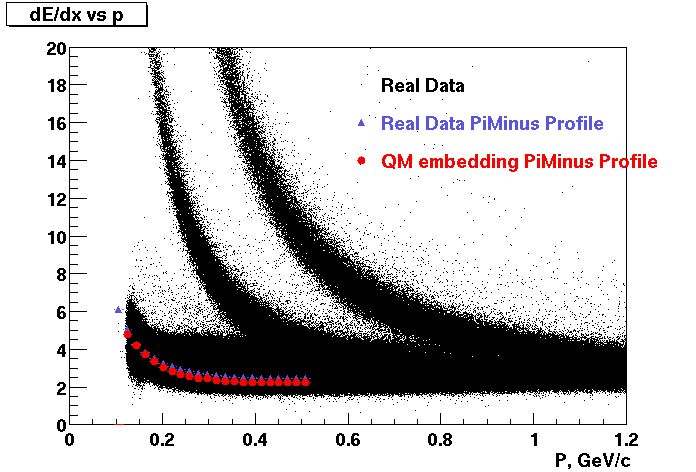
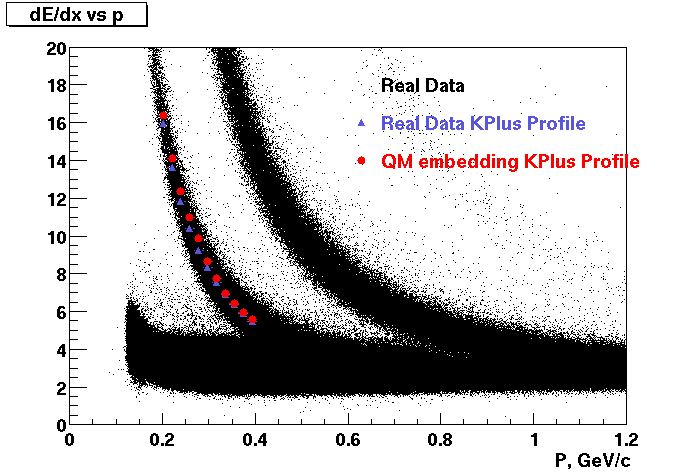
These are dedx vs P graphs. All of them show reasonable agreement with data.(Done on May 2002)
| Pi Minus | K Minus | Proton |
| Pi Plus | K Plus | P Bar |

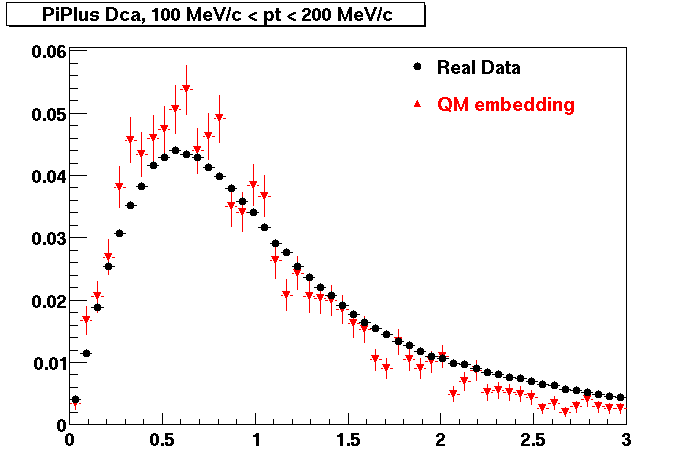
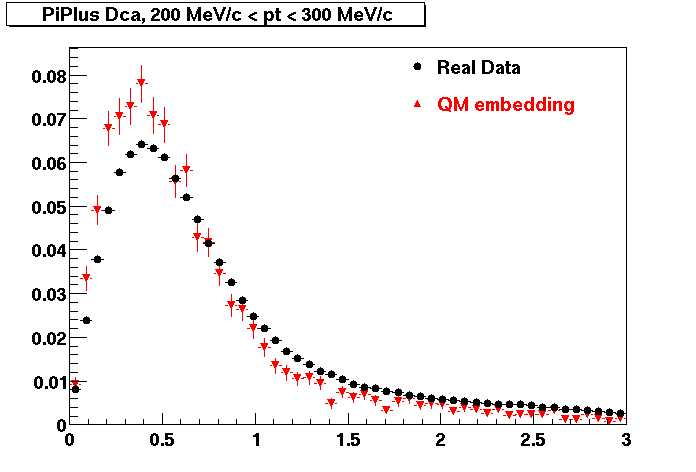
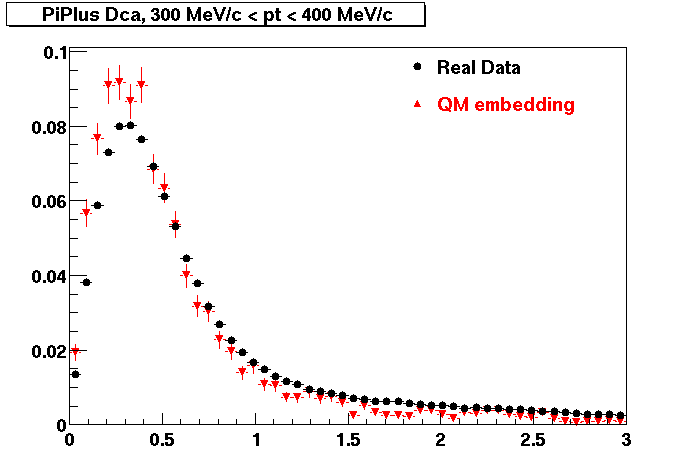
PI PLUS. In the following dca distributions some discrepancy is shown. Due to secondaries?
| Peripheral 0.1 GeV/c < pT < 0.2 Gev/c | MinBias 0.2 GeV/c < pT < 0.3 Gev/c | Central 0.3 GeV/c <pT < 0.4 GeV/c |
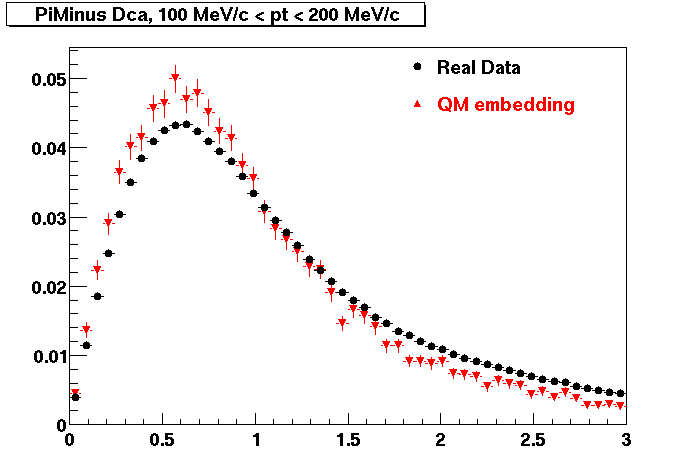
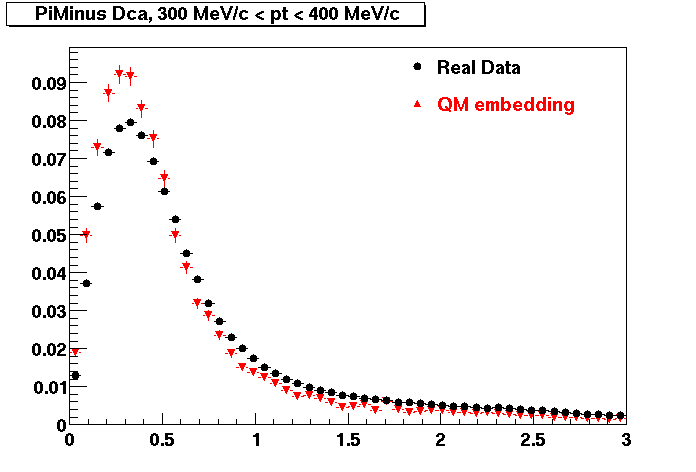
PI MINUS. Some discrepancy is shown. Due to secondaries?
| Peripheral 0.1 GeV/c < pT < 0.2 Gev/c | MinBias 0.2 GeV/c < pT < 0.3 Gev/c | Central 0.3 GeV/c <pT < 0.4 GeV/c |

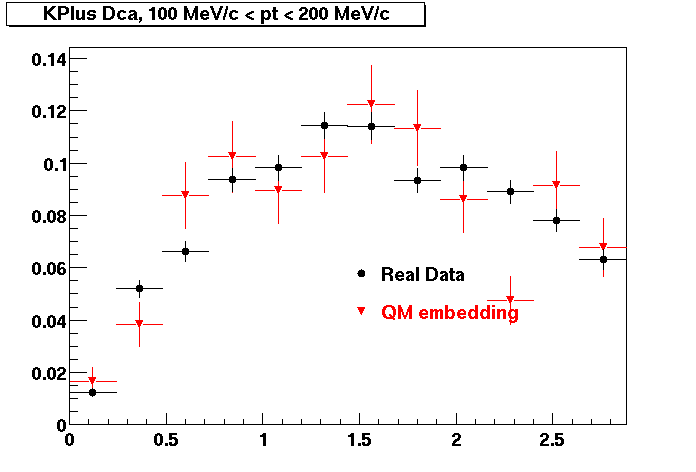
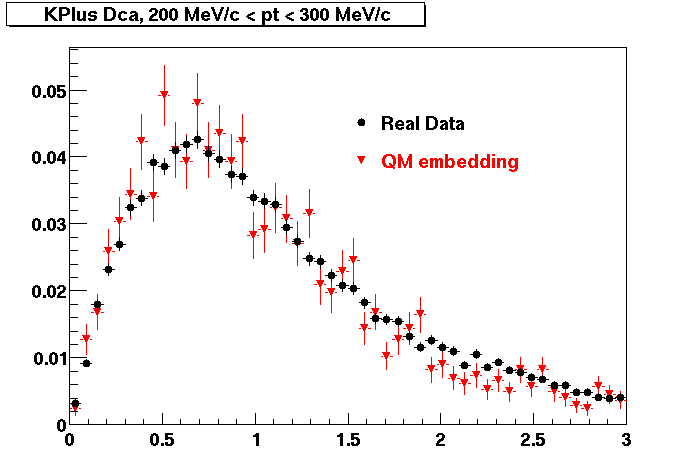
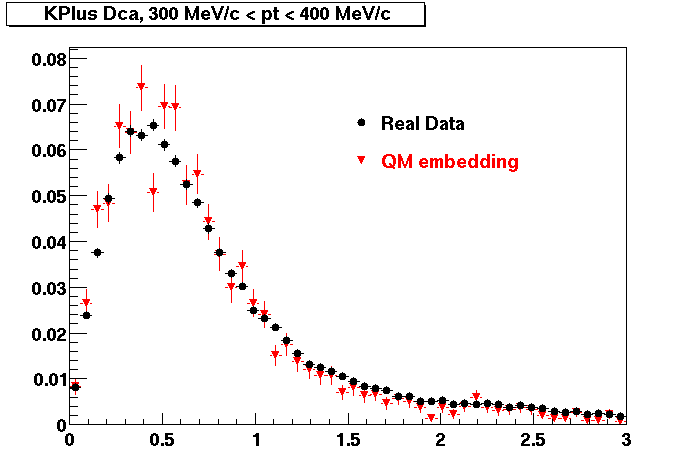
K PLUS. In the following dca distributions Good agreement with data is shown.
| Peripheral 0.1 GeV/c < pT < 0.2 Gev/c | MinBias 0.2 GeV/c < pT < 0.3 Gev/c | Central 0.3 GeV/c <pT < 0.4 GeV/c |
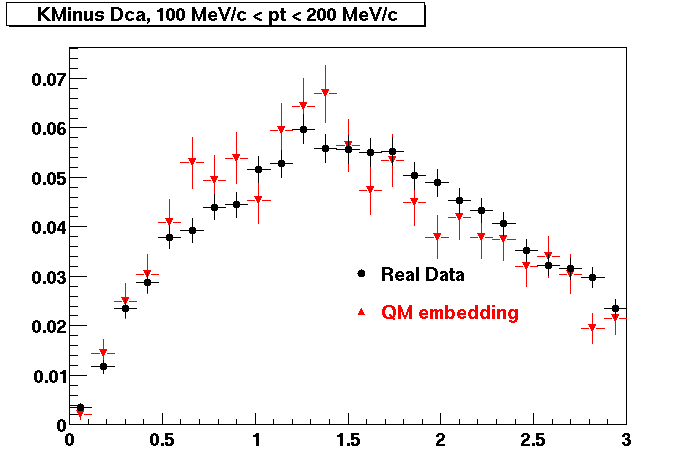
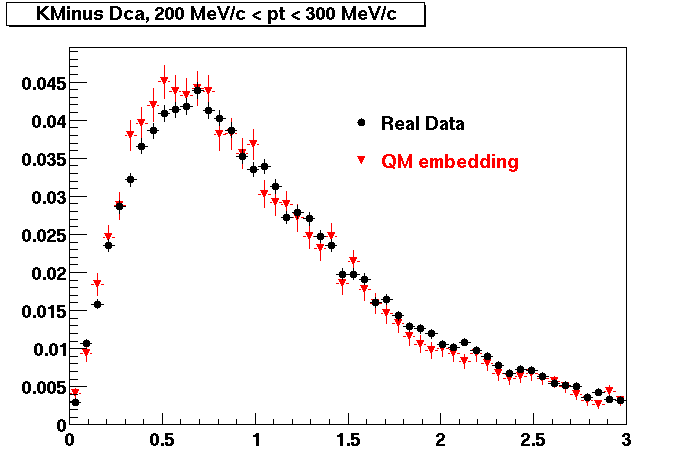
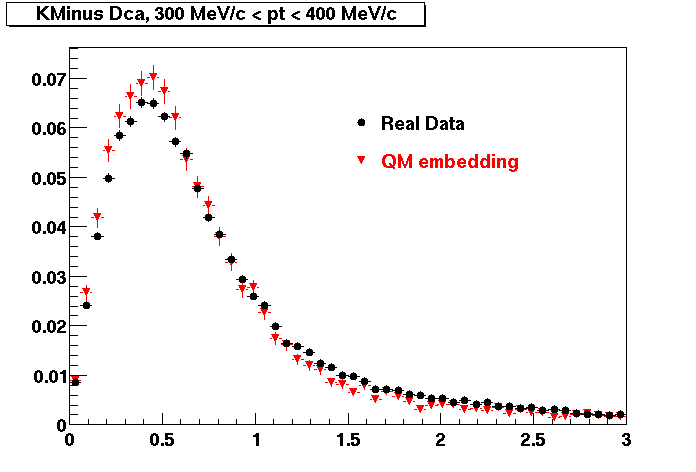
K MINUS. In the following dca distributions Good agreement with data is shown.
| Peripheral 0.1 GeV/c < pT < 0.2 Gev/c | MinBias 0.2 GeV/c < pT < 0.3 Gev/c | Central 0.3 GeV/c <pT < 0.4 GeV/c |
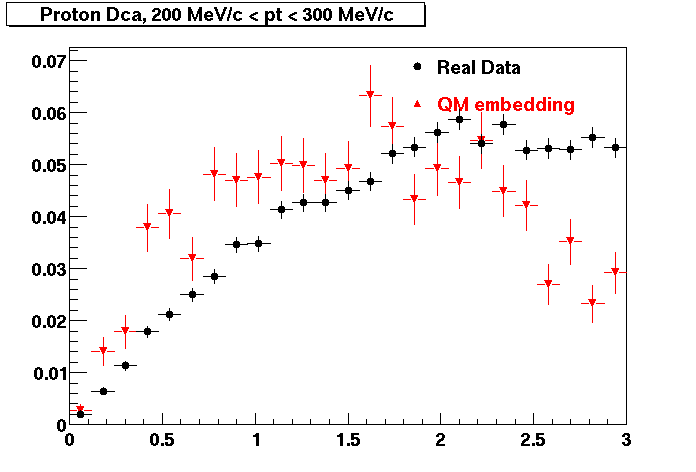
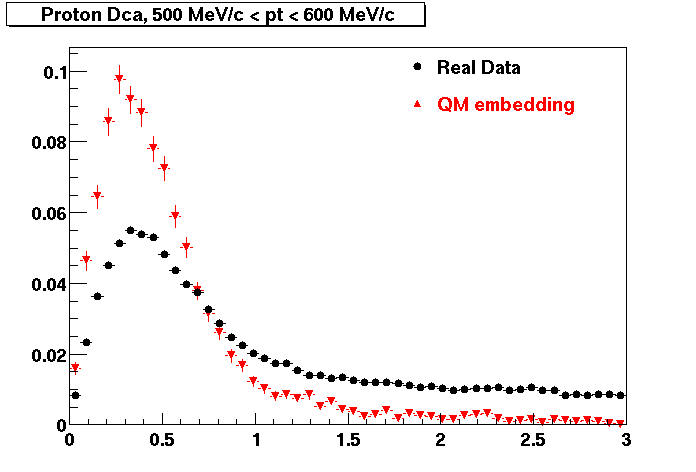
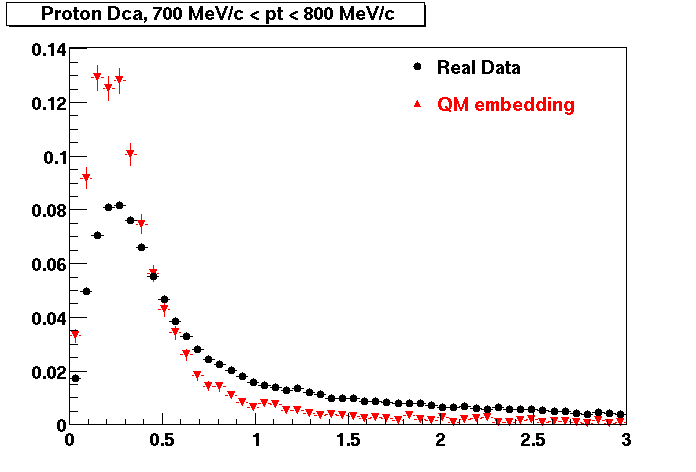
PROTON. The real data Dca distribution is wider, especially at low pT -> Most likely due to secondary tracks in the sample. A tail from background protons dominating distribution at low pt can be clearly seen. Expected deviation from the primary MC tracks.
| Peripheral 0.2 GeV/c < pT < 0.3 Gev/c | MinBias 0.5 GeV/c < pT < 0.6 Gev/c | Central 0.7 GeV/c <pT < 0.8 GeV/c |
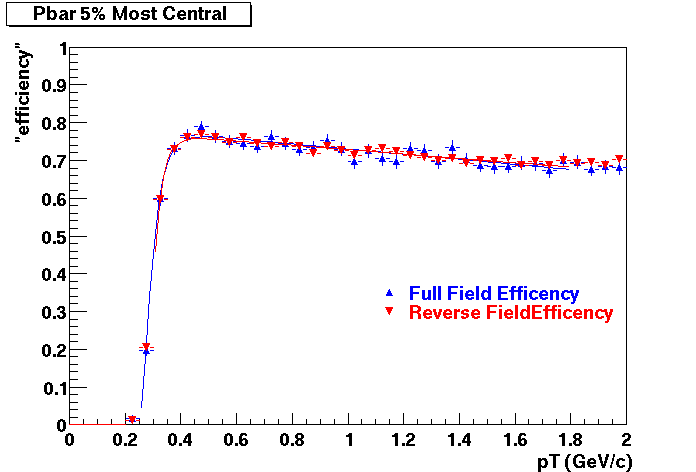
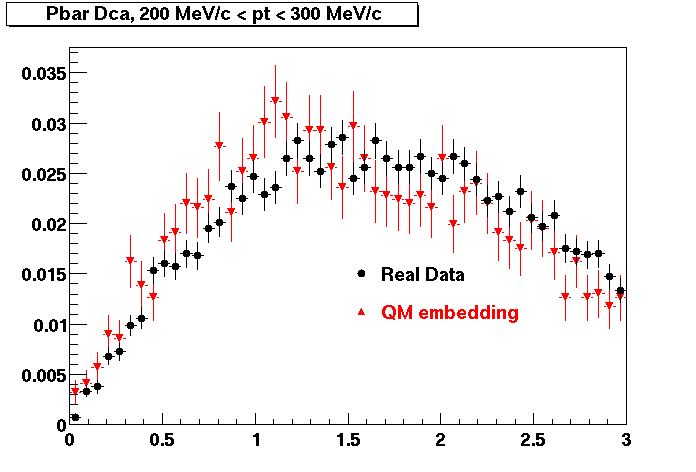
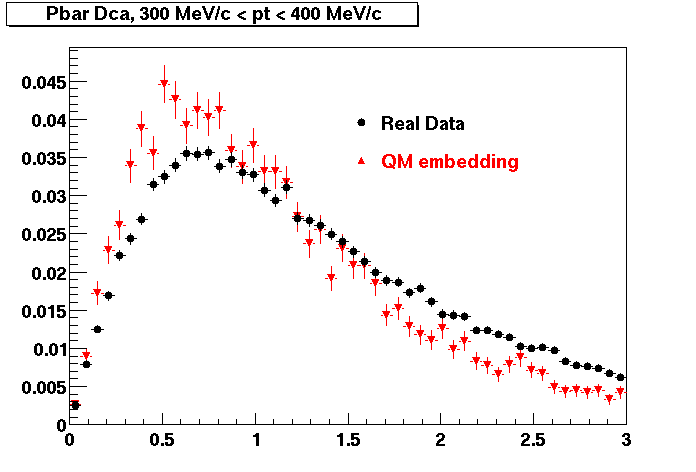
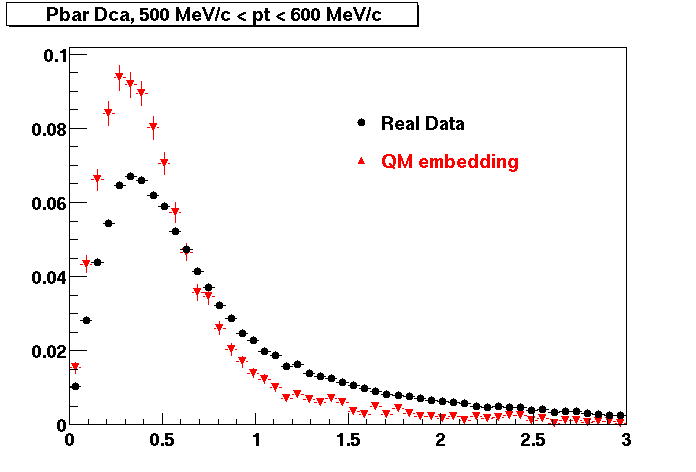
Pbar. The real data Dca distribution is wider, especially at low pT -> Most likely due to secondary tracks in the sample.
| Peripheral 0.2 GeV/c < pT < 0.3 Gev/c | MinBias 0.3 eV/c < pT < 0.4 Gev/c | Central 0.5 GeV/c <pT < 0.6 GeV/c |
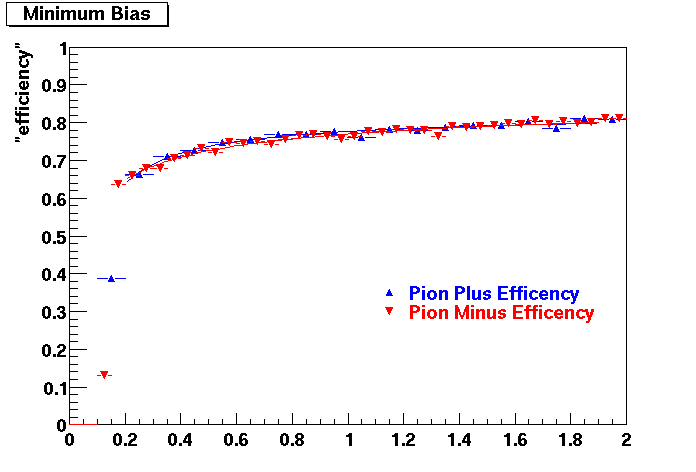
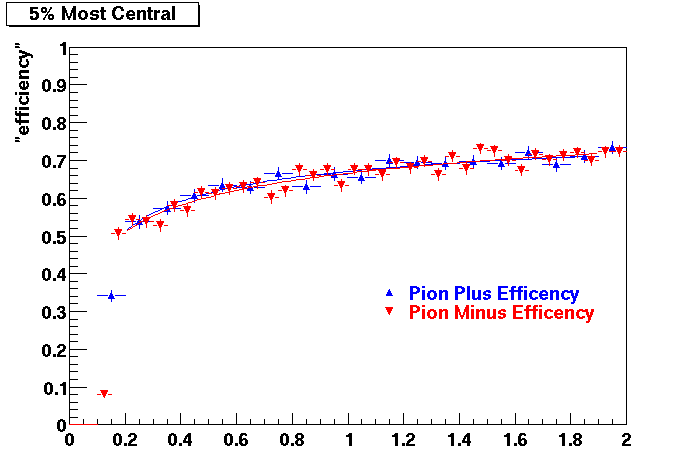
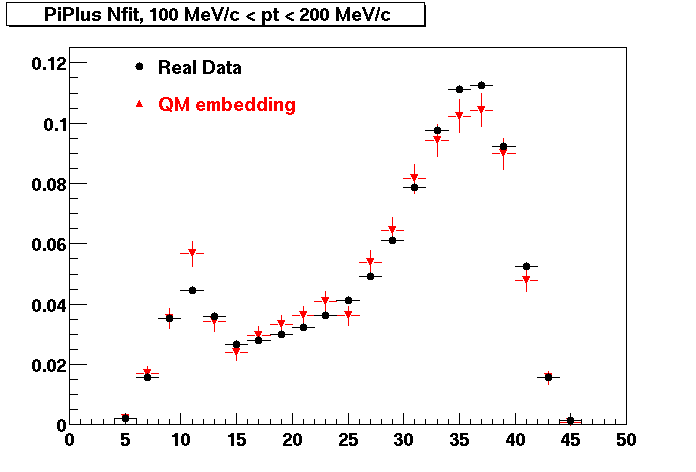
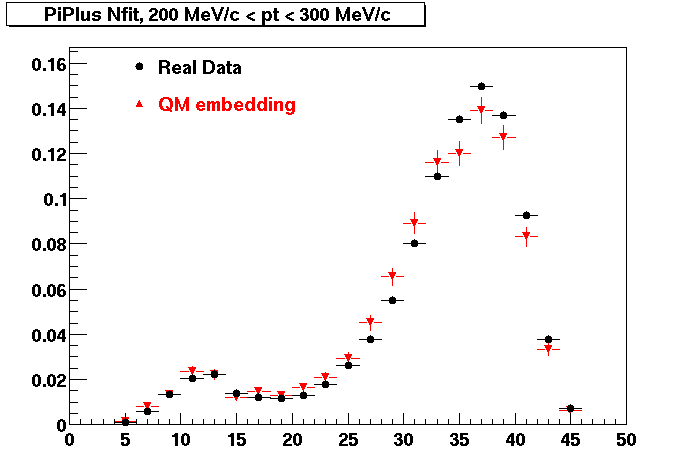
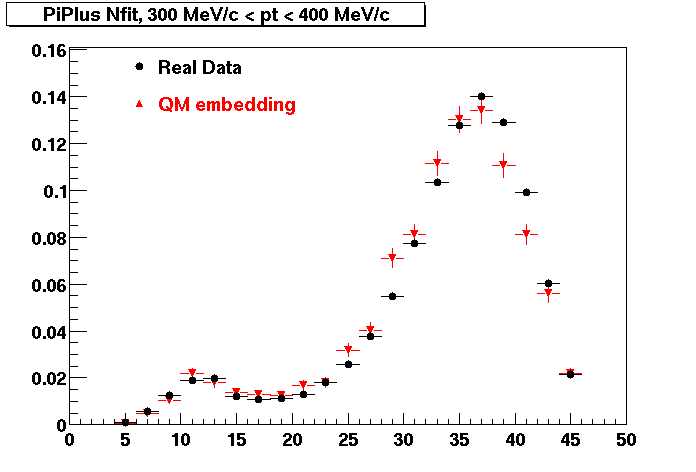
PI PLUS. Good agreement with data is shown.
| Peripheral 0.1 GeV/c < pT < 0.2 Gev/c | MinBias 0.2 GeV/c < pT < 0.3 Gev/c | Central 0.3 GeV/c <pT < 0.4 GeV/c |
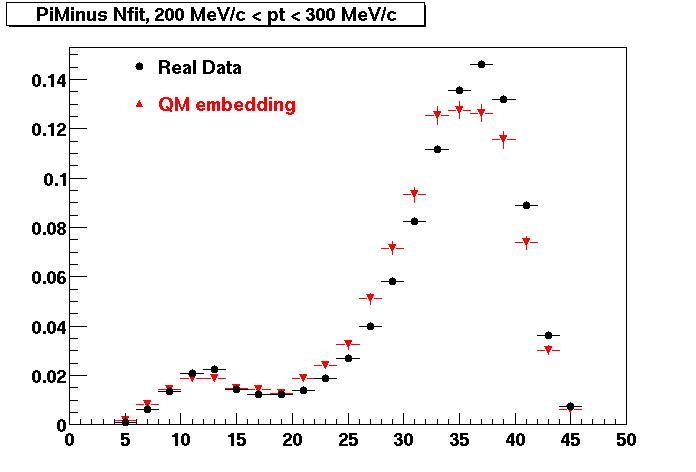
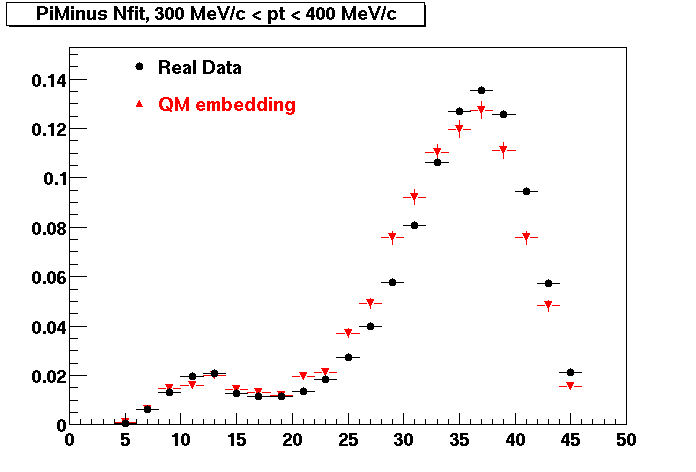
PI MINUS. Good agreement with data is shown.
| Peripheral 0.1 GeV/c < pT < 0.2 Gev/c | Peripheral 0.2 GeV/c < pT < 0.3 Gev/c | Peripheral 0.3 GeV/c < pT < 0.4 Gev/c |

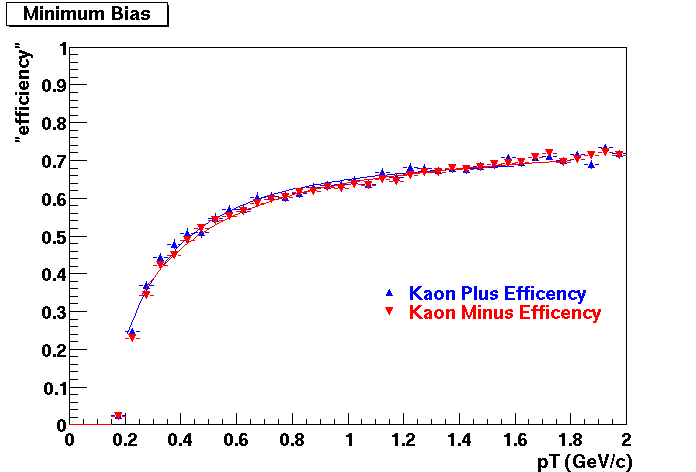
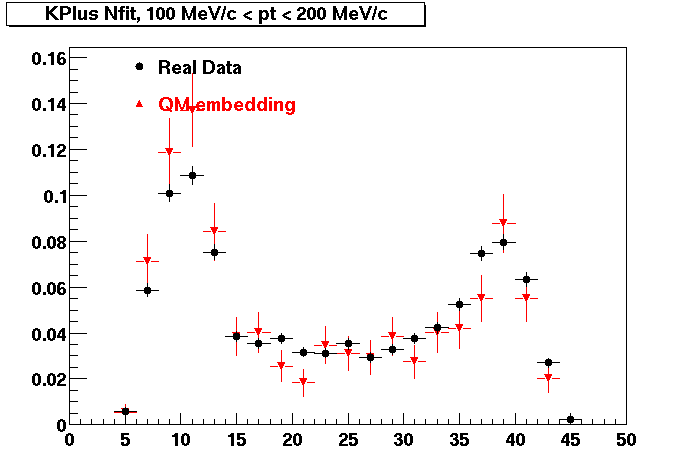
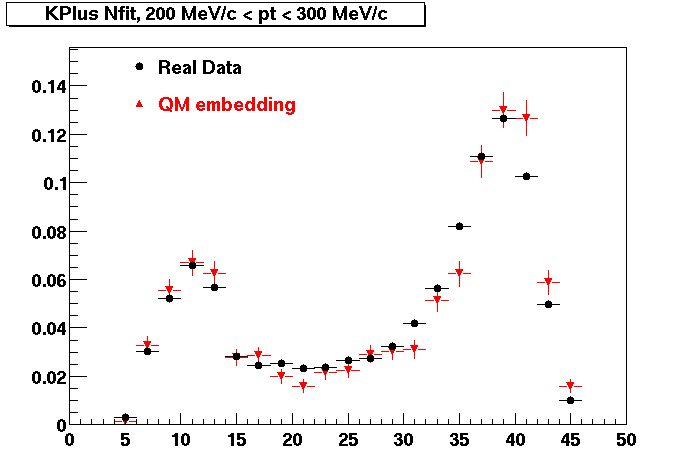
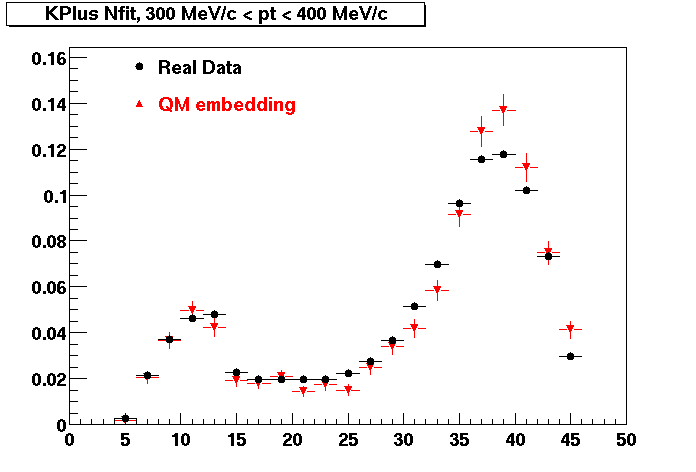
K PLUS. Good agreement with data is shown.
| Peripheral 0.1 GeV/c < pT < 0.2 Gev/c | MinBias 0.2 GeV/c < pT < 0.3 Gev/c | Central 0.3 GeV/c <pT < 0.4 GeV/c |
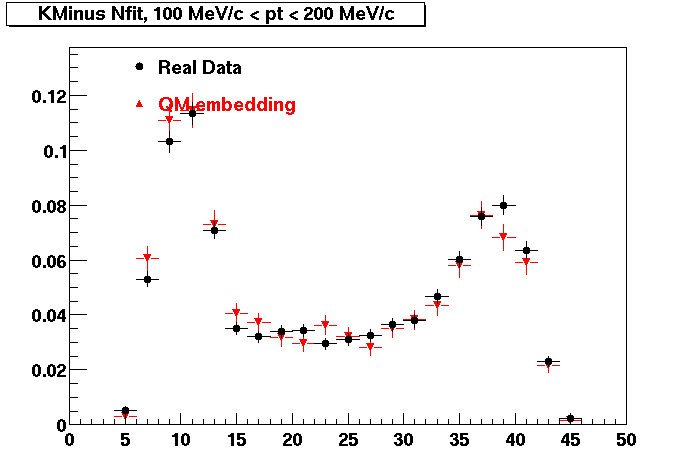
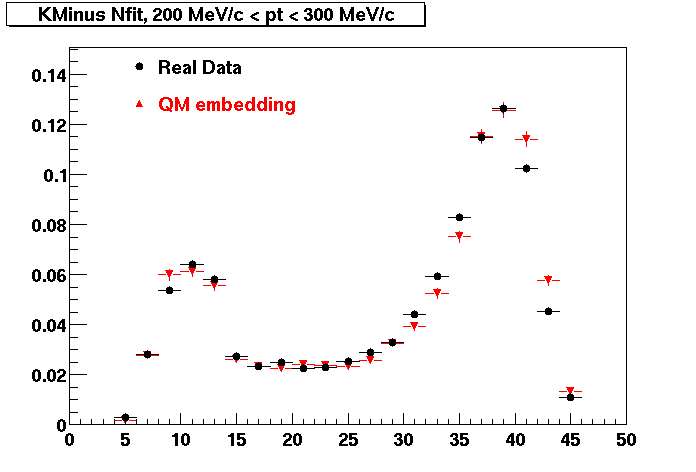
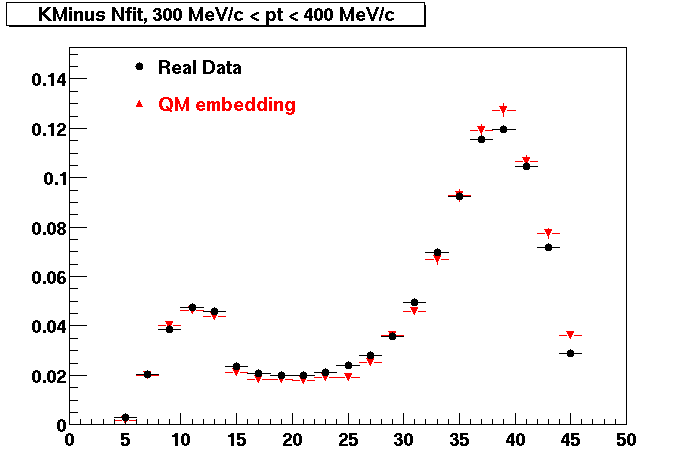
K MINUS. Good agreement with data is shown.
| Peripheral 0.1 GeV/c < pT < 0.2 Gev/c | Peripheral 0.2 GeV/c < pT < 0.3 Gev/c | Peripheral 0.3 GeV/c < pT < 0.4 Gev/c |
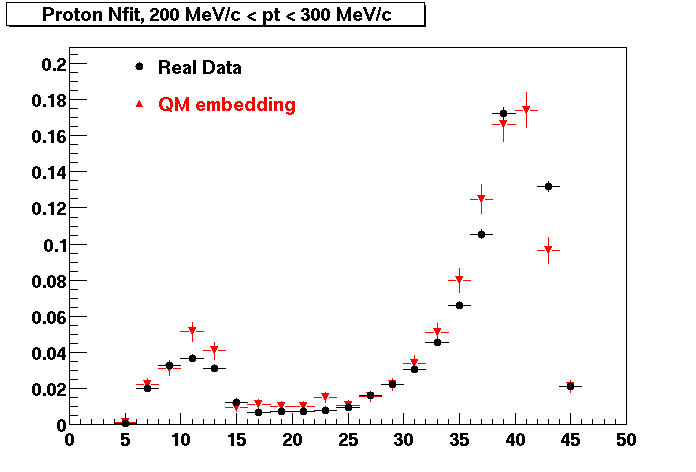
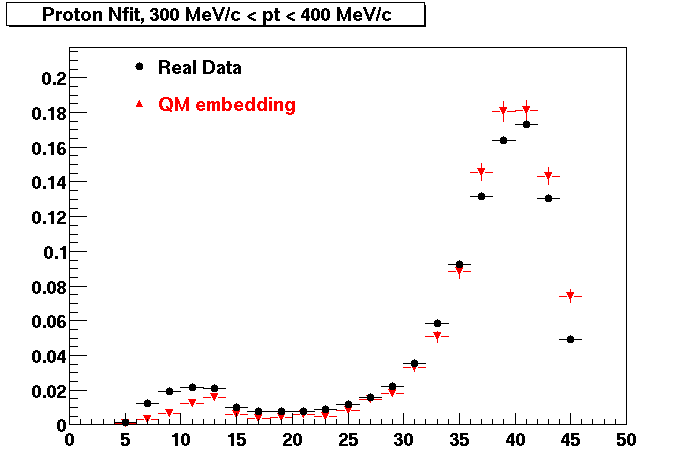
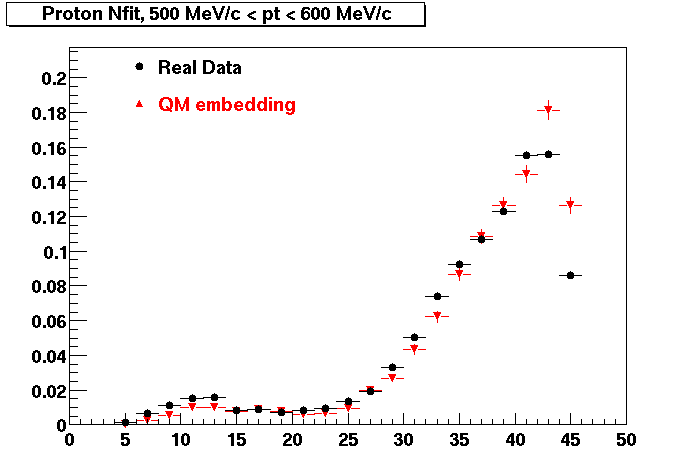
PROTON. Good agreement with data is shown.
| Peripheral 0.2 GeV/c < pT < 0.3 Gev/c | Peripheral 0.3 GeV/c < pT < 0.4 Gev/c | Peripheral 0.5 GeV/c < pT < 0.6 Gev/c |
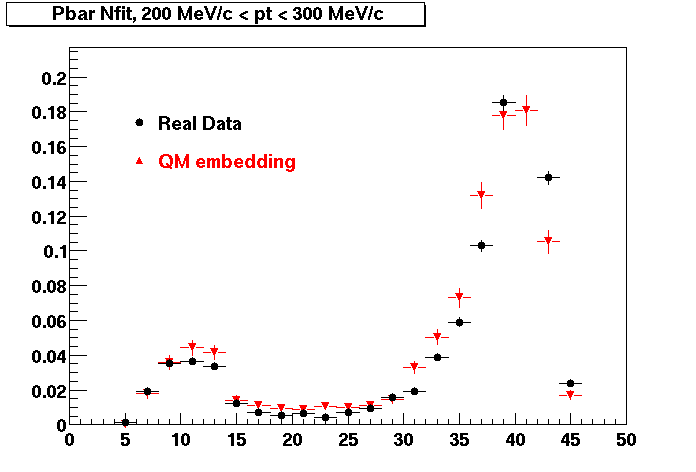
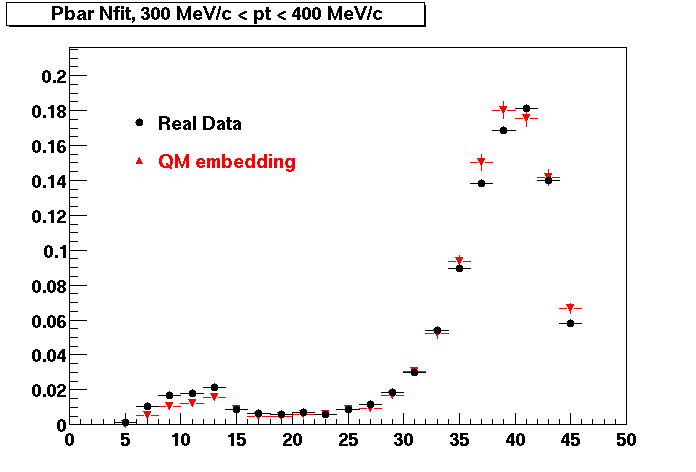
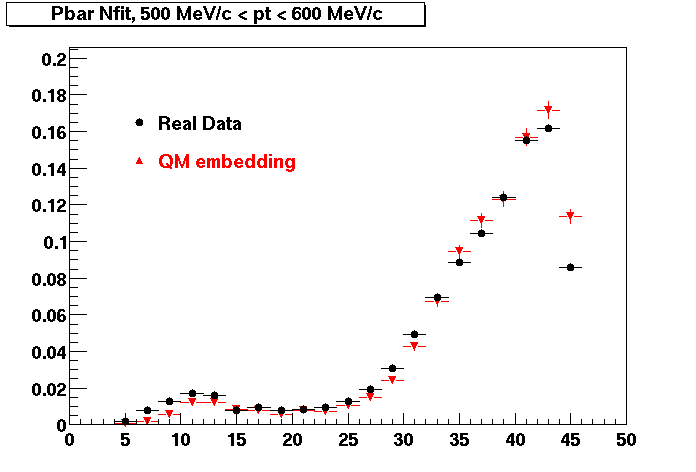
Pbar. Good agreement with data is shown.
| Peripheral 0.2 GeV/c < pT < 0.3 Gev/c | Peripheral 0.3 GeV/c < pT < 0.4 Gev/c | Peripheral 0.5 GeV/c < pT < 0.6 Gev/c |