Eta v. Phi
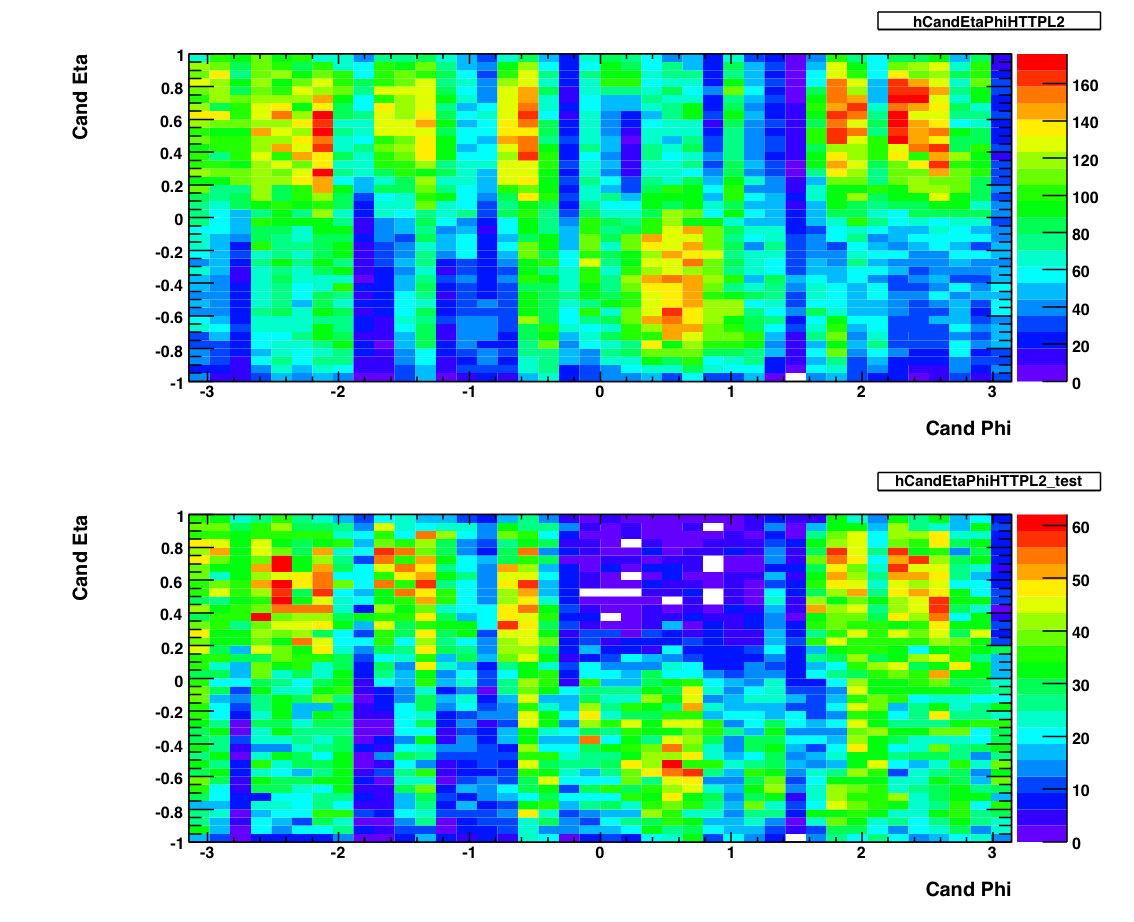
The above plots show 2-d histograms of eta and phi for pion candidates. The plot on the top shows the candidates from the production L2-G trigger. The plot on the bottom shows the eta and phi distribution for candidates from the L2-G 'test' trigger. As of May 2007, I am not using these to exclude any runs. I used Frank's pion trees to make these plots, imposing the following cuts on any pion candidate:
- Energy > 0.1 GeV
- PT > 5.0 GeV
- Asymmetry < .8
- Mass between .08 and .25 GeV
- No charged track association.
- BBC Timebin = 7,8 or 9.
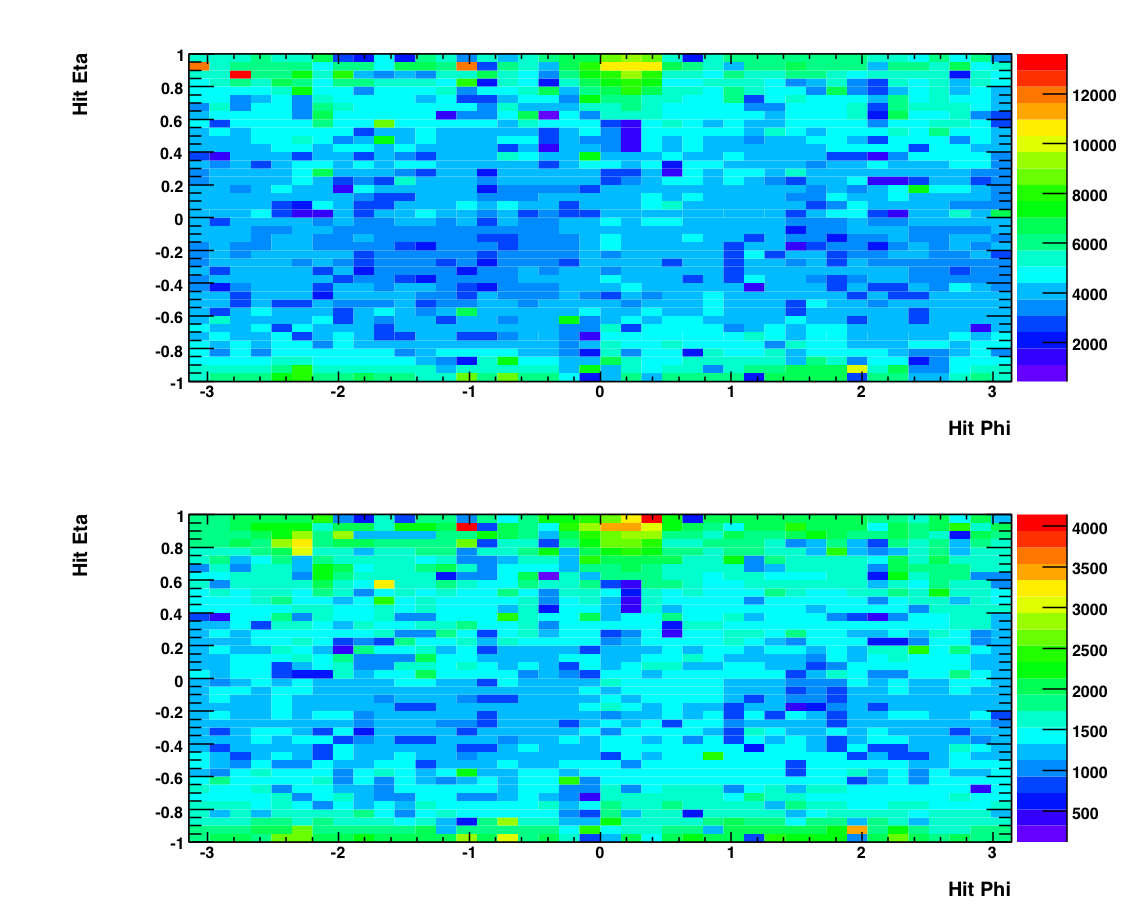
The above plot shows histograms of the eta and phi positions of individual photons (hits). Again the top plot shows photons from events from the production L2-G trigger while the bottom shows photons from the 'test' L2-G trigger. Note the lack of structure in these plots compared to the candidate plots. This is due to the SMD, which is used in making the top plots (i.e. a candidate needs to have good SMD information) and unused in the bottom plots (a hit does not reference the SMD.) The status tables for different fill periods can be found at the bottom of this page. You can see that there are some gaps in the smd which could be responsible for the structure in the Candidate plot.