2017 cosmic ray tests at OSU and BNL
Scans of the logbook for supersector tests may be downloaded here:
- pages cover-49: drupal.star.bnl.gov/STAR/system/files/EPD%20SS%20testing%20pp%201-49.pdf
- pages 50-99: drupal.star.bnl.gov/STAR/system/files/EPD%20SS%20testing%20pp%2050-99.pdf
- pages 100-149: drupal.star.bnl.gov/STAR/system/files/EPD%20SS%20testing%20pp%20100-149.pdf
- pages 150-160: drupal.star.bnl.gov/STAR/system/files/EPD%20SS%20testing%20pp%20150-160.pdf
- pages 161-174: drupal.star.bnl.gov/STAR/system/files/EPD%20SS%20testing%20pp%20161-174.pdf
Excel file with data: drupal.star.bnl.gov/STAR/system/files/EPDCosmicData.xlsx
Test configuration 1
- SS from top to bottom: 8, 5, 6, 7
- ADC spectra:
- Tracking Analysis Even: drupal.star.bnl.gov/STAR/system/files/EPDCosmicHits_evenAll.pdf
- Tracking Analysis Odd: drupal.star.bnl.gov/STAR/system/files/EPDCosmicHits_oddAll.pdf
SS05
- Key construction/Test notes: Test Configuration 1
- ADC spectra by tile: drupal.star.bnl.gov/STAR/system/files/AdcSpectra_SS5.pdf
- Vertical Cosmic Ray Analysis:
- Summary: Efficiency is 0.42% +/- 0.03%, Cross-talk frequency is 0.53% +/- 0.04%
SS06
- Key construction/Test notes: Test Configuration 1, off-set by ~0.5cm in the test set-up
- ADC spectra by tile: drupal.star.bnl.gov/STAR/system/files/AdcSpectra_SS6.pdf
- Vertical Cosmic Ray Analysis:
- Summary: Efficiency is 2.77% +/- 0.08%, Cross-talk frequency is 1.92% +/- 0.07%
SS07
- Key construction/Test notes: Test Configuration 1
- ADC spectra by tile: drupal.star.bnl.gov/STAR/system/files/AdcSpectra_SS7.pdf
- Vertical Cosmic Ray Analysis:
- Summary:
SS08
- Key construction/Test notes: Test Configuration 1
- ADC spectra by tile: drupal.star.bnl.gov/STAR/system/files/AdcSpectra_SS8.pdf:
- Vertical Cosmic Ray Analysis:
- Summary:
SS09
SS10
Cosmic Tests at BNL - Diagonal issue
While running at BNL, it was noticed that there was a diagonal line when looking at the correlation between two tiles. Essentially, they would both fire, and with ADCs that are strongly correlated.
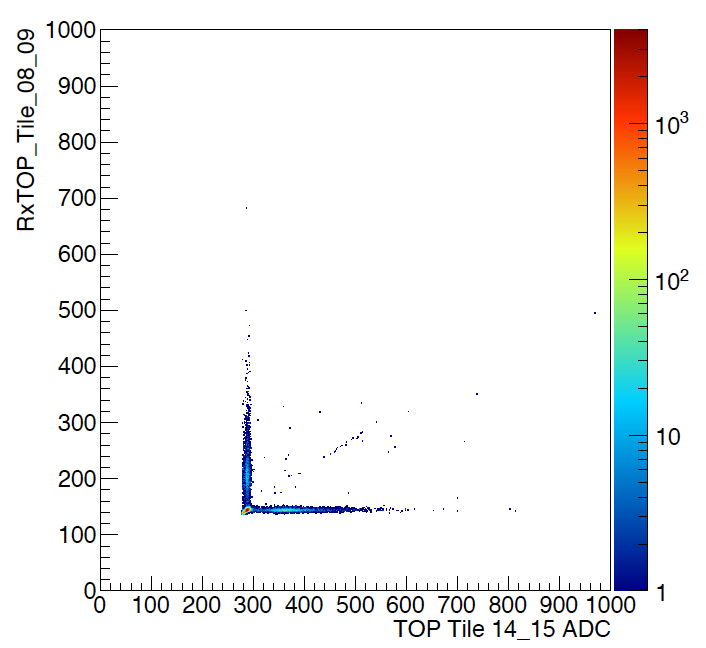
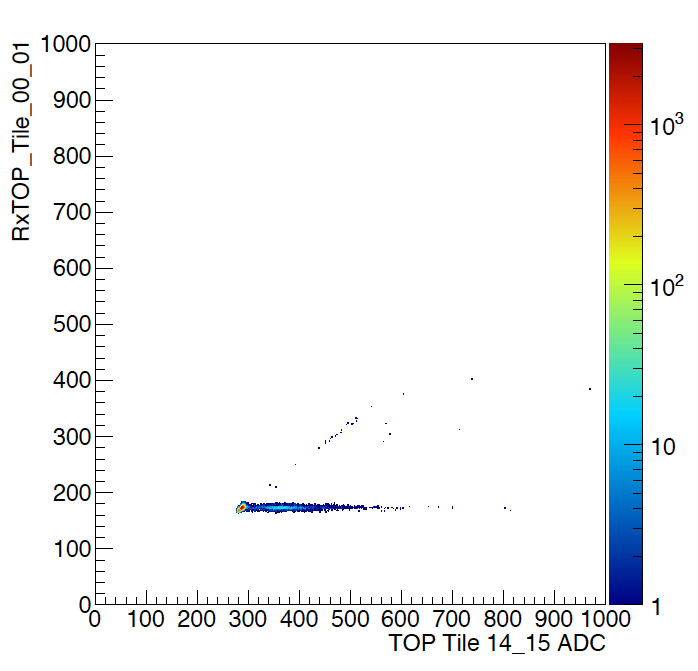
Figure 1: Example correlation between two tiles on the left, example correlation between a tile and the empty tile at tile "zero".
In Figure 1, we can see an example of this. As expected, one can see that pedestal and mip peak for each tile, completely uncorrelated with the signal in the other, except for the points along the diagonal. In fact, this was even seen in the first channel when running on evens (which we have called tile 0). Since there is no tile, or fiber, there is no way for there to be a signal.
The entire set of correlations can be seen at: drupal.star.bnl.gov/STAR/system/files/Histos12142017_EPD_Diagonal.pdf
It should be noted here that the last 4 tiles of the bottom SS were removed from the ADC in slot 7 to the empty ADC (given the labels blank0, etc). In fact, if we select events in which tile 0 in the top supersector had a significantly higher than pedestal value (adc > 250), we see that we can pull this diagonal correlation from all channels, other than those from the "empty" ADC: drupal.star.bnl.gov/STAR/system/files/Histos12142017_EPD_Diagonal_SelectedonTile0.pdf
What was noticed is that the last ADC, which had been empty, did not show this characteristic diagonal correlation. This is true even with the data being added to it. (We noted that the empty channels in the previously full ADC do show it, but none of the channels on the empty one showed it either before or after putting the data into the system). One difference was the timing, the first 4 ADCs were 28 ns behind. Another was that the logic feeding these ADCs, it looked sort of like the 4-fold coincidence was a 3-fold (at least it was firing more often than the other, and we could not put the level any higher in coincidence), so we moved this cables into a more stable one and verified that both sets now fired precisely the same. We also removed the 28 ns of extra cable, so everything was a the same timing.
After doing this, the diagonal correlation seems to go away:
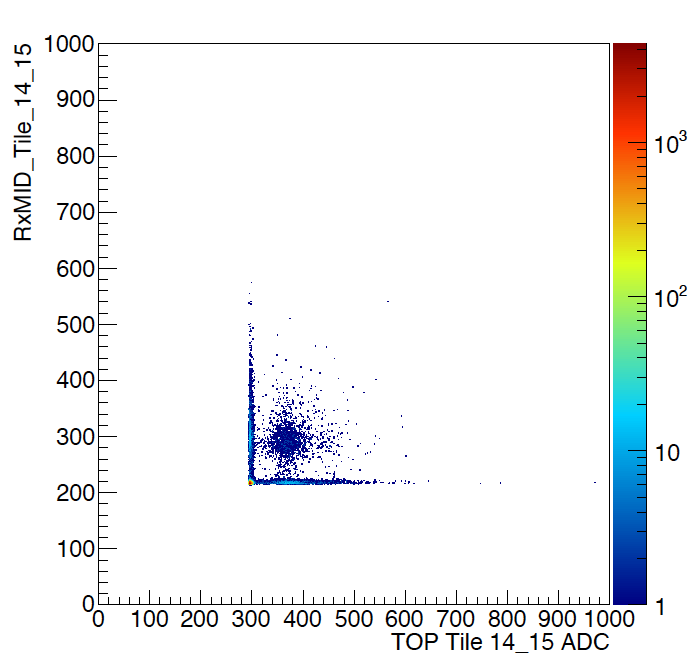
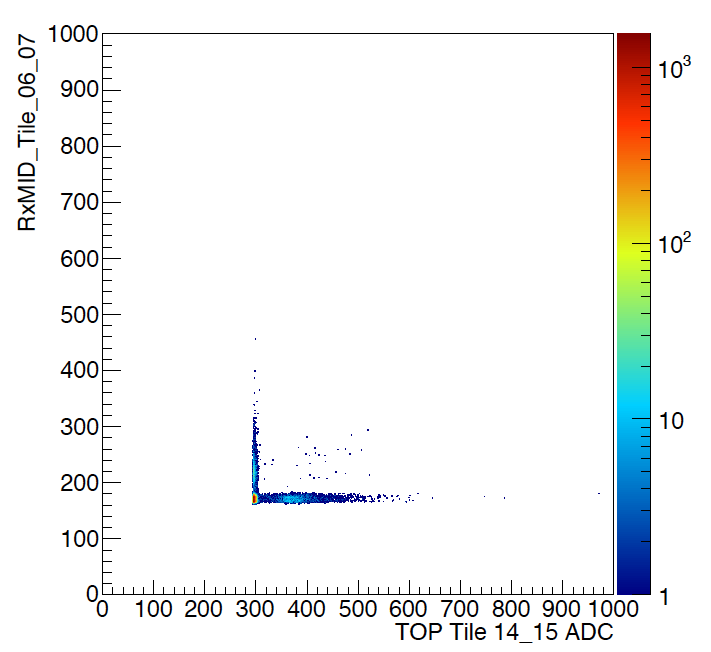
Figure 2: Two correlations after our fix which do not seem to show the diagonal line.
In Figure 2, we do not see any evidence of this correlation. On the left is the correlation between tile 14 on the top and in the middle, so the correlation in the middle is from true cosmic rays. On the right is the correlation between tile 14 on the top and tile 6 in the middle. One can see the pedestal and MIP peaks for both, which are mostly uncorrelated as expected. (The few points in the middle could be from diagonal cosmics.)
The full range of correlations from these channels can be seen at: drupal.star.bnl.gov/STAR/system/files/Histos12152017_EPD_NoDiagonalProblem.pdf
First Autumn 2017 cosmic tests at STAR
After Thanksgiving, we have placed a stack of threePhase 1 - Nov-Dec 2017
For "phase 1" of these tests, we are reading out with a CAMAC-based DAQ system which was developed largely by Wanbing He and Xinyue Ju.
Here are some photos of the first day of "phase 1".
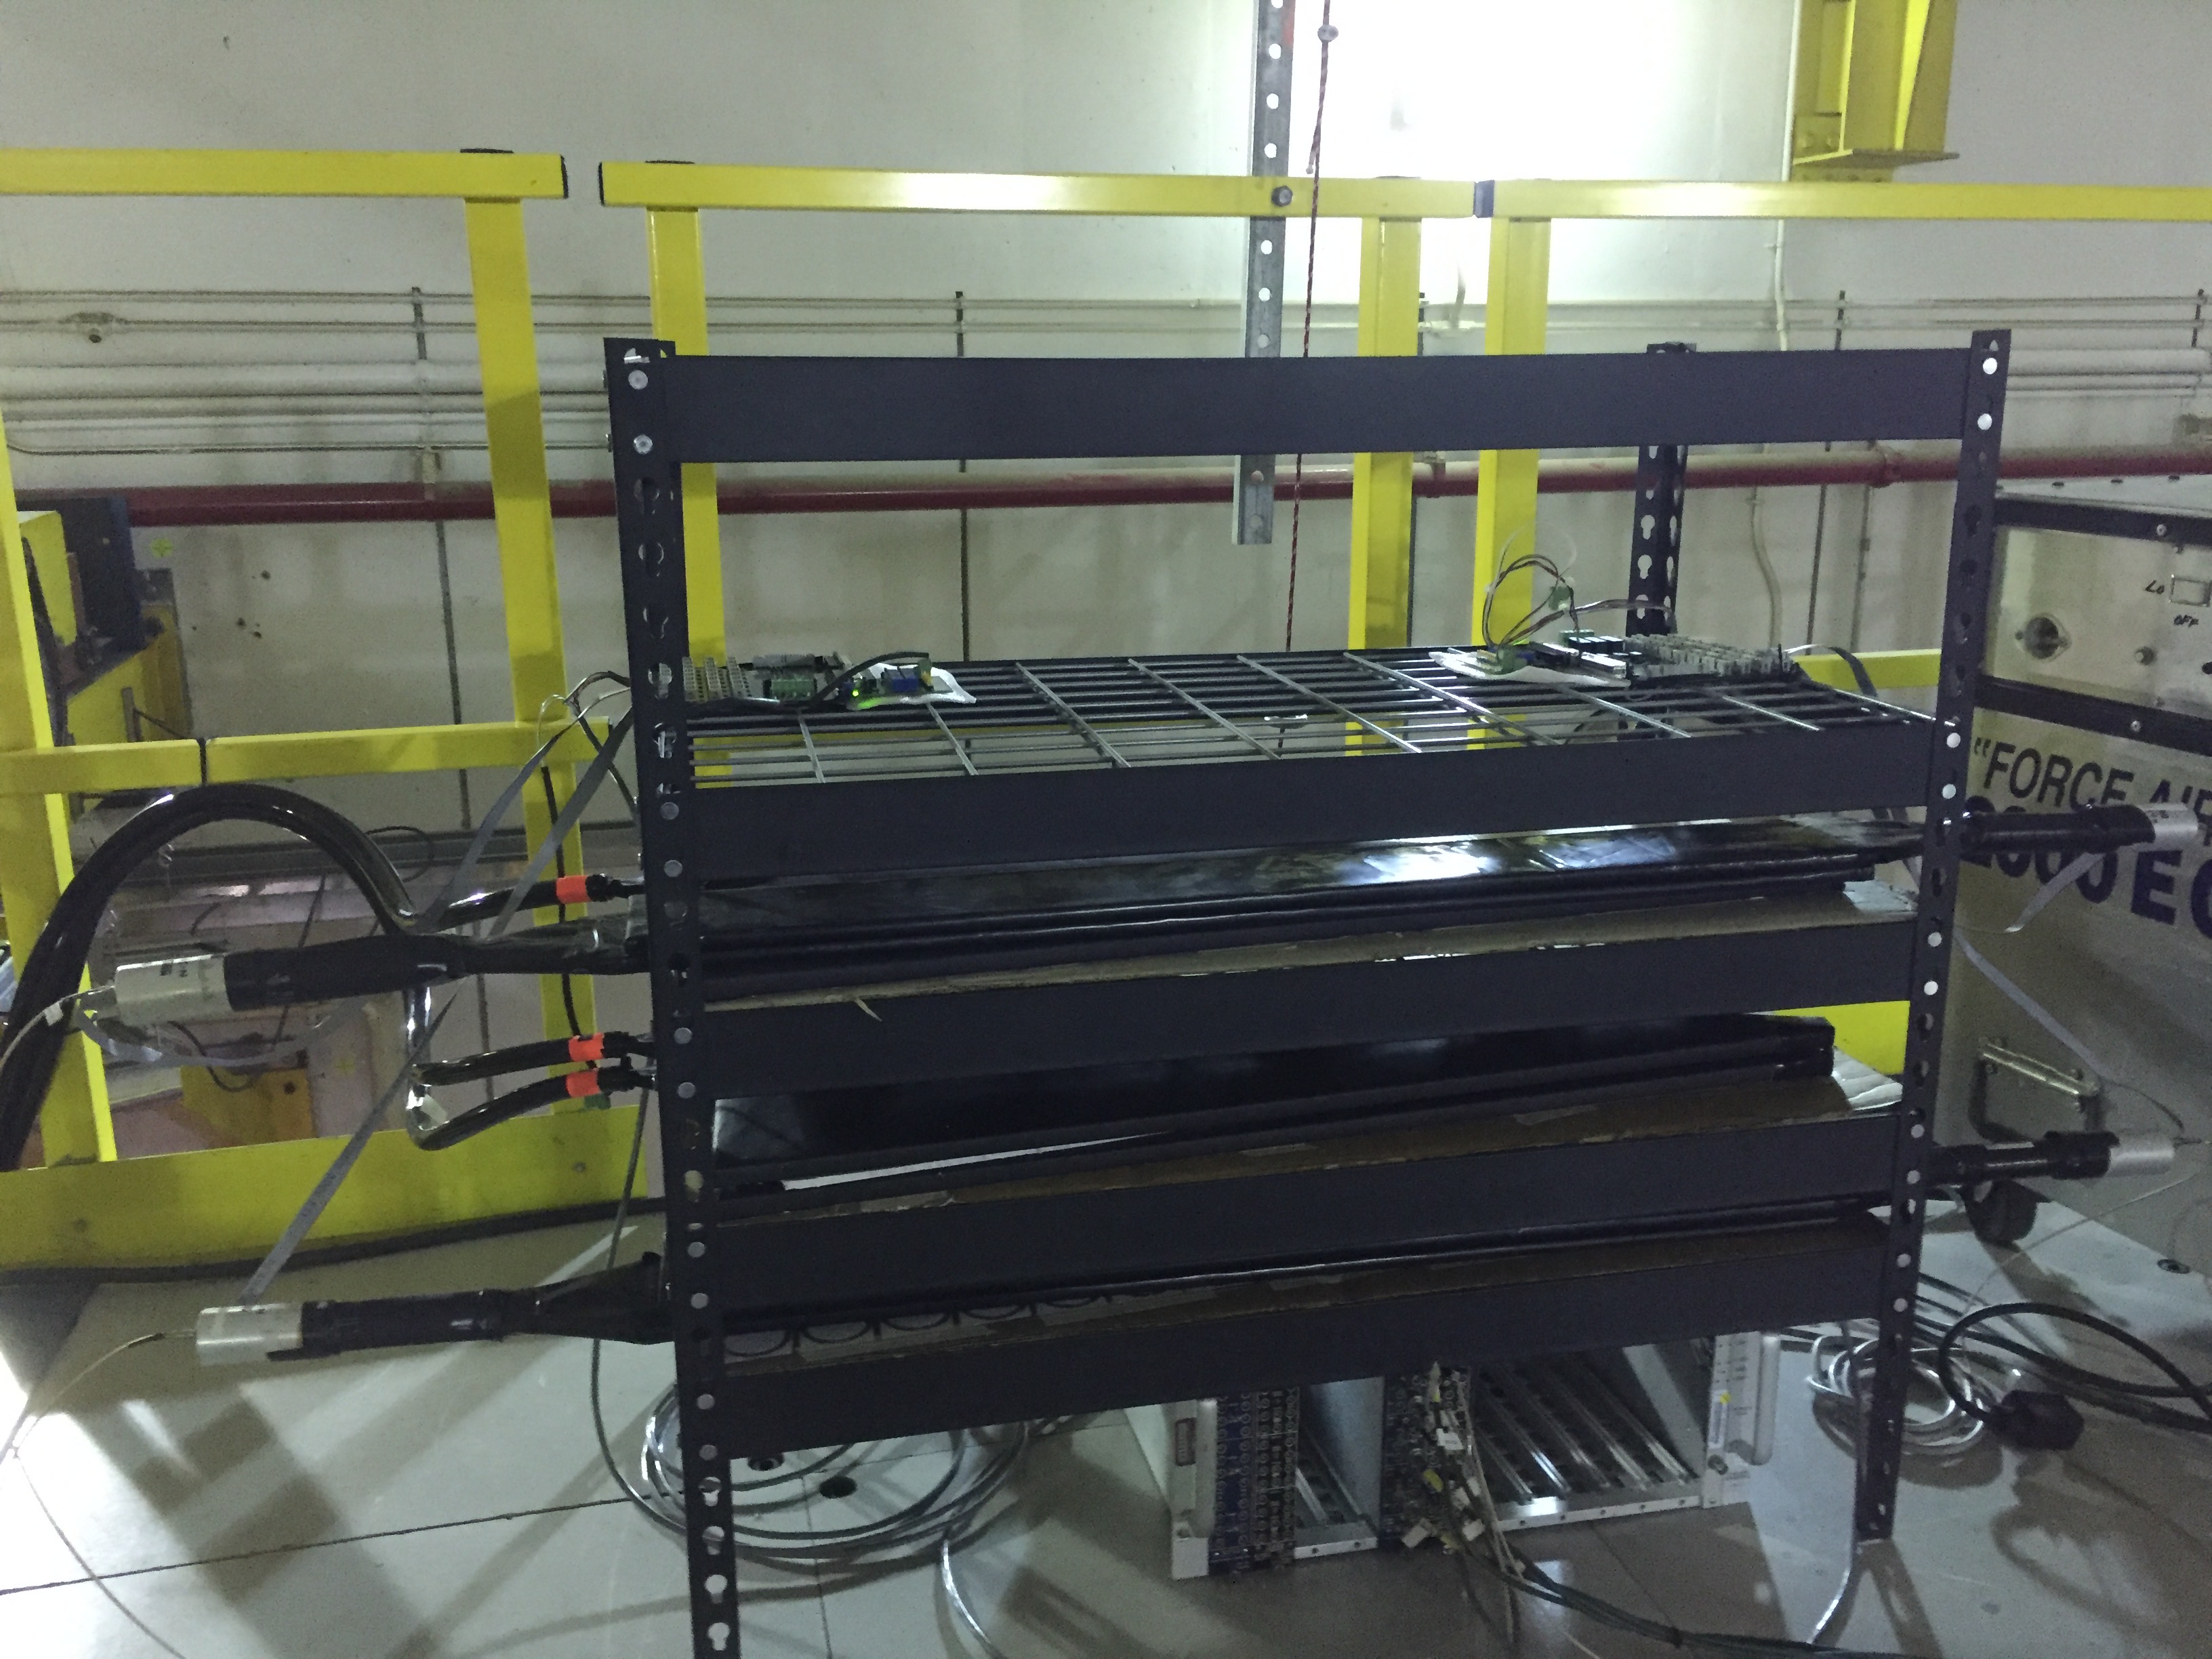
The set-up on the SE side of the upper platform of STAR. Three SS
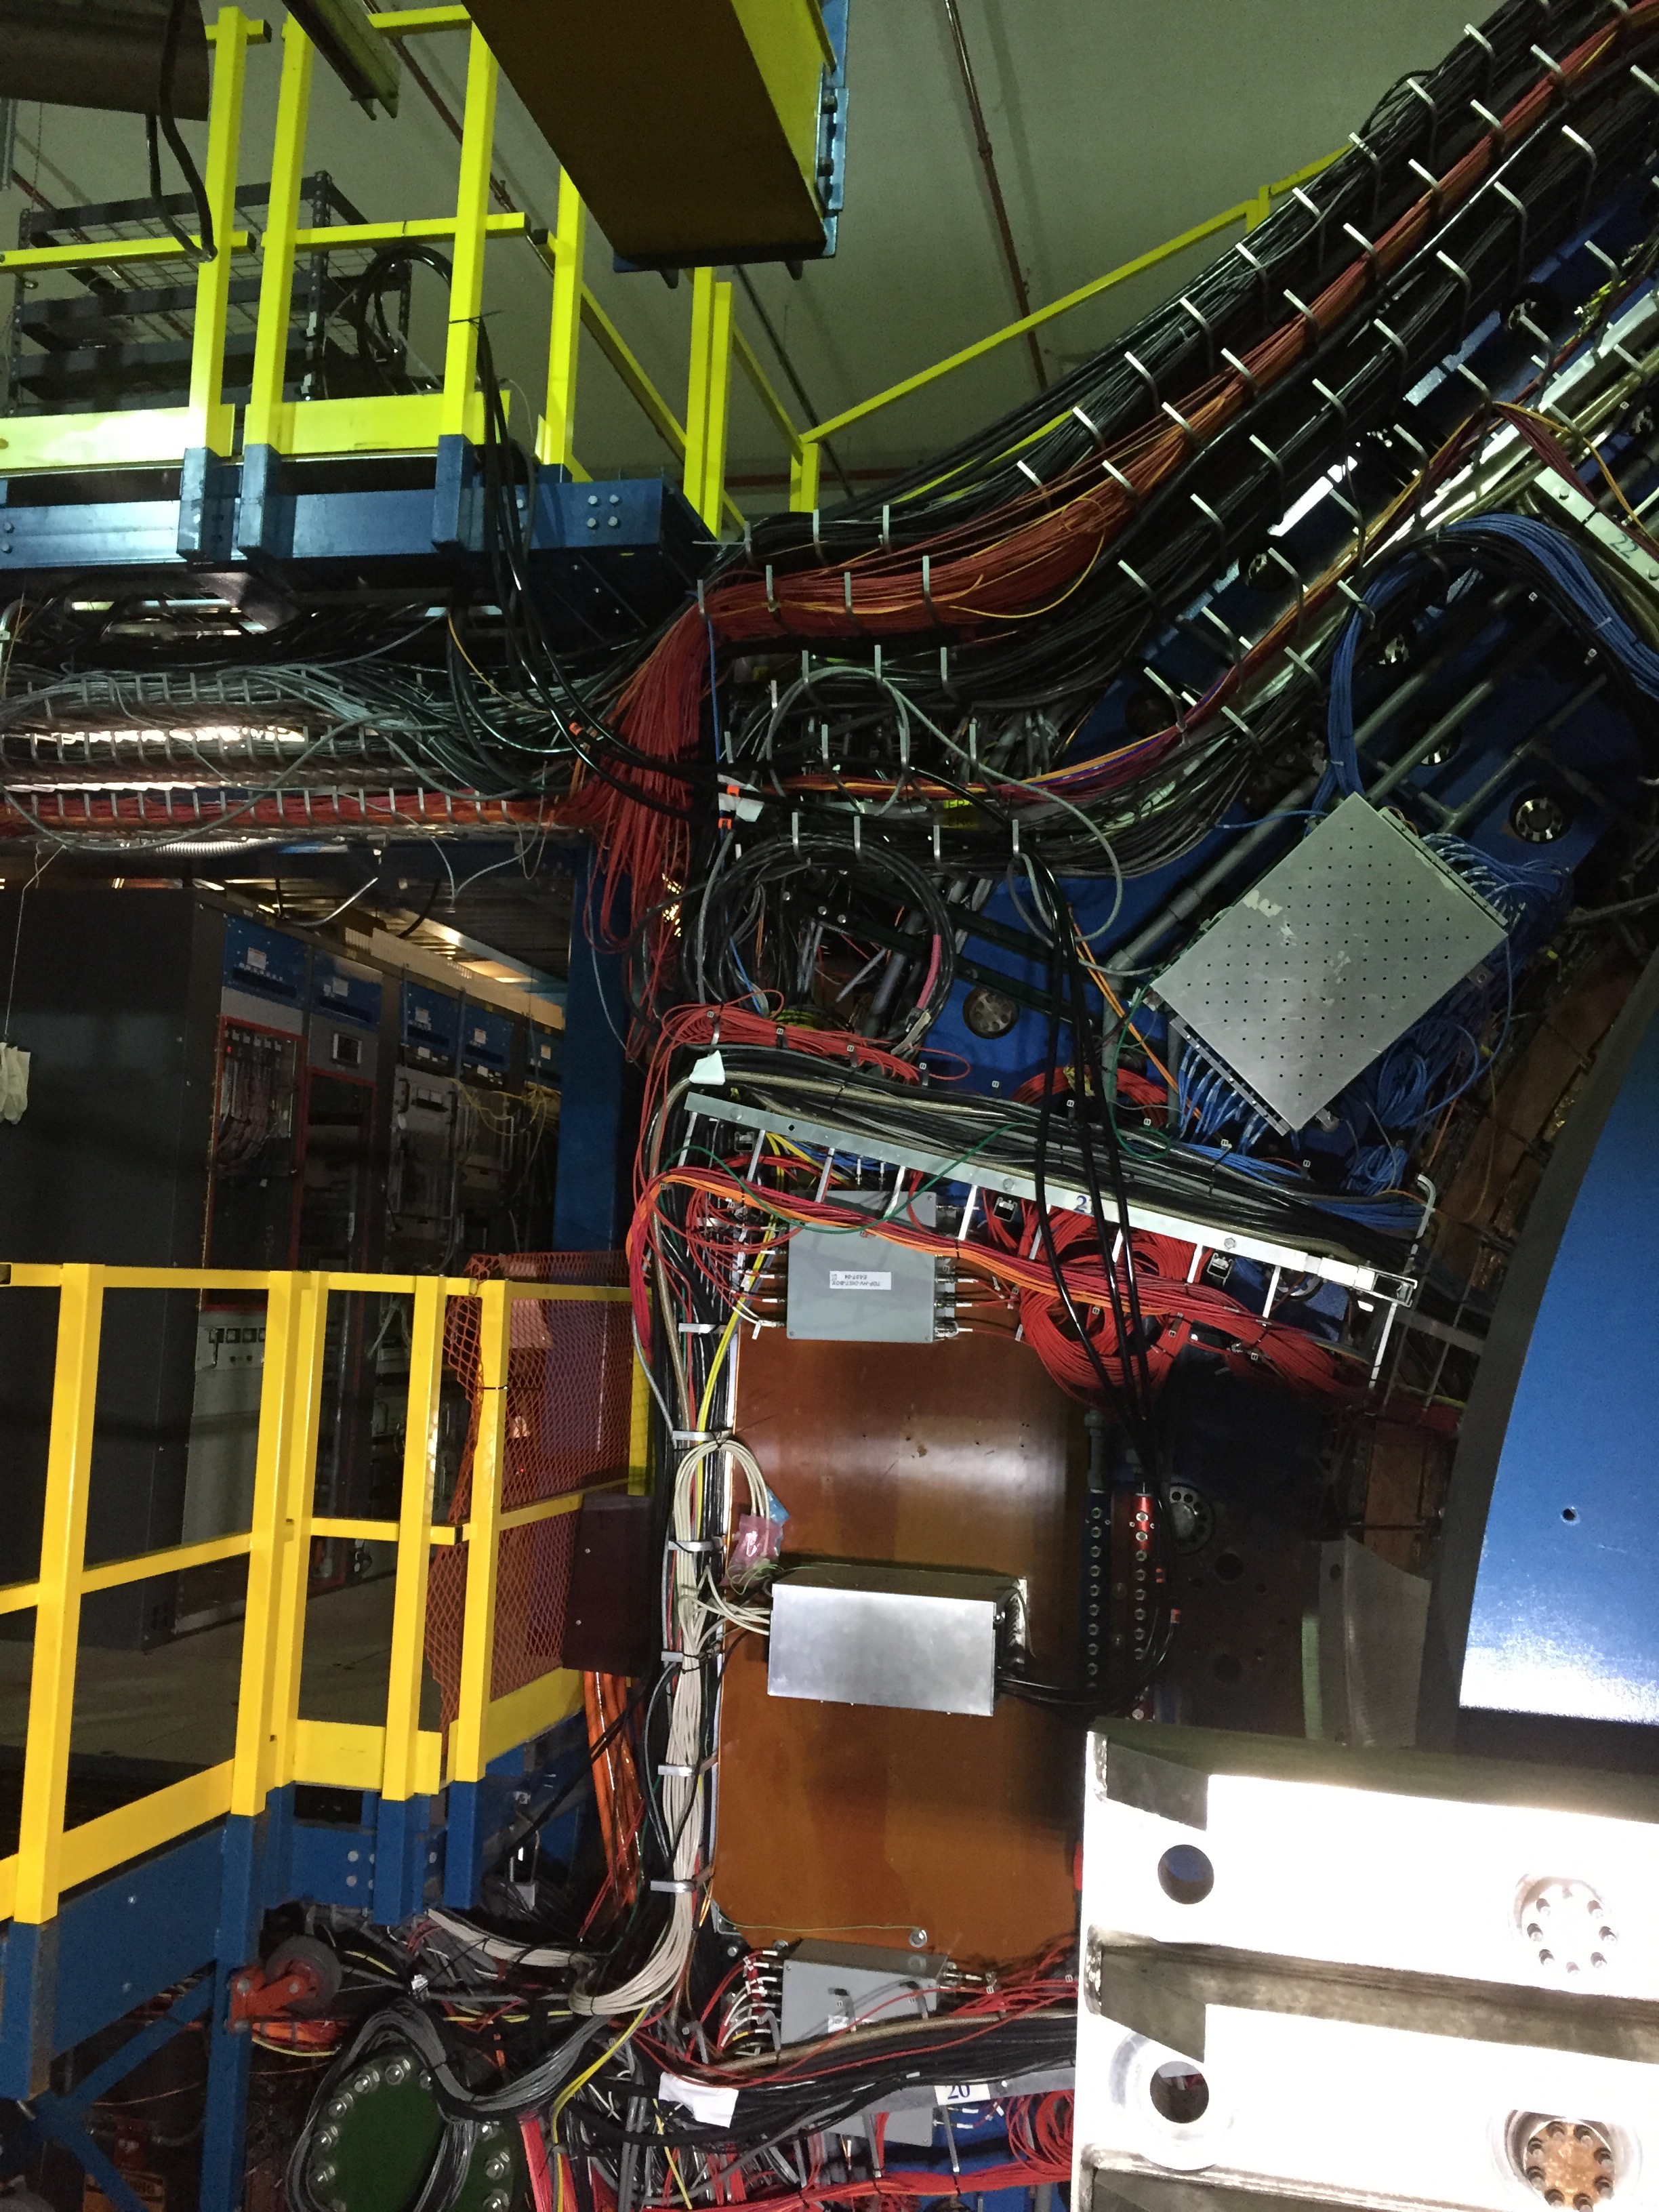
The SS
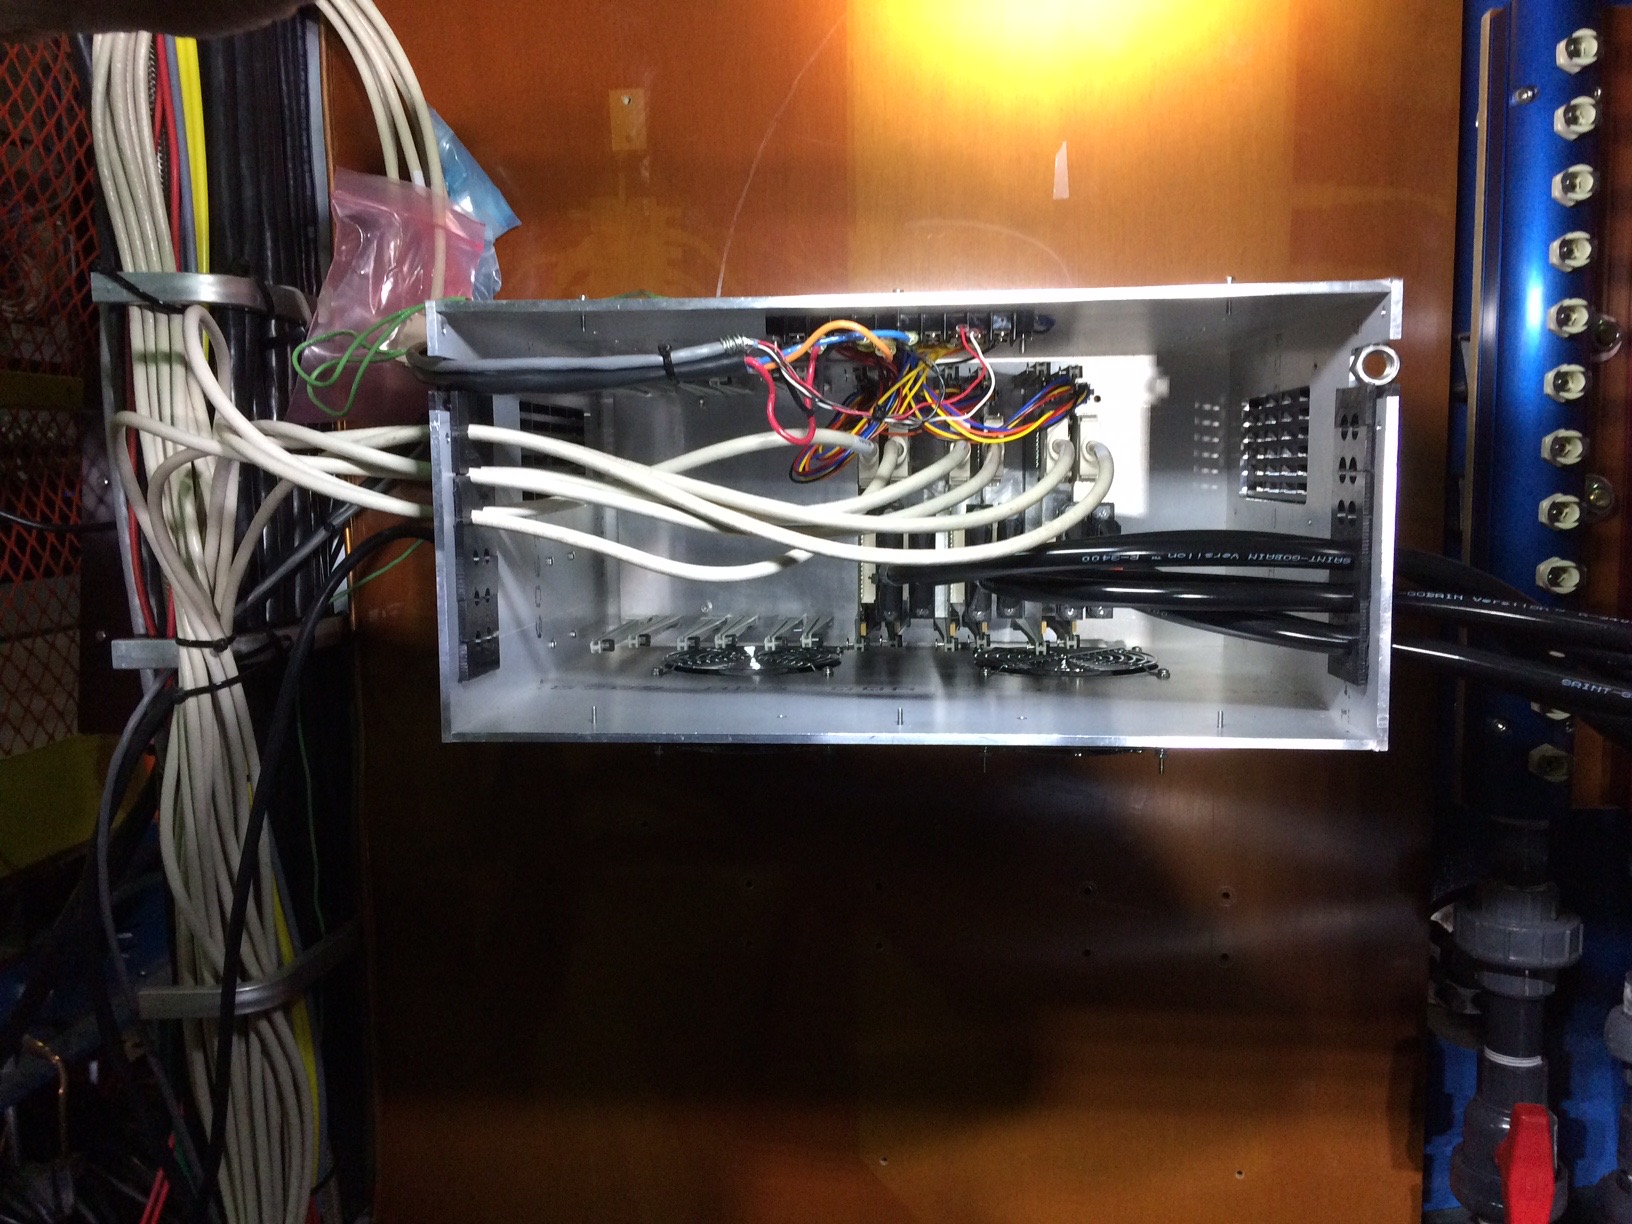
The populated FEE box with 6 FEEs. We managed to make it look relatively neat, but assembling a full box will require a couple of hours of very careful work. We have put advice in the log book for the future.
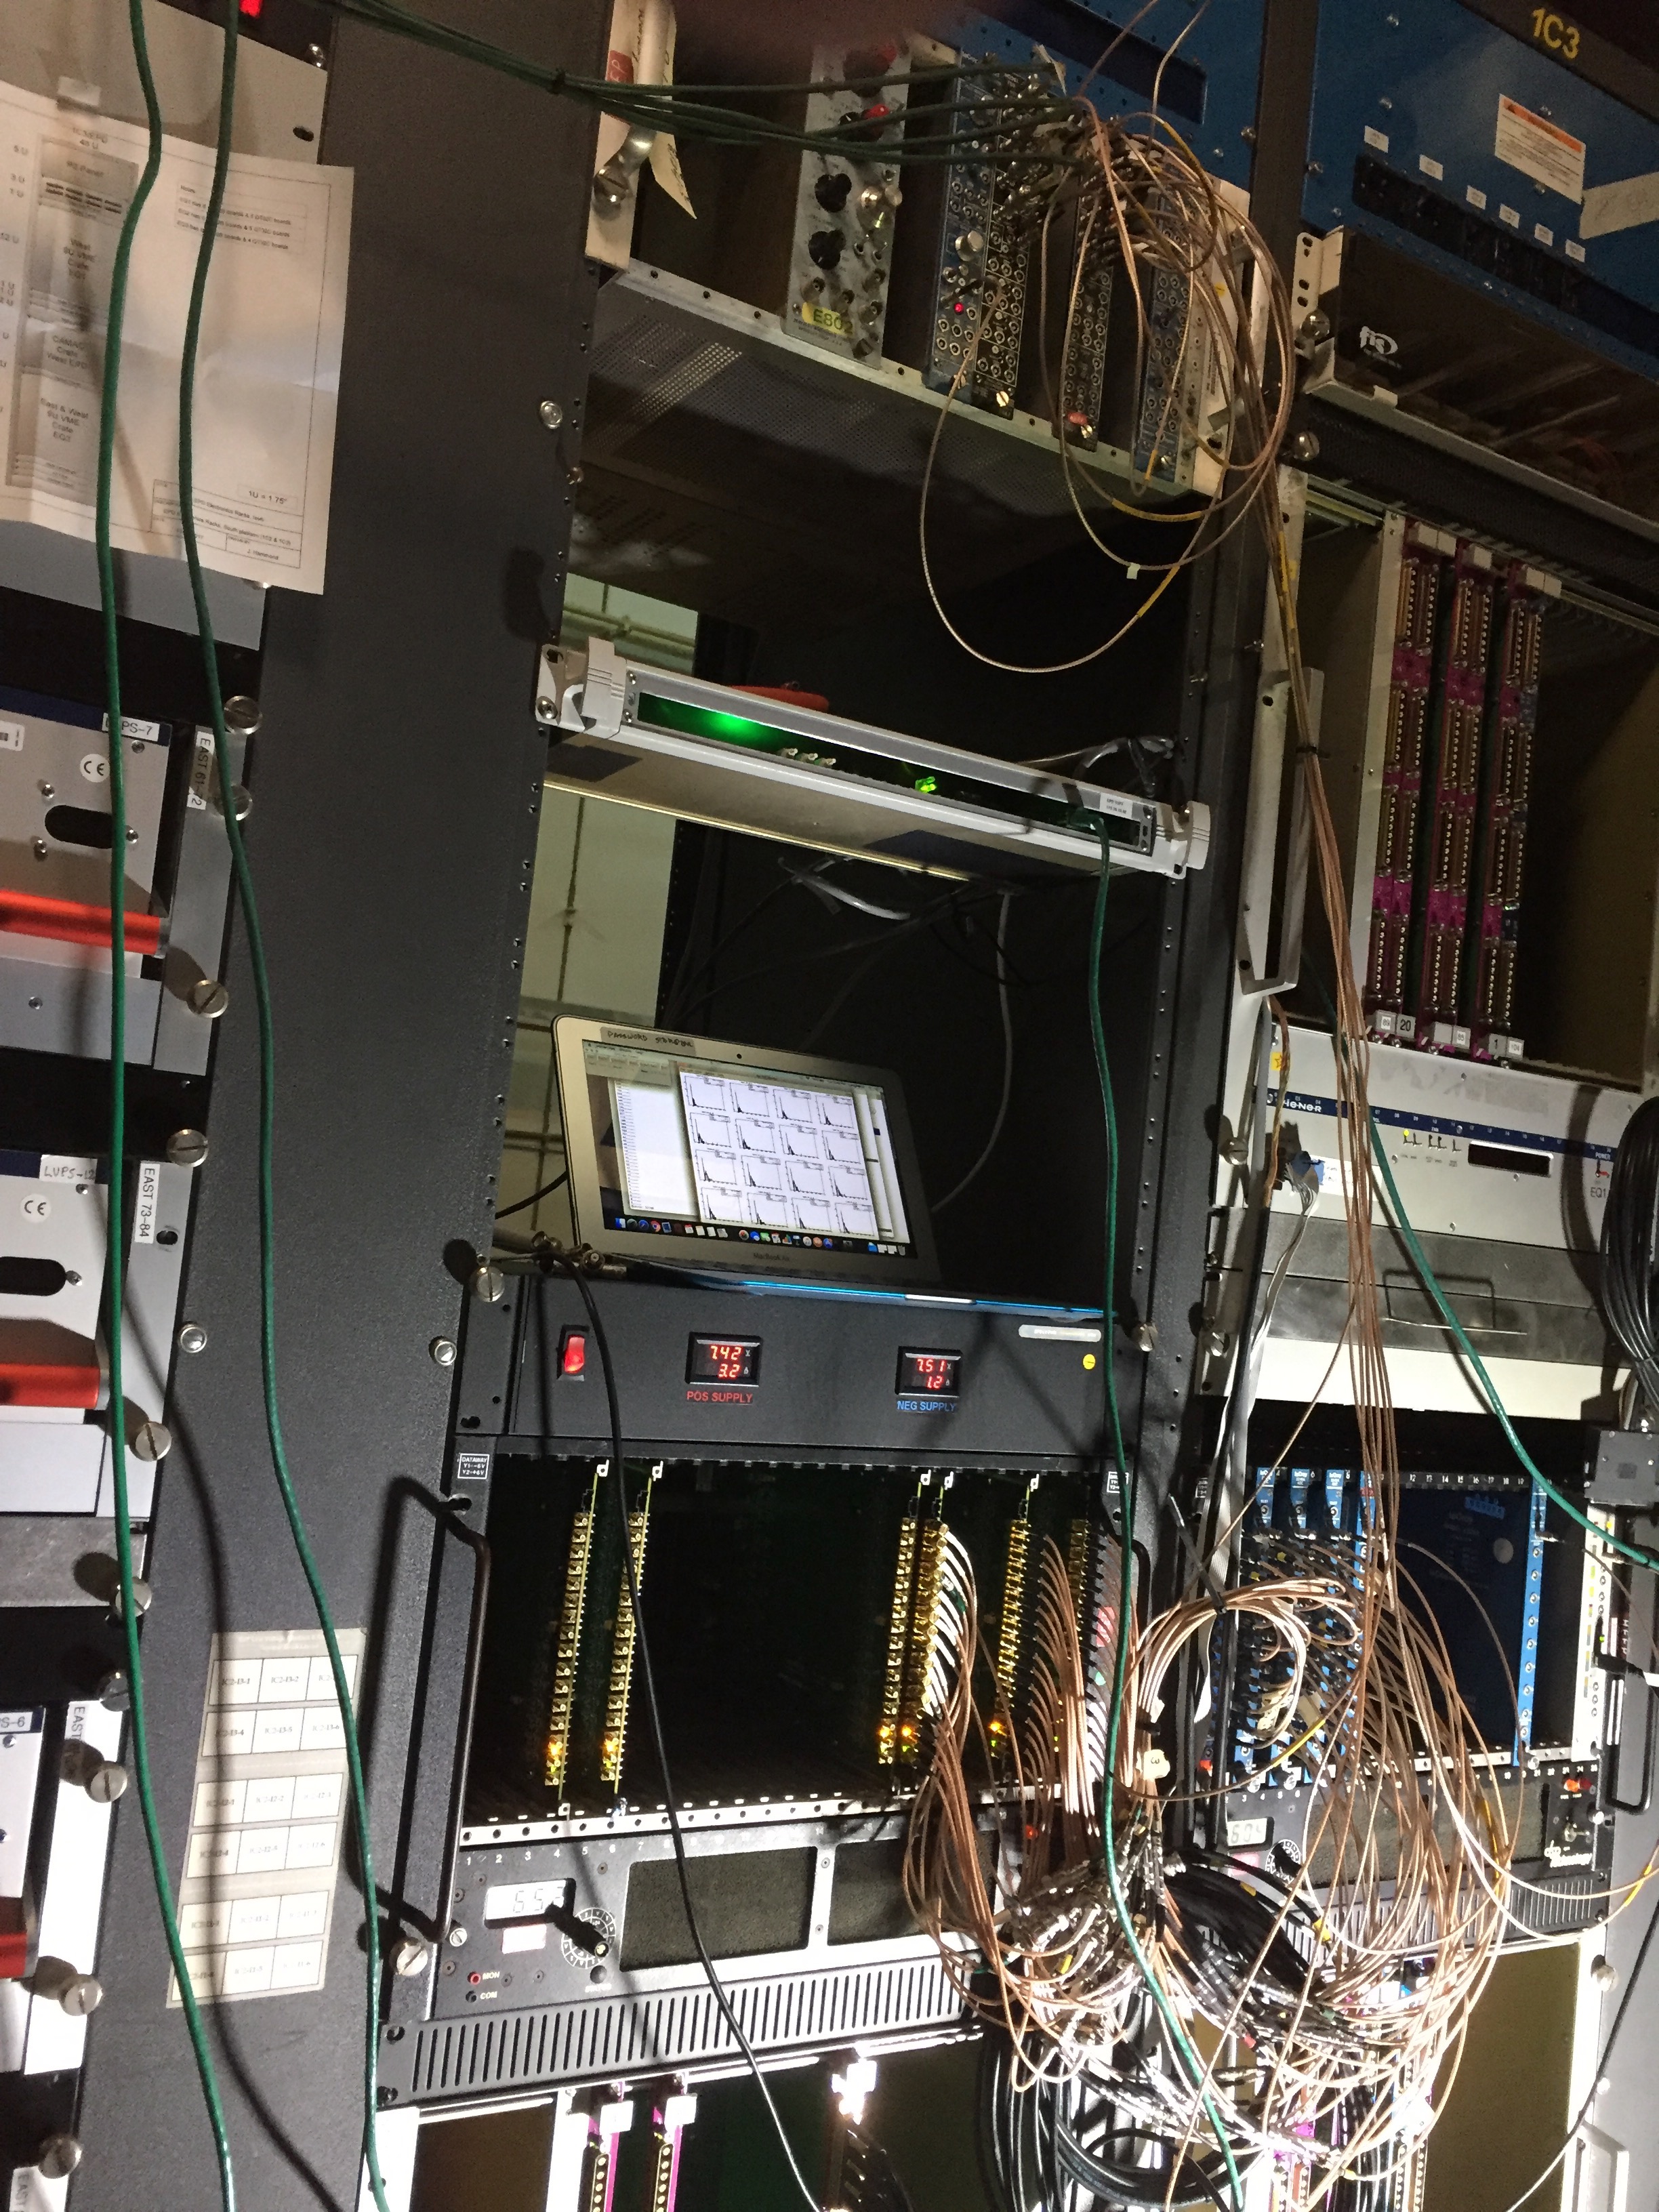
Not a great photo of our set-up in the 1C1 and 1C2 racks on the platform. Left rack (1C1) from top down: simple trigger electronics in
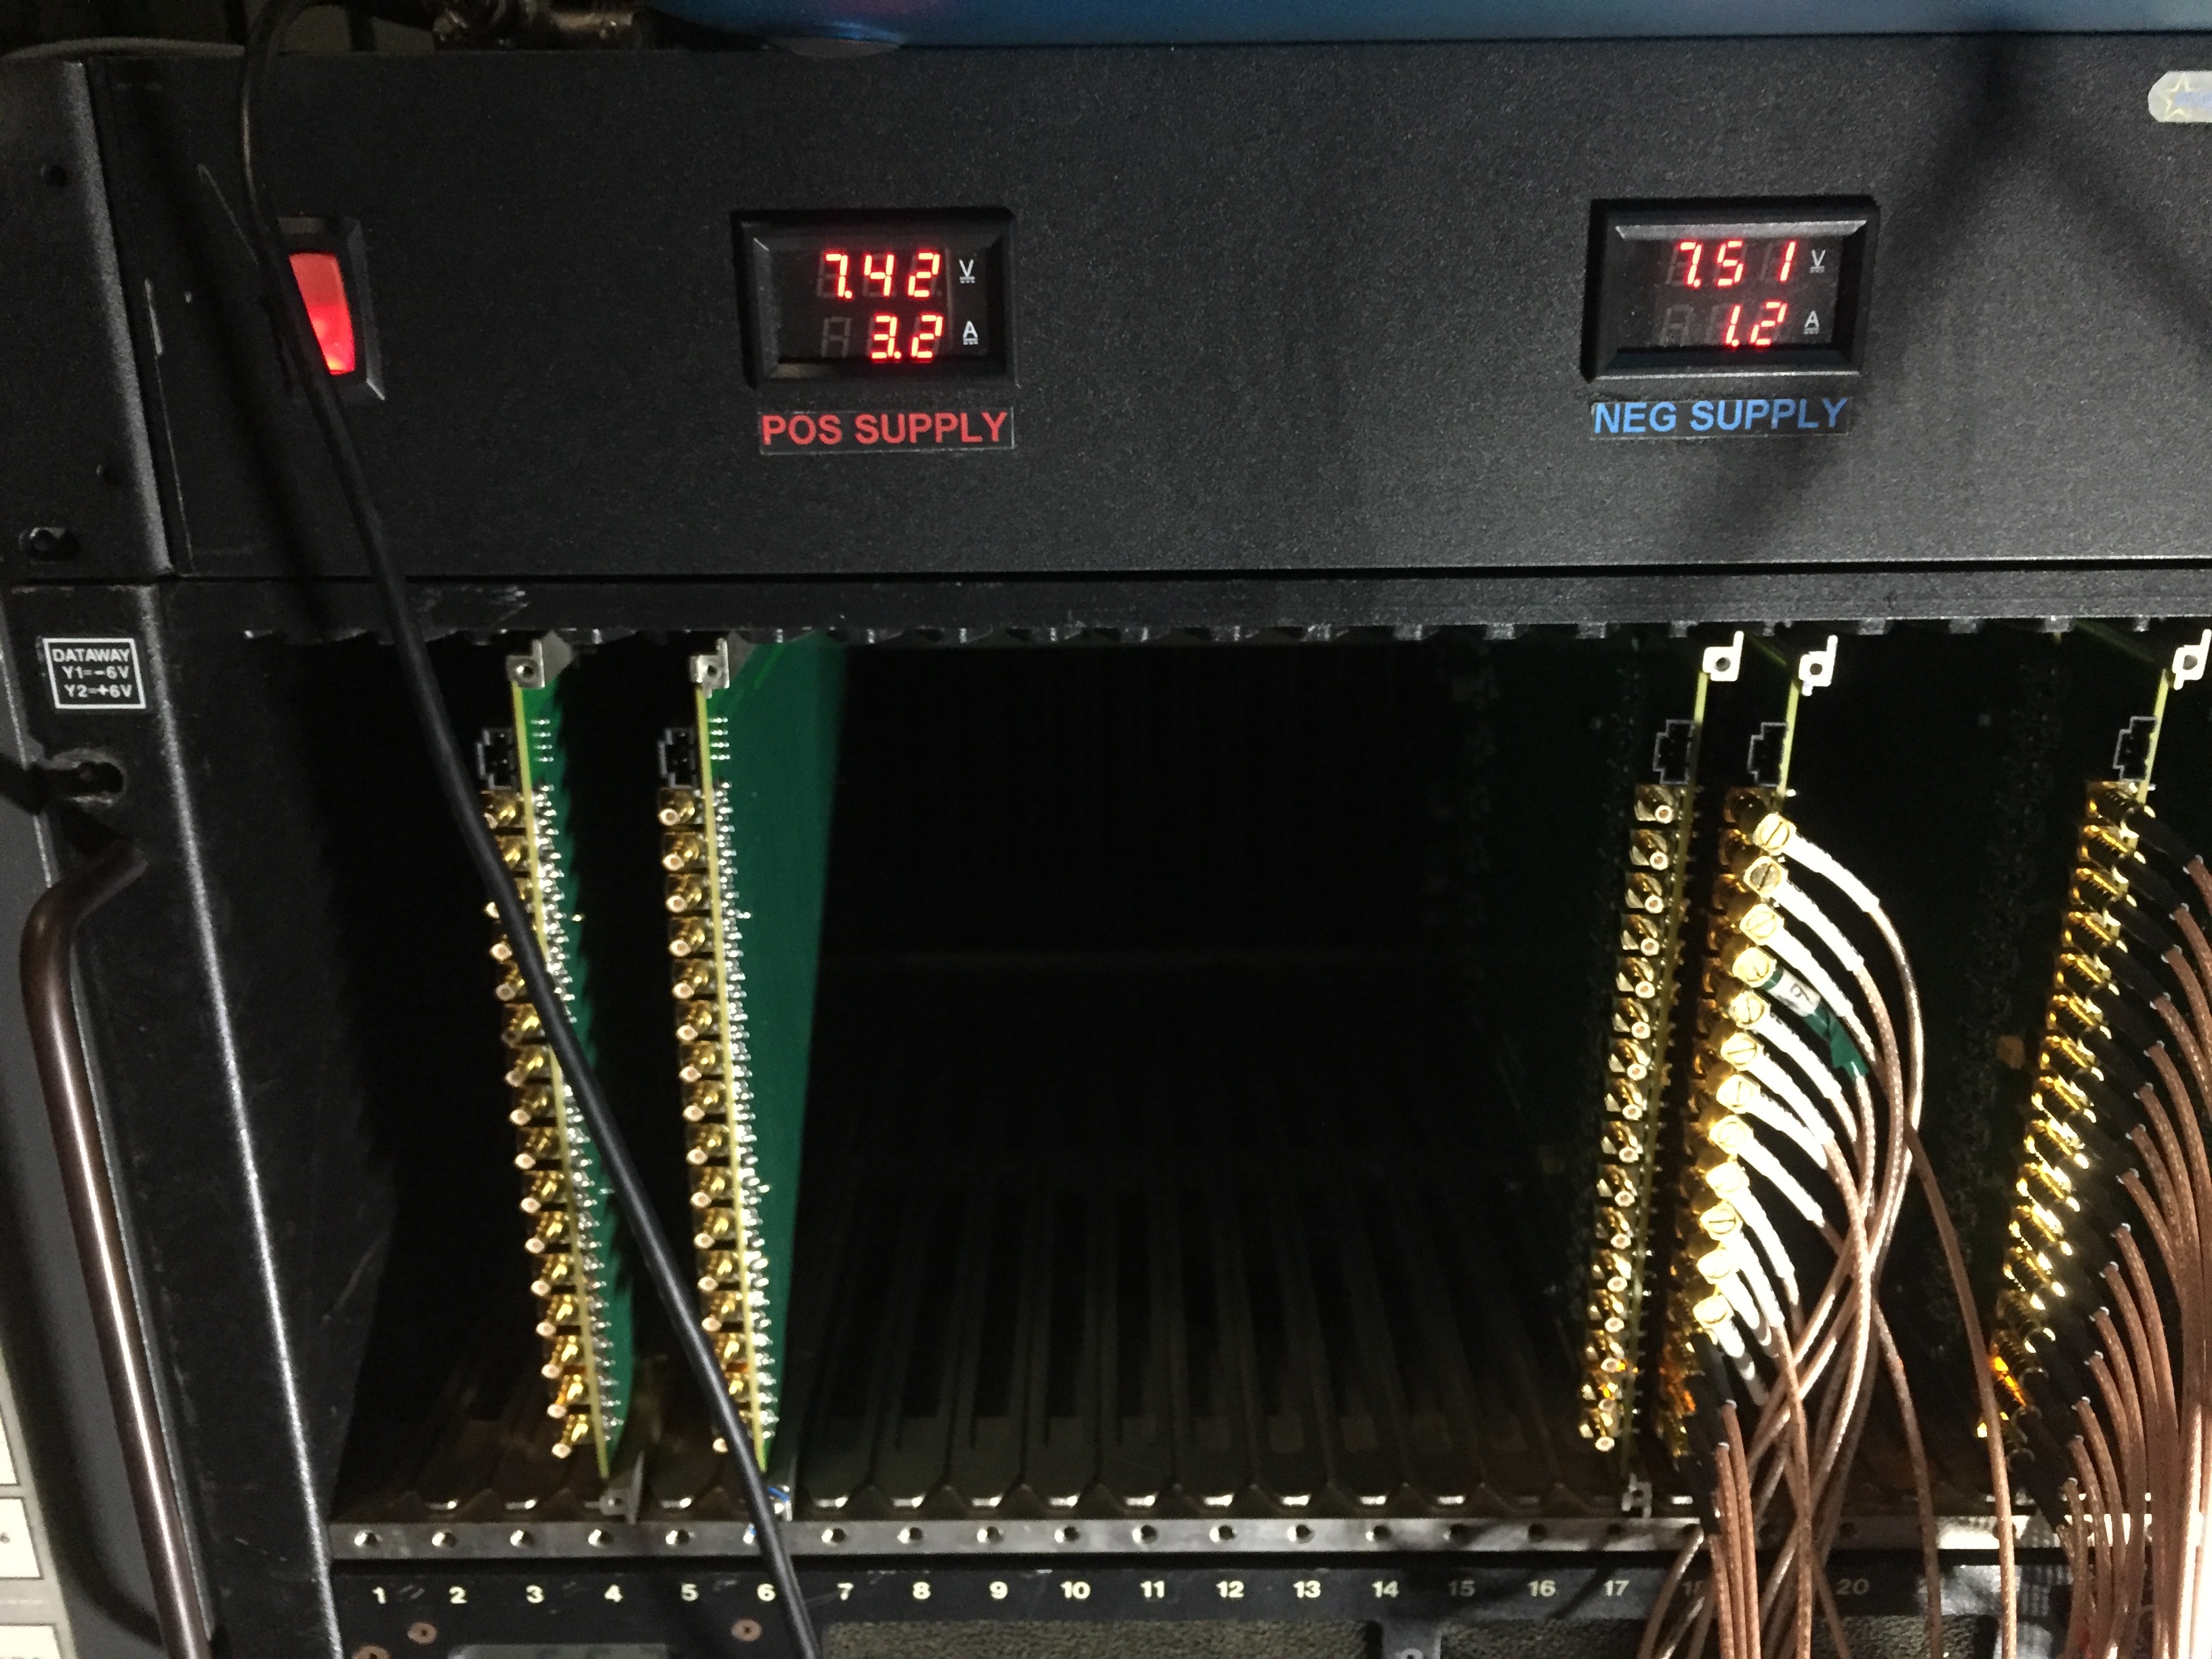
The new TUFF PS is much nicer on the back, and on the front panel, voltage and current for the positive and negative supplies are indicated.
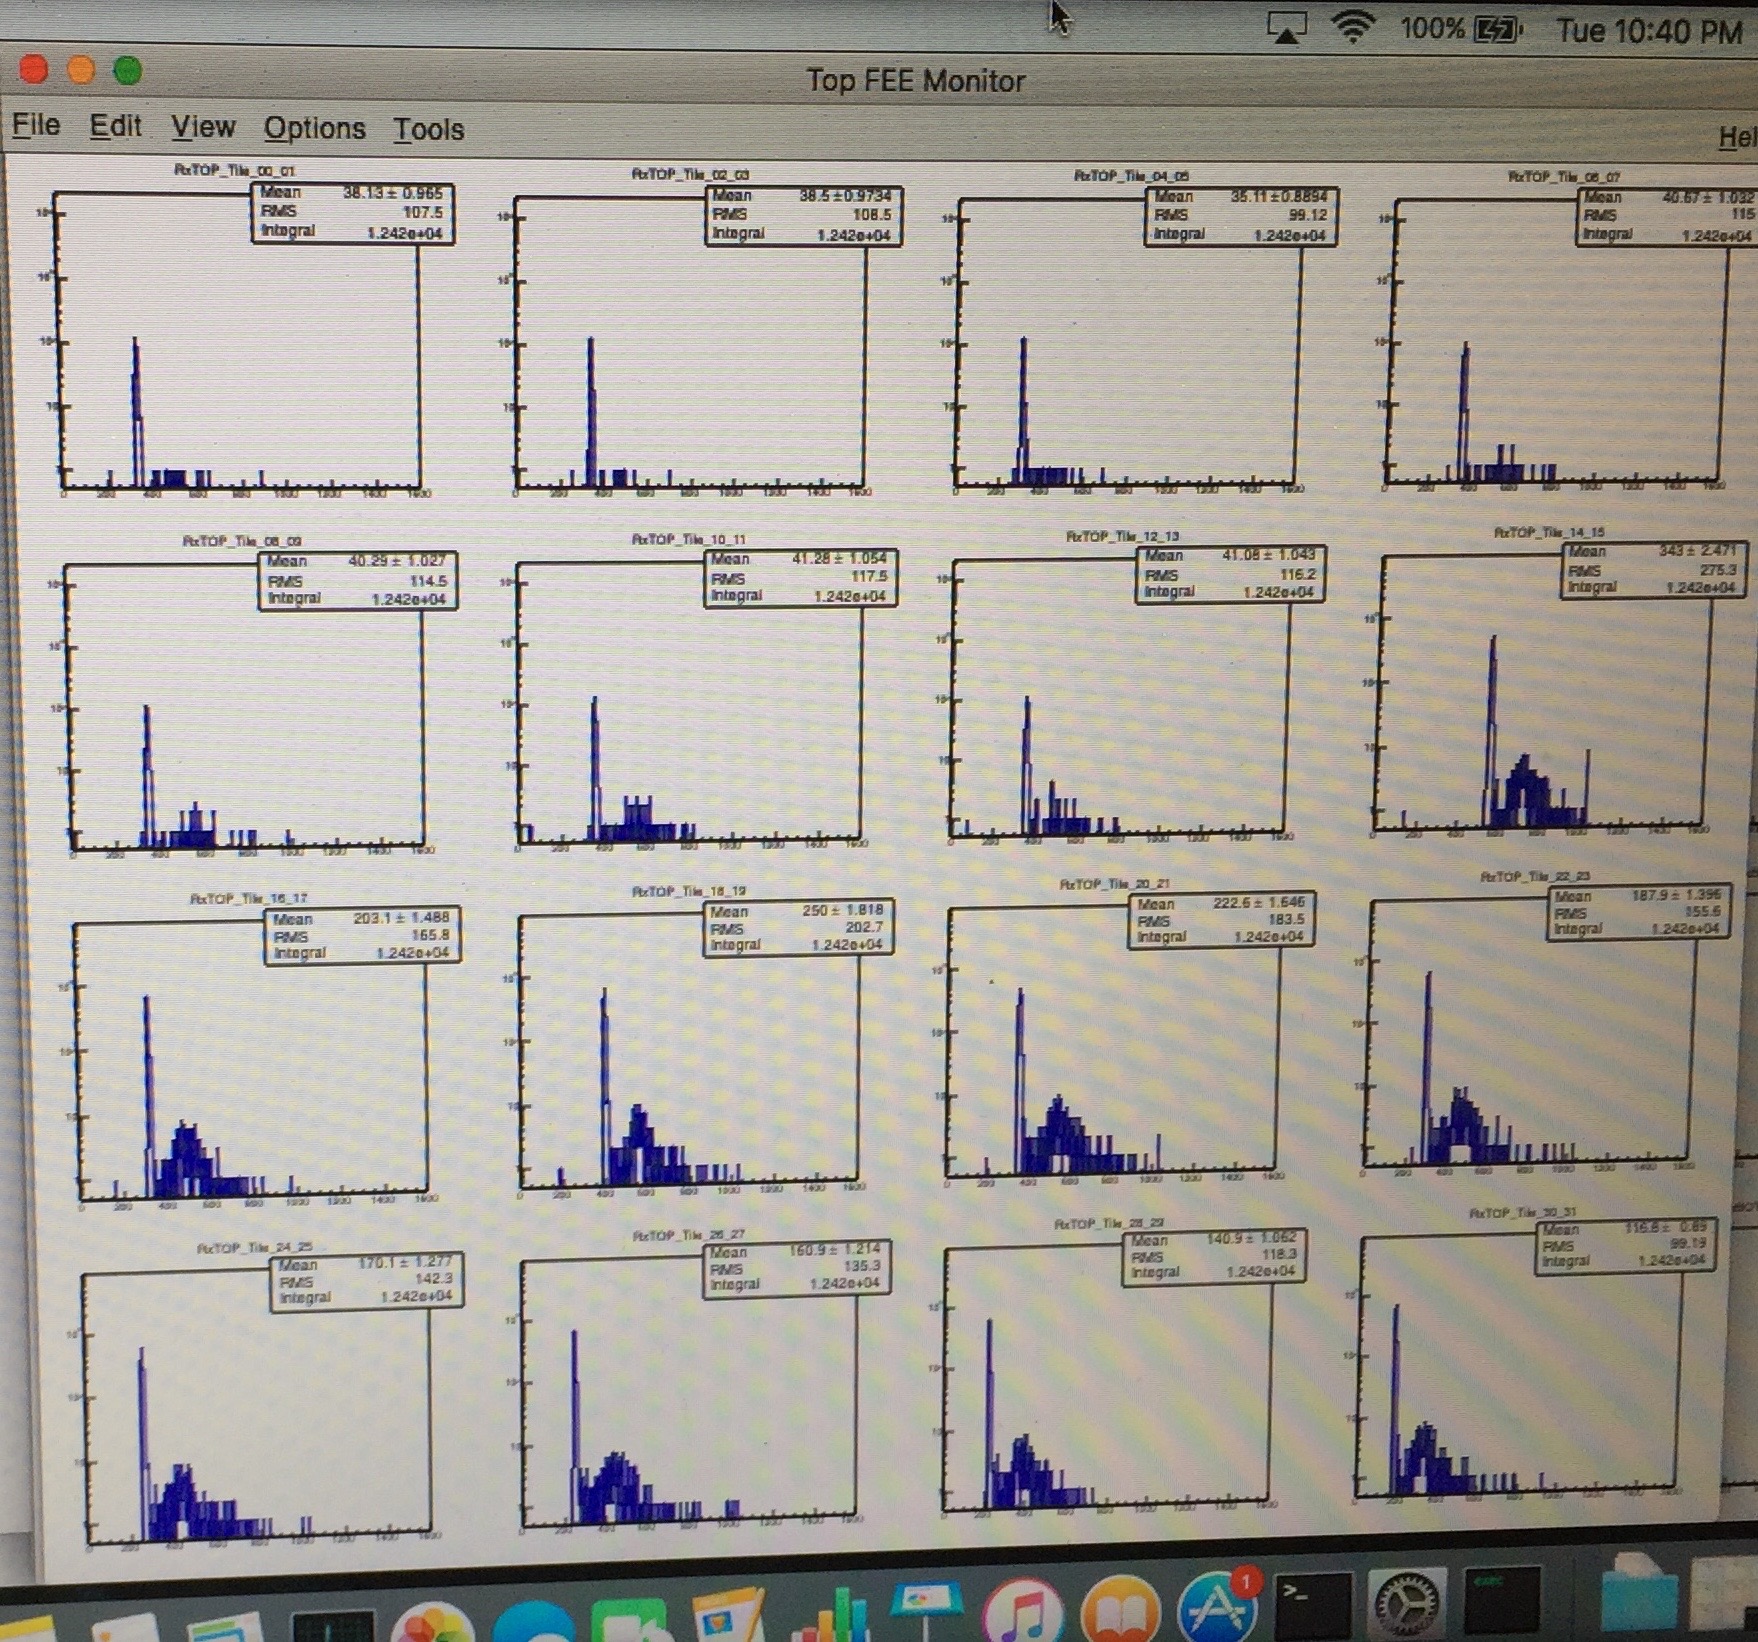
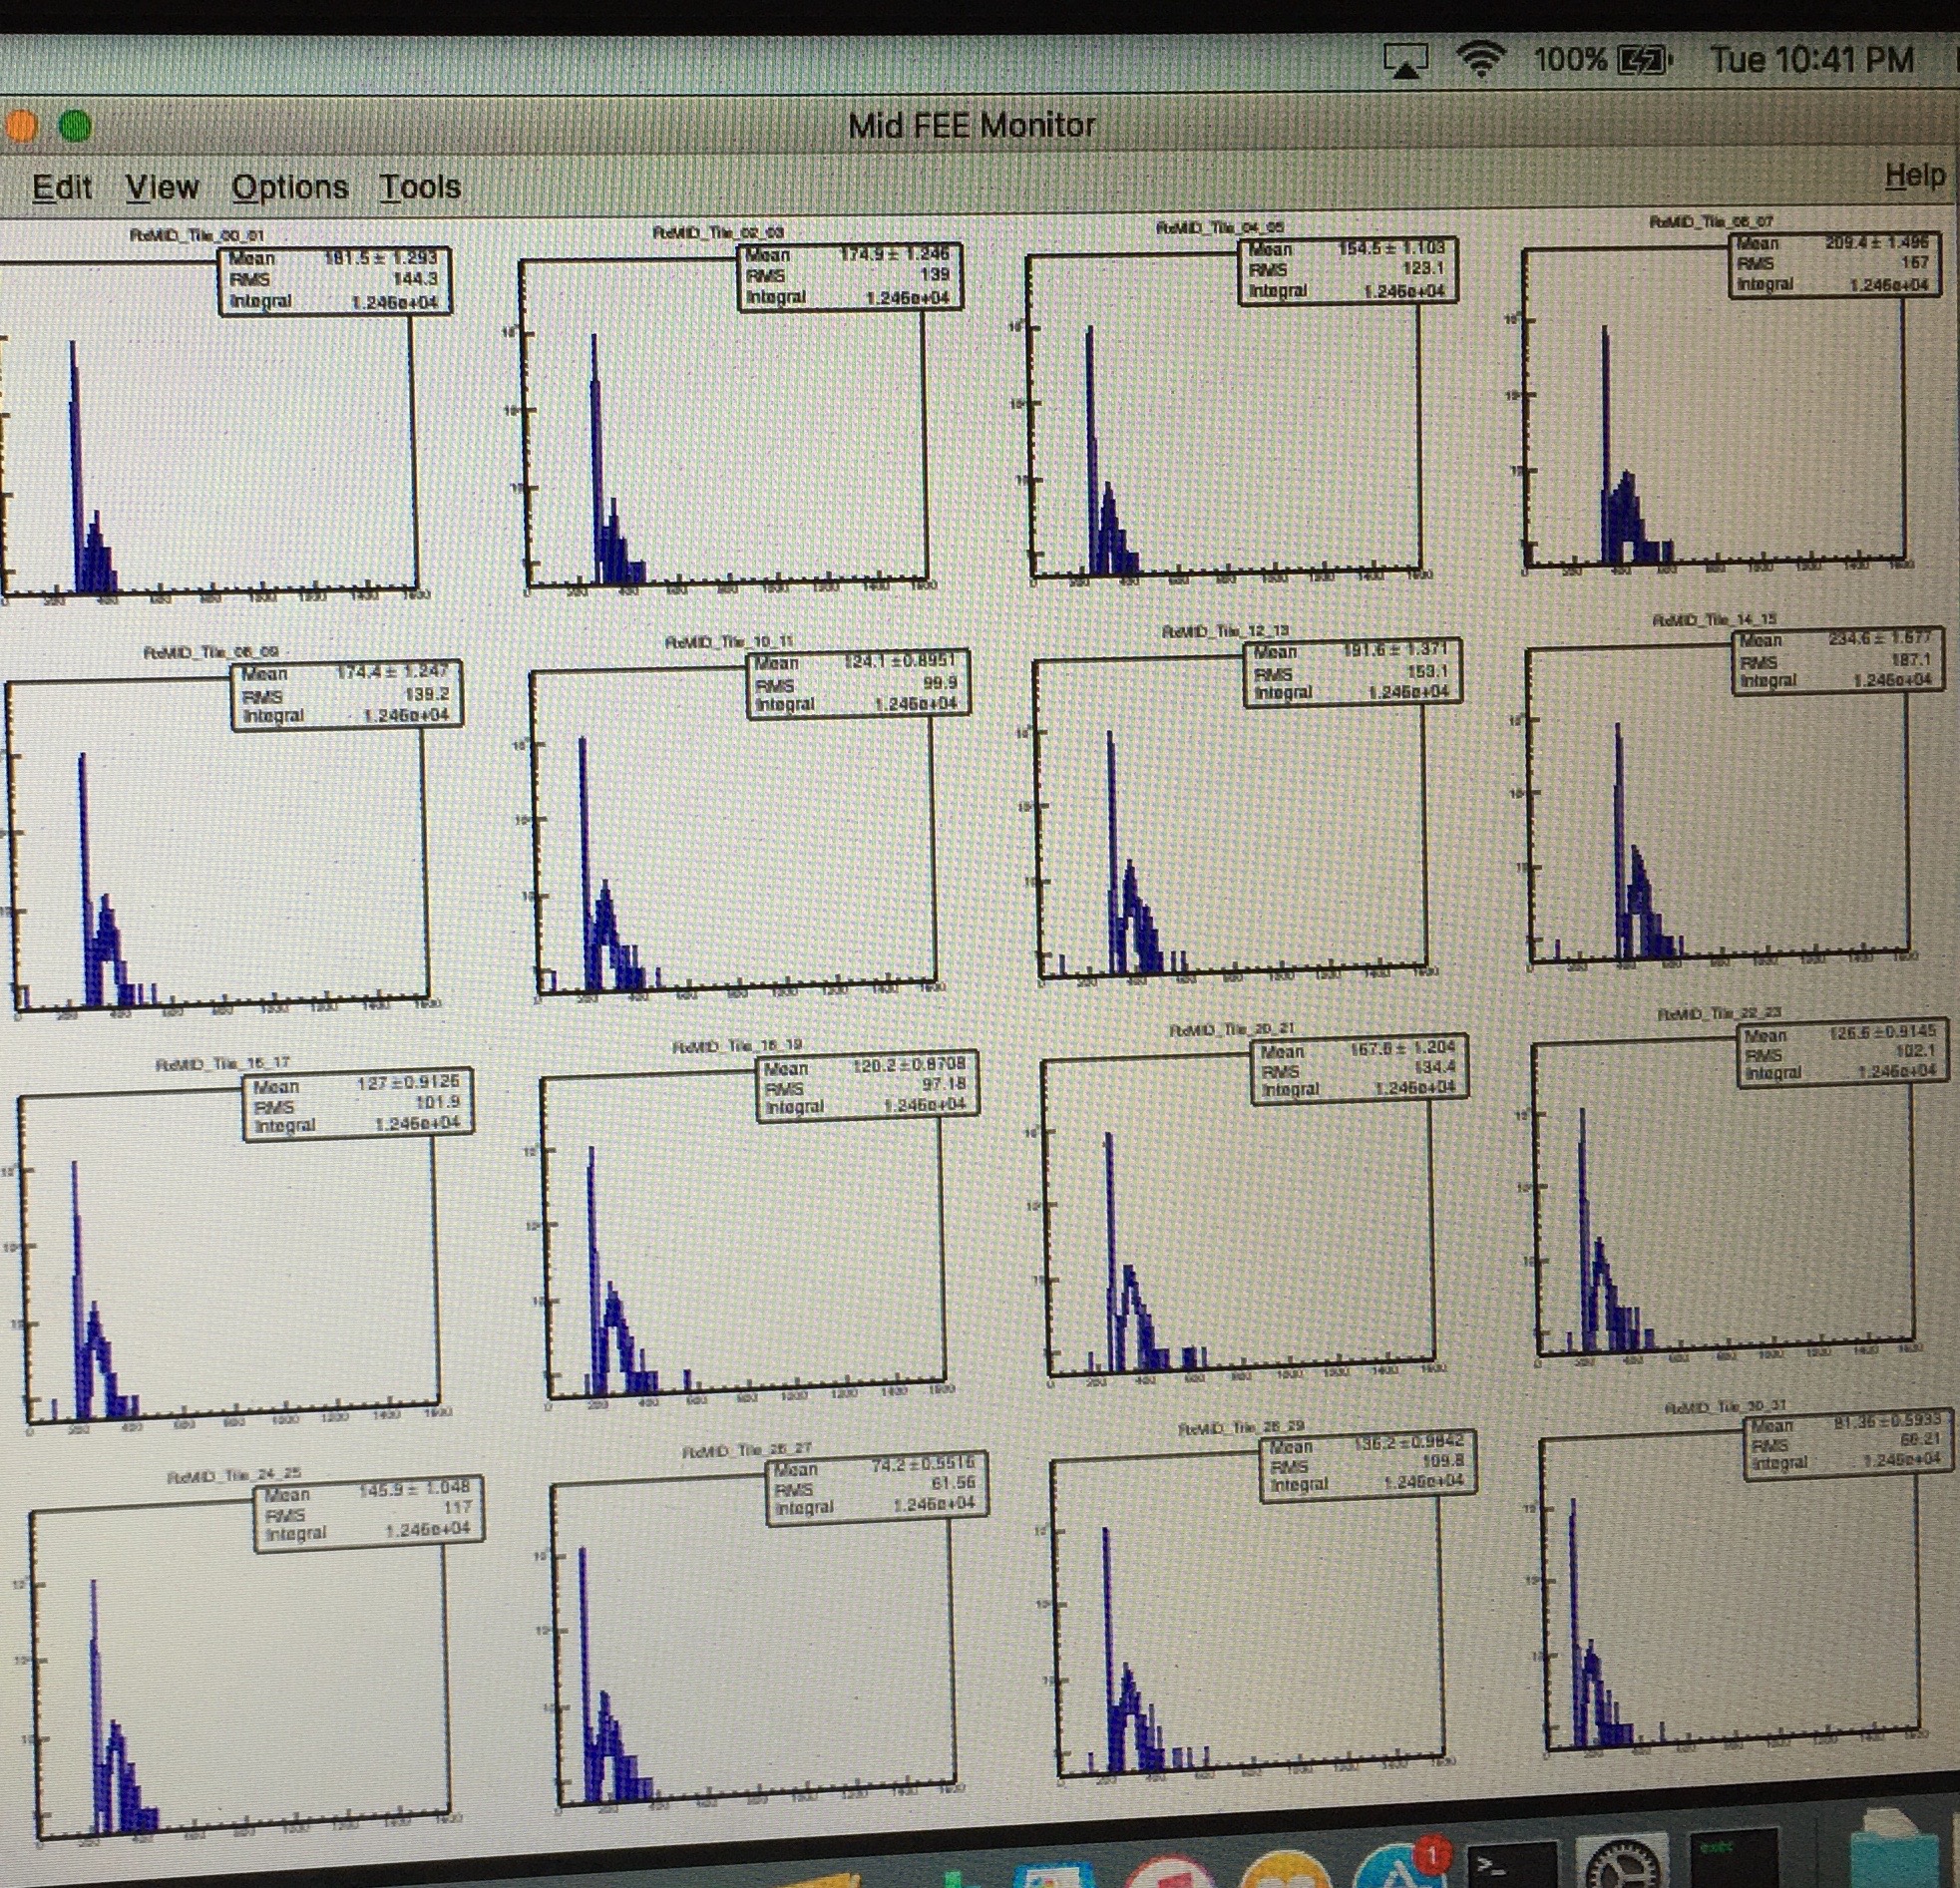
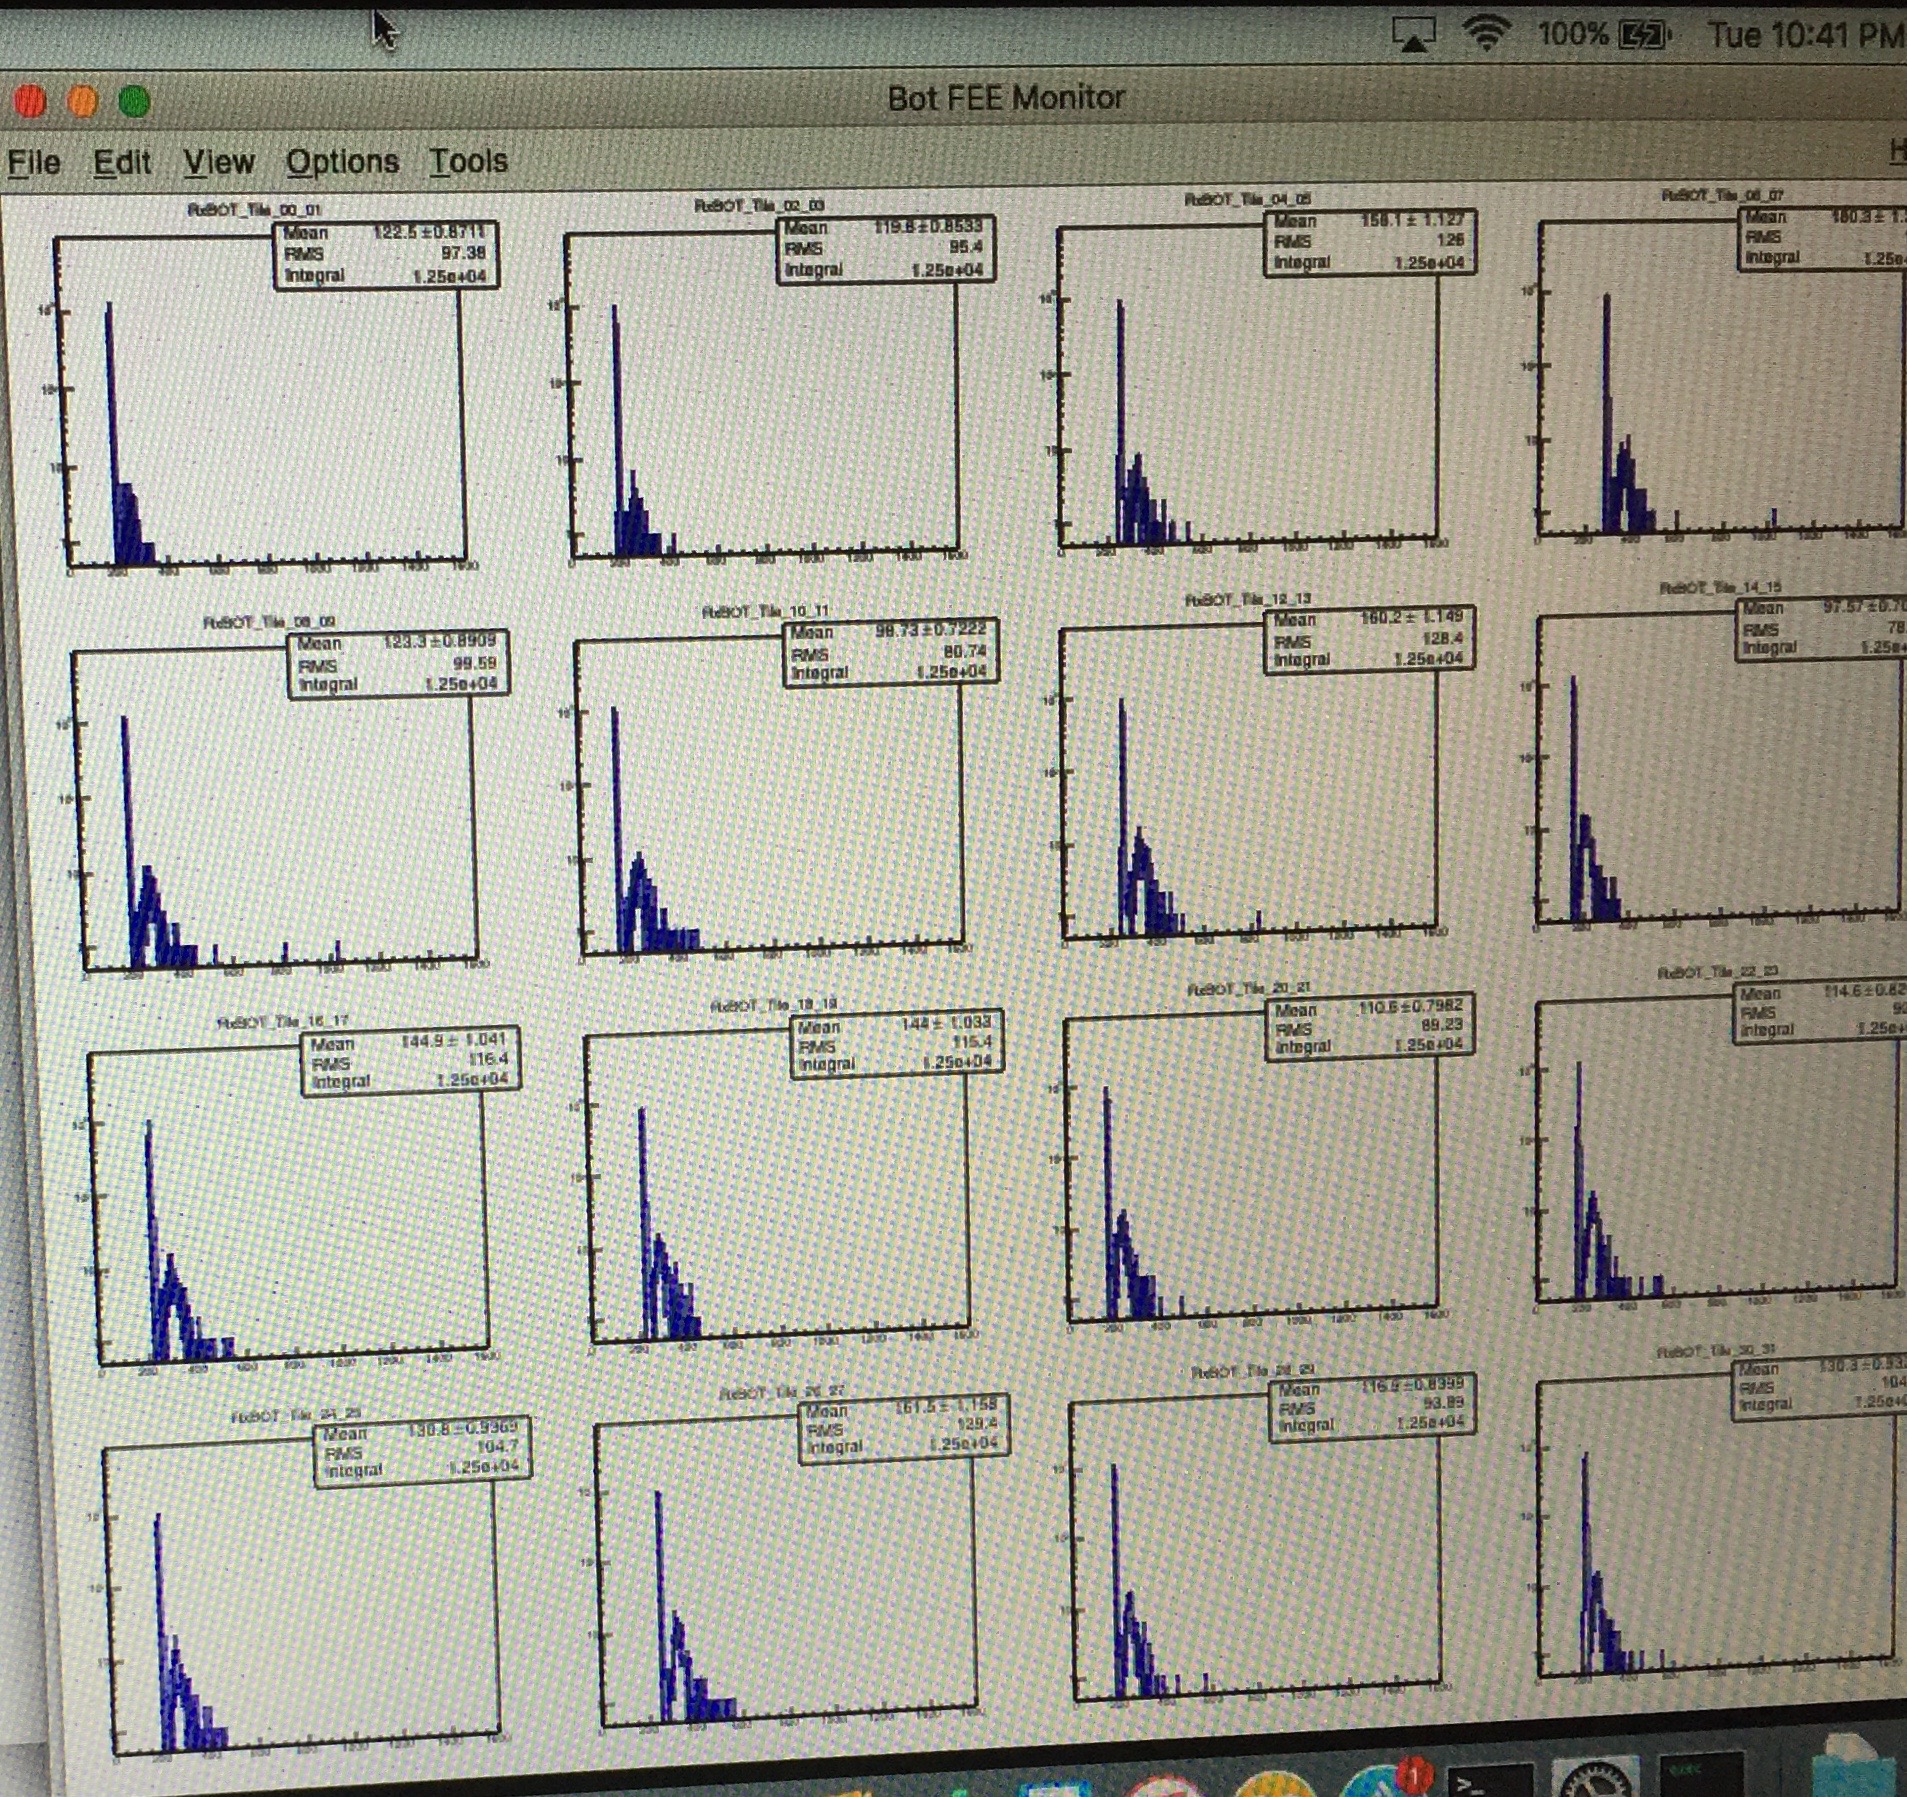
First MIP peaks from one hour of running. Top, middle and bottom Supersector signals are shown, for odd-numbered tiles. Small tiles in top SS don't show good peaks, probably due to trigger timing issues which we are looking into.
Update 2 Dec 2017
First production data using the trigger PMTs has been taken and is being analyzed by
Joey/Te-Chuan, please update with your stuff here.
First results of ADCs from vertical cosmic rays:
- Landau fits: https://drupal.star.bnl.gov/STAR/system/files/ADC_SS252723_odd.pdf
-
Update 5 Dec 2017
It was noted by Te-Chuan that the ADC distribution for TOP Tile 15 goes all the way to 1024 (hence saturates at the high end). The pedestal was close to 500 counts, which is quite high. (One sees this also in the photos of the spectra above.) It turns out that our high pedestals are due to the overly wide gate I had set. As seen in the photo below, we see that we sit very nicely in the gate, but the gate itself is about 275 ns (compare to ~80 ns that we use in STAR). The pedestal one expects is
pedestal = (baseline voltage) * (gate width) / [(input impedance) *(ADC conversion factor)
= (baseline voltage) * (275 ns) / [(50 ohm)*(0.25 pC/count)
= (baseline voltage) * (22 count/mV)
This should be added to the "typical residual pedestal" of the 2249A (see here) quoted as
1 + [(0.03 pC)/(0.25 pC/ct)*(t in ns) = 34 counts for our gate
The baseline voltages coming out of the Rx cards are of order 10 mV, so we expect pedestals of about 250 counts. I know these "typical residual pedestals" can vary significantly, so 350 counts is not crazy. 500 counts is still a bit high, but I am not shocked, since baseline voltage will vary, too.
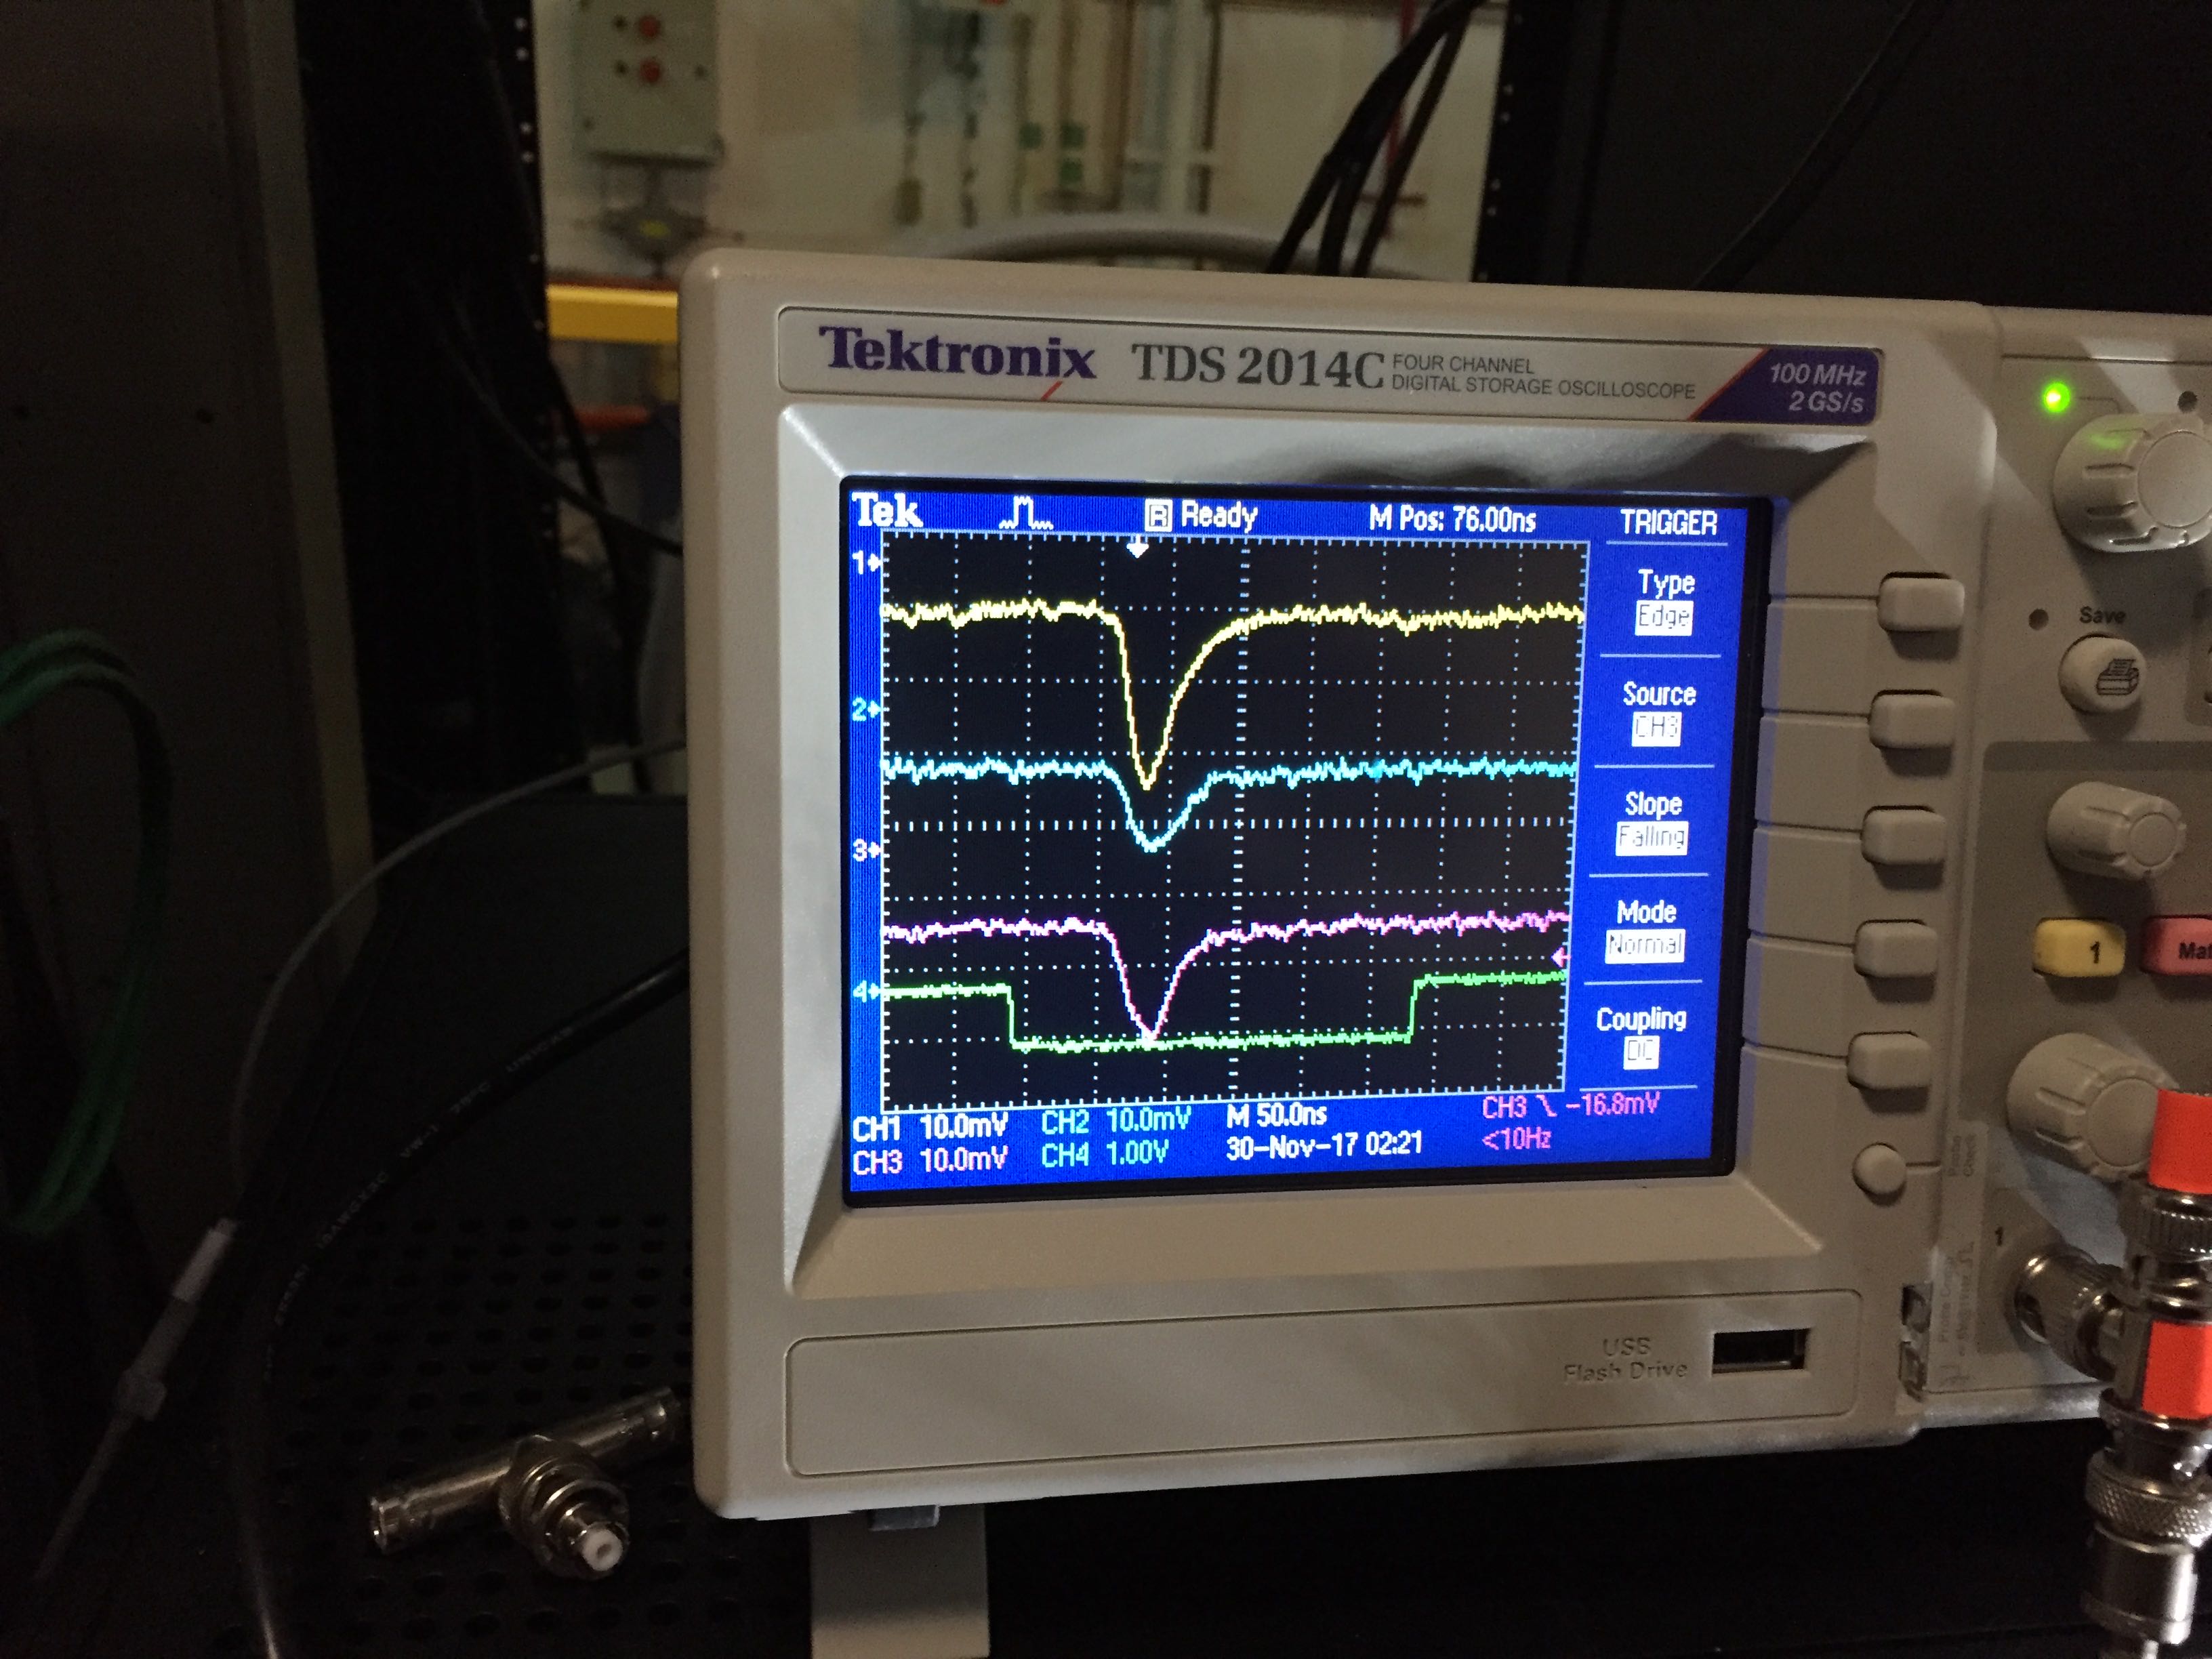
Output of the Rx cards for the same tile-number from the three stacked supersectors fall well within the gate. They have baseline offsets of about 10 mV. The gate is overly wide, about 275 ns.