Policies
Centrality approval procedure
Centrality approval procedure- Present to the relevant PWG and get approval
- Present at the centrality meeting, and get approved by the centrality coordinator
- Inform the convener list (1 week for comments)
- Commit parameters to STAR library
- Make announcement to the whole collaboration
Derived plots from published data
This page documents the proposed procedure for approving derived plots based on published data. This procedure only applies to the cases where internal information that is not available in the published paper, such as correlations between systematic uncertainties, is used.- Prepare derived plots with captions, along with a brief note on how these plots are generated, e.g. how are the systematic uncertainties treated
- Present the plots to relevant PWG for approval, including both the figures, physics message and the note
- Send the derived plots in pdf format to PAC. The file names should contain the word "DERIVED"
- Upload the brief note to the Drupal page where the regular analysis note for the published paper resides
Express stream data approval agreement
This document outlines the agreement made with management and PWGC for the potential for the relevant PWG conveners to approve to preliminary status the following analyses performed on the STAR authorized express stream production of the BES-II datasets:FXT Mode:
2019 - 4.59 AGeV, 7.3 AGeV with TFG19e;
2020 - 5.75 AGeV, 7.3 AGeV, 9.8 AGeV, 13.5 AGeV, 19.5 AGeV, 31.2 AGeV with TFG20a;
2021 - 3.85 AGeV with TFG21e, TFG21g, TFG21g.B; 44.5 AGeV, 100AGeV with TFG21e;
Collider Mode:
2020 - 9.2 GeV with TFG20a; 11.5 GeV with TFG19m, TFG20a;
2021 - 7.7 GeV with TFG21c.B; 17.3 GeV with TFG21e;
which are located at:
RCF: /gpfs01/star/pwg_tasks/tfg02
HLT: /hlt/cephfs/Pico/
HPSS: /home/fisyak/reco/Pico
1. Observation of He4L, He5L, H4L->tppi
2. Probing hypernuclei structure with Dalitz plot
3. Binding energy vs mass of hypernuclei
The process by which these express stream results are approved for preliminary status will be the same as for all other analyses from the official productions as outlined in our publications policies. This includes a rigorous check of any corrections applied, including verification of the quality of the embedding used.
Express stream results must be clearly labeled as both “STAR Preliminary” and “Express Stream Production”.
It must be clear during each presentation of these results (either talks or proceedings) that the express stream calibrations are not the final calibrations, and hence some results and conclusions may change after the final calibrations and reproduction are performed.
No second preliminary for any of these results will be approved from either the express stream or the official production. The next release of updated results will be at publication.
The final published results must be derived from the final official production of each dataset.
No other preliminary results will be approved from analyses of the express stream datasets.
Presentations including these results must also be approved by STAR as per our publication policies.
Guidances for STAR presentations
This blog documents guidances, including requirements and suggestions, for STAR presentations.Guidance on using italic vs. roman fonts for symbols: Guidances
- Note: it should be written as $p$+$p$ and $p$+Au, etc, which is different from the guidance
Title page
The presenter is required to add the following:- Speaker's name, and “On behalf of the STAR Collaboration” or “For the STAR Collaboration”
- Speaker's institution name and/or logo
- DOE logo: please add "Supported in part by" above the DOE logo. Logos from other funding agencies are encouraged to be added to as well
- It is preferred to use the DOE logo with the text "Office of Science"
- STAR logo (some DOE & STAR examples can be found here)
- Conference name/logo, date and location
These also apply to posters.
Footer
Here are more tips for preparing your slides:
Footer
It is suggested to add the speaker name, conference name and date, slide number, and/or STAR logo. Institution name or logo should not be added.
Tips for slides
Here are more tips for preparing your slides:- Have consistent capitalization of your slide’s titles. We don’t care if its just the first word, or every word, just keep it consistent
- You can use any font you like, but try and stick to at most 2 for the presentation, but the font size should not be less the 20pt
- All plots need axis labels with units and STAR or STAR preliminary on them. Include a label giving the collision system and energy. Avoid excessive empty space in your figures or around their edges. Reduce the ranges of your axes as much as reasonably possible
- Don’t use yellow or light green - it may look good on your screen but they do not project
- Please try to use both color, symbol shape and filled/hollow symbols on your graphs. As an example, while for many of us red/blue is easily distinguishable some people are color blind and cannot differentiate - using different marker symbols in addition mean all the audience can distinguish your different data points.
- If you have more than 3 plots on a slide you have too many and no-one will be able to take in all the information
- Have one, and only one, intended take-away message for each slide. It should be highlighted in some fashion from the rest of the text on the slide. I should be able to walk into the room, take one look at a slide and be able to tell someone immediately what the message of the slide is. If you have more then one key message, your slide is too busy and the audience won’t follow
- Try to make figures as large as possible. The auditoriums are often large and we all sit at the back and many have bad eyesight
- Try and use bullets not whole sentences. You want the audience listening to you, not desperately trying to read all the text on your slide. The slides are meant to support the narration of the speaker, not make the speaker superfluous
- If you have more than 1 slide per minute you have WAY to many! Your audience are likely seeing your results for the first time, you need to give them time to digest what’s plotted - what the axes are etc - before they can digest what the scientific message of the data is
- Check that figure axis labels don’t extend off of the canvas (this often happen for superscript and subscripts) and that the text doesn’t run into the axis tick marks. Use high quality figures, not low resolution bitmaps
Tips for posters
Here are more tips for preparing your poster:- If you include your abstract on your poster its OK to change it a little, to reflect what you are actually going to show, rather than what you hoped to show several months back. If you make a major change to the abstract please make sure that your PWG convener is aware that you have done this. The same goes for the poster title, its OK to tweak it a little.
- Have consistent capitalization of your poster title and section headings. We don’t care if its just the first word, or every word, just keep it consistent
- Don’t overcrowd your poster with text and figures. People want to browse all the posters and won’t be willing to stand there and read what amounts to a long research paper. You should try and convey one or two key messages.
- You can use any font you like, but try and stick to at most 2 for the poster. The fonts need to be large. A good rule of thumb is if you print it out on A4/US letter size paper you should be able to read it easily. If you can’t when printed out poster size you won’t be able to read it from a few feet away, which is bad. You are expecting a crowd around you poster so you need to be able to read it from a distance
- All plots need axis labels with units and STAR or STAR preliminary on them. Include a label giving the collision system and energy. Avoid excessive empty space in your figures or around their edges. Reduce the ranges of your axes as much as reasonably possible.
- Don’t use yellow or light green - it may look good on your screen but they does not print very well
- Please try to use both color, symbol shape and filled/hollow symbols on your graphs. As an example, while for many of us red/blue is easily distinguishable some people are color blind and cannot differentiate - using different marker symbols in addition mean all the audience can distinguish your different data points.
- Have one, and only one, intended take-away message for each section fo your poster. It should be highlighted in some fashion from the rest of the text on the slide. I should be able to walk up to poster, take a quick look and be able to tell someone immediately what the key messages are.
- Try to make figures as large as possible - you can frequently convey a lot more with a figure than you can with a wall of text.
- Try and use bullets not whole sentences. You want to use the poster to encourage people to discuss your results with you.
- Check that figure axis labels don’t extend off of the canvas (this often happen for superscript and subscripts) and that the text doesn’t run into the axis tick marks. Use high quality figures, not low resolution bitmaps. Remember this is going to be printed out much larger than usual
Guidelines for paper code preparations
Guidelines for preparing paper codes to be committed to CVS- General guideline: people should be able to reproduce paper figures using provided instructions, codes and histograms
- What should be included:
- Analysis source code, such as analysis makers, job submission script, plotting macros, etc
- Modified files of standard makers from STAR library
- Small rootfiles containing necessary histograms, including those from running the full statistics, for reproducing paper figures
- Instructions on how to run the code such that Code QA can reproduce the paper figures
- Final results based on a small amount (1-2) of input PicoDst/MuDst and/or embedding files. These results will naturally have large error bars, but code QA should be able to reproduce them exactly.
- Input PicoDst/MuDst and/or embedding files used to generate the results above should be restored and saved on RCF, but not needed to be committed to CVS
- What should not be included:
- Secondary files, such as library files (.o, .so), figures, etc, that can be produced from source code
- Log files
- Empty directories
- Remove all the directories named "CVS" (check the subdirectories as well). Otherwise, one might get into trouble during committing.
- Standard makers that can be obtained from the STAR official library. Instructions should be given on how to retrieve the correct version of these makers. If some files are modified within a standard marker, only the modified files should be committed
- For common codes, such as StRefMultCorr, that are used multiple times in different parts of the analysis, they should be committed only once.
- Rootfiles of raw data, embedding data, analysis trees, etc.
- Private embedding data, analysis trees, analysis histograms etc are recommended to be backed up to HPSS (How-to)
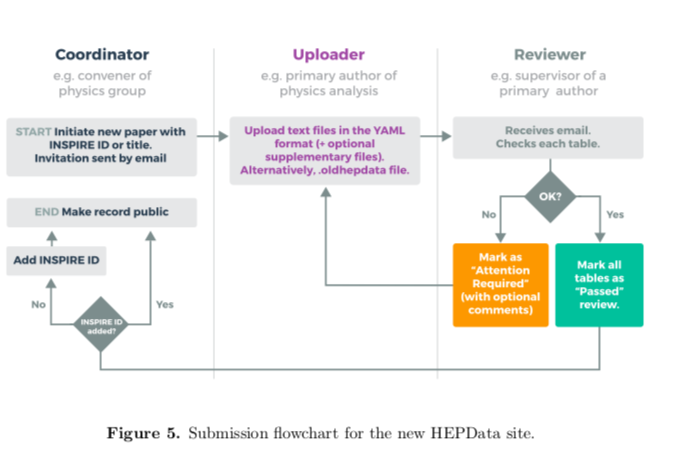
Instructions on HepData submission
This page collects resources regarding how to prepare YAML data tables and upload them to HepData.Guidance on significant digits: guidance, example code
A custom C++ class to convert the ROOT TGraphErrors/TGraphAsymmErrors to YAML: CODES [credit to Yicheng Feng (feng216@purdue.edu)]
Resources
- Local STAR data
- STAR data available on HEPdata.net
- INSPIRE list of STAR publications ordered by the number of citations (to help in chosing papers for uploading)
- Submission process in a nutshell
- A useful YAML maker
- HEPData YAML validator (useful to use before submission)
- Another simple validator
- HEPdata sandbox for checking uploads
- A set of useful slides compiled by Nandita
- Local STAR support (Mattermost)
- A good example: https://www.hepdata.net/record/ins1897216
Strongly recommended: Inclusion of “Image file” and “Thumbnail image file”). (EXAMPLE)
Those fields really give a nice connection to the relevant figure from the paper. (To be obtained from STAR’s png plots are on the paper website or directly cropped from the paper.) In the submission.yaml file you can add these through these lines:
--
additional_resources:
- {description: Image file, location: Fig2.png}
- {description: Thumbnail image file, location: thumb_Fig2.png}
Data_file: figure_2.yaml
Submission procedure:

PWGC preview requirements
This page document the requirements for PWGC previewRequired documents
1) A webpage containing
- PA list
- target journal
- paper title
- abstract
- figures with major if not all systematic uncertainties and captions
- tables, if any, with captions
- conclusions including physics messages
- links to relevant PWG presentations for reference
3) Analysis note: optional
Preliminary plots
This page collects general guidance for preliminary plots-The STAR Preliminary label is not needed for plots from which no one can deduce physics messages.
PWGC meeting discussion
Responsibilities for GPC members
For the definition and scope of the God-Parent Committee, see STAR publication policy, section 14 for details here- Here is a quote: "The GPC will review the paper to ensure that the presentation of the physics (or technical) message and the data is clear and persuasive. It should take into account the overall construction of the paper and the logical flow of the text as well as the technical accuracy and the correctness of the analysis."
Practical responsibilities for GPC members
- Chair
- Oversee the whole GPC procedure, and make sure it goes smoothly and in a timely fashion
- Call for meetings
- Set up deadlines for the GPC to provide comments to PAs
- Communicate with Physics Analysis Coordinator
- Member at large
- Participate in meetings
- Provide feedback in time
- English QA
- Check typo, grammar and logical flow of the content of the manuscript
- Code QA
- Make sure instructions are easy to follow and complete
- Make sure the codes compile and run properly
- Reproduce exactly the analysis results based on the few files provided by PAs
- Be able to reproduce the paper figures
- A tip: one can run cppcheck on RCF to find potential mistakes. The syntax is "cppcheck --enable=all test.C" or "cppcheck --enable=all StRoot/StMyAnalysis", where the former checks only the supplied macro while the latter checks all the codes in the directory
Significant digits for HepData table
This page documents the guidance of determining the significant digits for data tables uploaded to HepData- Choose the smaller one between statistical and systematic uncertainties when both are reported. Otherwise, use the single error reported.
- Follow PDG practice: "The basic rule states that if the three highest order digits of the error lie between 100 and 354, we round to two significant digits. If they lie between 355 and 949, we round to one significant digit. Finally, if they lie between 950 and 999, we round up to 1000 and keep two significant digits. In all cases, the central values is given a precision the matches that of the error"
- PRD 98 (2018) 030001, Introduction 5.3
- 0.279008 +/- 0.0123261 +/- 0.000766099 -> 0.2790 +/- 0.0123 +/- 0.0008 (significant digits determined based on 0.000766099)
- 0.279008 +/- 0.0123261 +/- 0.0766099 -> 0.279 +/- 0.012 +/- 0.077 (significant digits determined based on 0.0123261)
-Special cases of including more significant digits than recommended will be treated on a case-by-case basis by GPC chair and PAC.