pp400 (2005)
pp400 (actually 410 GeV) data was collected on days 153 and 154 in early June 2005.The attached file is a before and after calibration comparion of DCAs.
First look
When I plot dca vs. zdce+zdcw, pp400 looks identical to pp200! Plotting dca vs. bbce+bbcw (which is the scaler quantity used for correcting pp200 data), shows that there is a difference! I was nearly fooled. In the following plots, pp200 are black points, while pp400 are red.
Trial one: 30% increase in SC
I tried increasing SC scaling by 30% from standard pp200 (1.0e-8 => 1.3e-8) while holding the GL steady. The result is some remaining undercorrection: DCAs of about -300 microns at bbcsum=1.5e5, and ~0 at bbcsum=4.0e5. Conclusion is that this is pretty good, but we can do a little better. It appears to me that the offset needs to be decreased (actually, a linear fit to the uncorrected plots suggested this too), and the scaling also by just a little bit.The attached plot shows the DCAs vs. bbce+bbcw for no correction (red), standard pp200 correction (blue), and the 30% trial correction (magenta).
GridLeak plots
Looking at the residuals (GridLeak plots), I can see that things are similar to pp200, witth what appears to be an offset in GridLeak distortion at all z (our current understanding of the distortion has it go to zero at the ground planes, |z| = 208 cm). I include here three plots of GridLeak distortion residuals from tracks for high luminosity pp400 data (runs 6154024-6154031, bbce+bbcw > 2e5):[radius on horizontal axis, distance from central membrane |z| on depth axis]
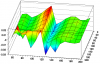
GridLeak plot for pp400 data with no correction, high luminosities
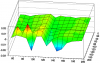
GridLeak plot for pp400 data with standard pp200 corrections, high luminosities
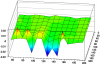
GridLeak plot for pp400 data with 30% above standard pp200 corrections, high luminosities