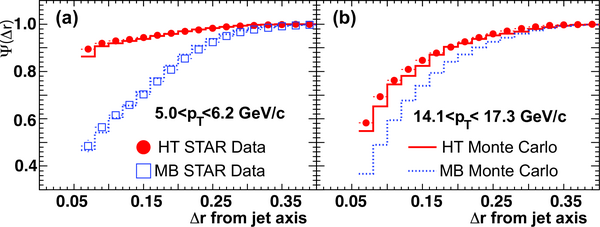
 Fig1: Jet profile &Psi(&Delta r, rcone, pT versus inner cone size
&Delta r at rcone= 0.4 for MB (open squares) and HT (filled circles)
data compared with STAR Monte Carlo simulation in two jet pT bins
(a) 5.0 < pT < 6.2 and (b) 14.1 < pT < 17.3 GeV/c.
In (b) the MB jet yield was too small to measure.
Fig1: Jet profile &Psi(&Delta r, rcone, pT versus inner cone size
&Delta r at rcone= 0.4 for MB (open squares) and HT (filled circles)
data compared with STAR Monte Carlo simulation in two jet pT bins
(a) 5.0 < pT < 6.2 and (b) 14.1 < pT < 17.3 GeV/c.
In (b) the MB jet yield was too small to measure.
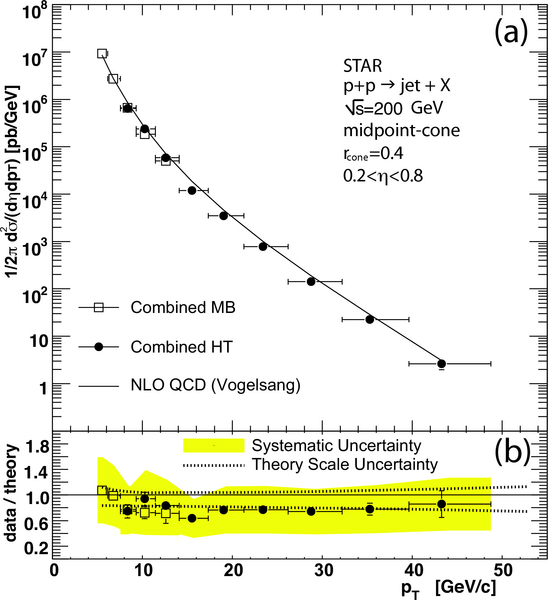 Fig.2: (a) Inclusive differential cross section for p+p -> jet +X
at sqrt(s) = 200 GeV versus jet pT for a jet cone radius
of 0.4. The symbols show MB (open squares) and HT (filled circles) data
from the years 2003 and 2004 combined. The horizontal bars indicate the ranges
of the pT intervals. The curve shows a NLO calculation.
(b) Comparison of theory and data. The band indicates the experimental systematic uncertainty.
The upper (lower) dashed line indicates the relative change of the NLO calculation
when it is evaluated at &mu = pT/2 (&mu = 2pT).
Fig.2: (a) Inclusive differential cross section for p+p -> jet +X
at sqrt(s) = 200 GeV versus jet pT for a jet cone radius
of 0.4. The symbols show MB (open squares) and HT (filled circles) data
from the years 2003 and 2004 combined. The horizontal bars indicate the ranges
of the pT intervals. The curve shows a NLO calculation.
(b) Comparison of theory and data. The band indicates the experimental systematic uncertainty.
The upper (lower) dashed line indicates the relative change of the NLO calculation
when it is evaluated at &mu = pT/2 (&mu = 2pT).
| Open squares (minimum bias trigger) | ||
|---|---|---|
| bin limits [GeV] | <pT> [GeV] | (1/2&pi)(d2σ/(d&eta dpT) [pb/GeV] (+/- stat +/- sys) |
| 5.0-6.2 | 5.5 | (9.3 +/- 0.3 +/- 4.5)e+06 |
| 6.2-7.6 | 6.8 | (2.7 +/- 0.1 +/- 1.3)e+06 | 7.6-9.3 | 8.3 | (6.7 +/- 0.5 +/- 3.2)e+05 | 9.3-11.4 | 10.3 | (1.84 +/- 0.24 +/- 0.88)e+05 | 11.4-14.1 | 12.6 | (5.1 +/- 1.1 +/- 2.4)e+04 | Filled circles (high tower trigger) |
| bin limits [GeV] | <pT> [GeV] | (1/2&pi)(d2σ/(d&eta dpT) [pb/GeV] (+/- stat +/- sys) |
| 7.6-9.3 | 8.3 | (6.4 +/- 0.9 +/- 3.1)e+05 | 2.29.3-11.4 | 10.3 | (2.4 +/- 0.3 +/- 1.1)e+05 | 11.4-14.1 | 12.6 | (5.9 +/- 0.6 +/- 2.8)e+04 | 14.1-17.3 | 15.5 | (1.19 +/- 0.10 +/- 0.57)e+04 | 17.3-21.3 | 19.0 | (3.5 +/- 0.2 +/- 1.7)e+03 | 21.3-26.2 | 23.4 | (7.8 +/- 0.4 +/- 3.7)e+02 | 26.2-32.2 | 28.7 | (1.41 +/- 0.09 +/- 0.68)e+02 | 32.2-39.6 | 35.3 | (2.2 +/- 0.3 +/- 1.1)e+01 | 39.6-48.7 | 43.3 | (2.6 +/- 0.6 +/- 1.3)e+00 |
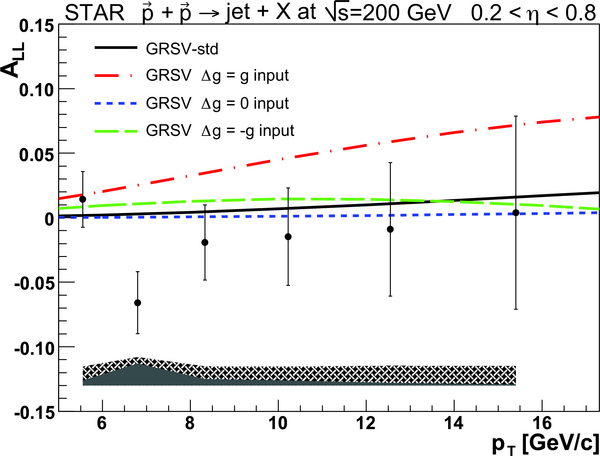 Fig.3: The longitudinal double-spin asymmetry ALL in
p+p-> jet +X at sqrt(s) = 200 GeV
versus jet pT. The uncertainties on the data points are statistical.
The gray band indicates the systematic uncertainty from the beam polarization
measurement, and the hatched band the total systematic uncertainty.
The curves show predictions based on deep-inelastic scattering
parametrizations of gluon polarization.
Fig.3: The longitudinal double-spin asymmetry ALL in
p+p-> jet +X at sqrt(s) = 200 GeV
versus jet pT. The uncertainties on the data points are statistical.
The gray band indicates the systematic uncertainty from the beam polarization
measurement, and the hatched band the total systematic uncertainty.
The curves show predictions based on deep-inelastic scattering
parametrizations of gluon polarization.
| Filled circles (high tower trigger) | ||
|---|---|---|
| bin limits [GeV] | <pT> [GeV] | ALL (+/-stat +/-syst) |
| 5.0-6.2 | 5.5 | +0.014 +/- 0.022 +/- 0.015 |
| 6.2-7.6 | 6.8 | -0.066 +/- 0.024 +/- 0.022 | 7.6-9.3 | 8.3 | -0.019 +/- 0.029 +/- 0.015 | 9.3-11.4 | 10.2 | -0.015 +/- 0.038 +/- 0.015 | 11.4-14.1 | 12.6 | -0.009 +/- 0.052 +/- 0.015 | 14.1-17.3 | 15.4 | +0.004 +/- 0.075 +/- 0.015 |
If you have questions or find
any problems with this web page please send mail to
James Dunlop
.
This page was last updated on