- leun's home page
- Posts
- 2013
- 2012
- December (2)
- October (3)
- September (2)
- August (1)
- July (4)
- June (4)
- May (2)
- April (3)
- March (5)
- February (5)
- January (5)
- 2011
- December (3)
- November (3)
- September (5)
- August (2)
- July (2)
- June (3)
- May (4)
- April (4)
- March (2)
- February (4)
- January (2)
- 2010
- December (2)
- November (3)
- October (3)
- September (5)
- August (6)
- July (2)
- June (4)
- May (3)
- April (4)
- March (4)
- February (2)
- January (4)
- 2009
- 2008
- October (1)
- My blog
- Post new blog entry
- All blogs
FPD Run6 Transverse Analysis-Single Photon Splitting
Summary Page for Run6 FPD Single Photon Splitting Analysis
This page is meant to be an overview of the work that has been done on the issue of the single photon splitting since the analysis meeting at LBL in Oct. 09.
Link to the talk at LBL analysis meeting
Relevant blog contents linked from this page
Single Photon Splitting Filter
The reconstruction code that has been used for the FPD and, with minor modifications, FMS analysis was designed and tuned for one and two photon clusters below ~50GeV. We wish to extend our analysis beyond that energy, for the following reasons.
1. The acceptance of the Eta meson is mostly at high energy. In order to make comparison of the Eta asymmetry to Pi0 asymmetry, we need to be able to reconstruct Pi0s reliablly at energy>55GeV, where the average two photon separation becomes less than the width of an FPD Pb glass cell.
2. There is an expectation the direct photon cross-section will become significant relative to pi0 decay photons above ~50GeV. Since most of the Pi0 daughters would fall into a single cluster at this energy, the ability to disentangle a cluster that has two closely spaced photons is absolutely crucial in single photon analysis.
3. If we can understand this issue well enough, we can not only get the asymmetries at high energy, but also make the cross-section measurements for Pi0s and single photons.
4. The results from this analysis can likely be applied to future FMS analysis, as the inner FMS cells use the same Pb glass cells, and reconstruction code is essetially identical. It can be especially useful in 500GeV runs until we install an SMD for the FMS.
A concern that was raised regarding Pi0 asymmetry at high energy was that the background coming from single photons split by mis-reconstruction may be diluting the Pi0 asymmetry. Considering that there is a prediction that the direct photons may have an asymmetry with an opposite sign, this effect could potentially be significant.
The following work has been done to address this issue. It is still work in progress, and as more webpages are added, they will be linked to this page.
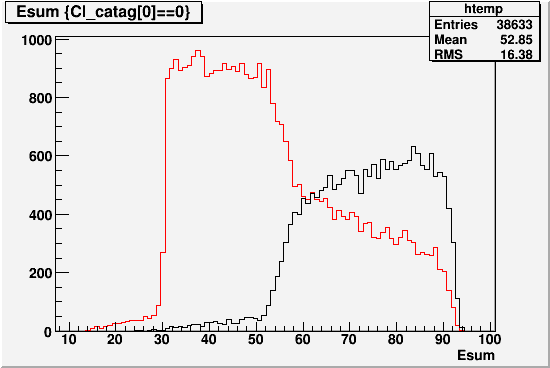
As discussed during the LBL analysis meeting, the initial finding was that the probability of single photon splitting was very high (~50%) at high energy. The reason for this was because the cluster categorization schem, which is performed before fitting is attempted, tended to put about half of the high energy single photon clusters into the two photon cluster category. Once categorized as such, it will always produce two photons regardless of the quality of the fit.
More details can be found here.
Fig. 1. Distribution of cluster categories vs. summed energy for single photons. RED:Category 1(single photon cluster) BLACK:Category 2 (two photon cluster)
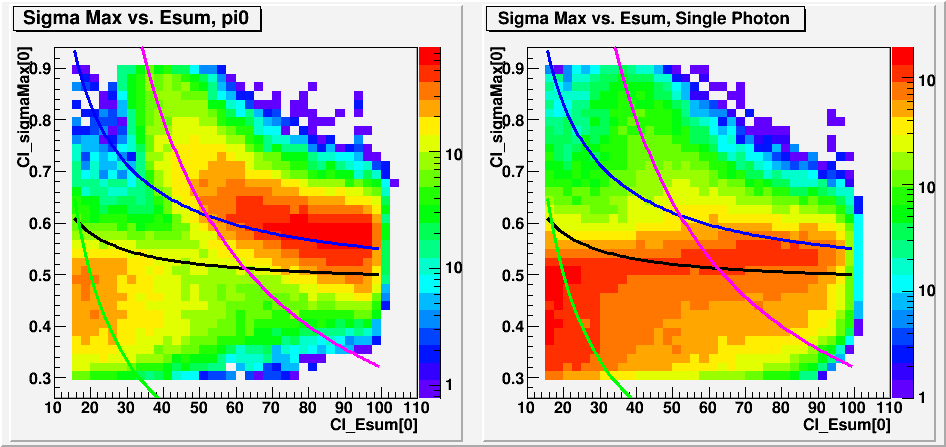
However, once we added noise and digitization effect, the story changed significantly. The digitization kills most of the very soft towers, and that makes the energy weighted variance of clusters smaller. Since this variance, called Cluster Sigma Max, is essetially what determines the cluster categorization, reconstruction is very sensitive to it.
More details on this can be found here.
Fig. 2. Cluster sigma max vs. Cluster summed energy, with no digitization. Area above purple and blue is considered category 2. (two photon cluster)
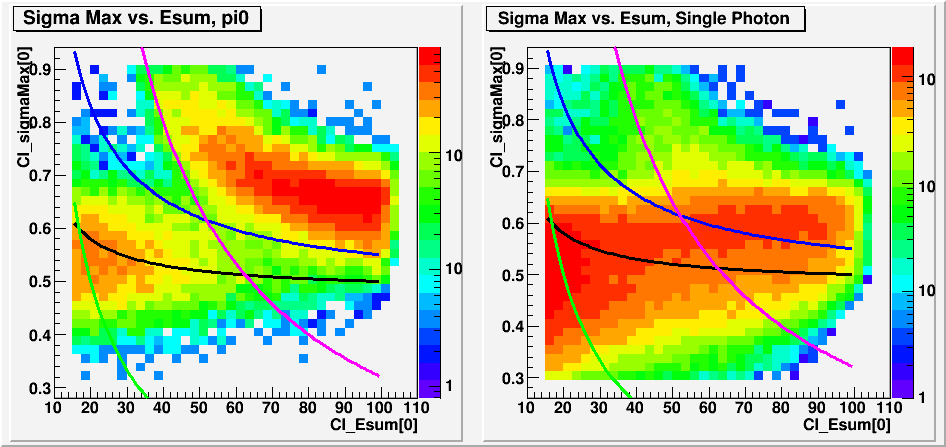
Fig. 3. Cluster sigma max vs. Cluster summed energy, with digitization and noise. Area above purple and blue is considered category 2. (two photon cluster)
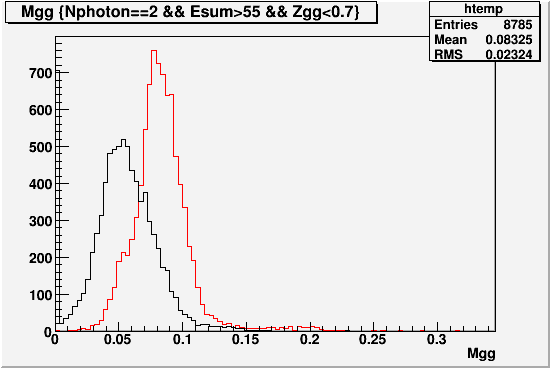
Furthermore, since the splitting is an artifact of the reconstruction, it tends to leave signatures in various kinematic variables. The most obvious of these is the double mass peaks produced by the splitting as shown here.
Fig. 4. Fake mass peaks from single photon splitting, for Zgg>0.7(Black) and Zgg<0.7(Red)
Expanding on this, we apply the Single Photon Splitting Filter described in this page. It is essentially four different cuts in Zgg, Dgg, and Mgg space designed to catch the signatures of the split single photon, while minimizing the side effect of merging good Pi0s. When implemented, it catches 60~70% of the split single photons, while mistakenly merges ~5% of pi0s.
Fig.5 Total probability for the Splitting FIlter to catch split photons (Blue) and to merge real pi0s into fake single photons. (Red)
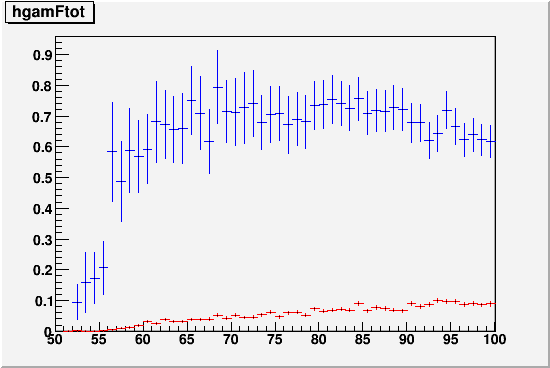
Fig. 6. Single photon splitting probability as a function of energy, with digitization and noise, and with single photon splitting filter (Blue).
.gif)
So we see that indeed the single photon splitting probability in this estimation is less than 5% for up to ~80GeV, which is about where highest energy data is.
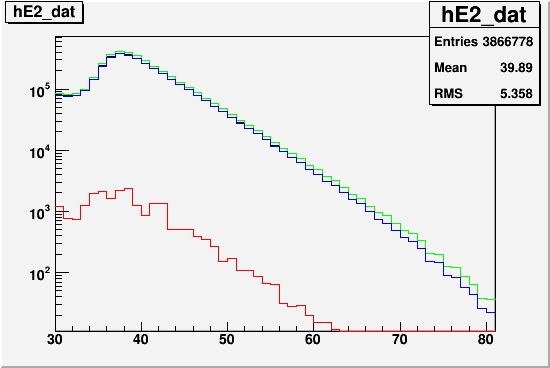
Taking these results at face value, (knowing full well that we really shouldn't) we can do a crude estimation of single photon background for the Pi0 based on the actual number of observed 1 and 2 photon events. Again, this is a very rough estimate, but we predict that the single photon background is more than 2 orders of magnitude down compared to the pi0 signal. Despite the obvious limitations of this estimate, it gives us confidence that the single photon background is highly unlikley to be dominating the Pi0 sample. This is also consistent with the lack of obvious single photons splitting peaks in the pi0 mass spectrum, which looks very healthy up to 70 GeV. More details can be found here.
Fig. 7. Estimation of Pi0 signal (in Blue) and split single photon background (in Red) in data
In order to take the analysis to the next step, we need to quantify just how well we simulate the showers in GSTAR. All the details of the splitting and merging depends on cluster parameters that are very sensitive to the shower shape. The first attempt at this was again based on the existing gamma only simulation.
The details can be found here.
Here, as an example, we compare data and MC for the clusters that happened to land in the corner where 4 cells meet. We tend to get the most information for these clusters. The quantity we compare is the fraction of the cluster energy that went to the highest, 2nd highest, and 3rd highest towers within the cluster.
Fig. 9. For 4-corner events, the energy fraction for (from the left) the highest tower, the second highest tower, and the third highest tower within the cluster. RED:Simulation, BLACK:Data

On the other hand, we do much worse when the cluster hits right in the center of a cell.
Fig. 10. For central events, the energy fraction for (from the left) the highest tower, the second highest tower, and the third highest tower within the cluster. RED:Simulation, BLACK:Data

In the previous link, more plots and comparison can be found.
Overall, the means of the distribution are fairly well simulated, but the tails and the width are not. Full pythia-GSTAR simulation that accounts for the steep energy slope, rapidity distribution, jetty backgrounds with charged hadrons, etc is the next step.
- leun's blog
- Login or register to post comments
