- BEMC
- BEMC Detector Operator Manual
- Calibrations
- BPRS
- BSMD
- BTOW - Calibration Procedure
- Run 12 BTOW Calibration
- Run 3 BTOW Calibration
- Run 4 BTOW Calibration
- Run 5 BTOW Calibration
- Run 6 BTOW Calibration
- Run 7 BTOW Calibration
- Run 8 BTOW Calibration (2008)
- Run 9 BTOW Calibration
- 01 BTOW HV Mapping
- 02 Comparing 2007, 2008 and 2009 BTOW Slopes
- 03 study of 2009 slopes (jan)
- 04 Spectra from Problem PMT Channels
- 05 Summary of HV Adjustment Procedure
- 06 comparison of BTOW status bits L2ped vs. L2W , pp 500 (jan)
- 07 BTOW status tables ver 1, uploaded to DB, pp 500
- 08 End or run status
- 09 MIP peaks calculated using L2W stream
- 10 Electron E/p from pp500 L2W events
- 12 Correcting Relative gains from 500 GeV L2W
- 13 Updating Calibration using the latest L2W production
- 14 200 GeV Calibration
- Database
- Hardware
- Mapping
- Service Tasks
- Software
- Useful Documents
- EEMC
- ETOF
- FCS
- FGT
- FPD & FMS & FPS
- FTPC
- FTT
- HLT
- L3
- PMD
- PP2PP
- RICH
- Roman Pot Phase II*
- SSD
- SVT
- Slow Controls
- TPC
- TRG
- Trigger Detectors
- VPD
- test
02 Comparing 2007, 2008 and 2009 BTOW Slopes
Updated on Sat, 2009-03-14 22:40. Originally created by trent on 2009-03-11 00:27.
Under: Run 10066160 HVFile = 2009_i1c.csv (2009 HV)
Run 10066163 HVFile = 2009_i0c.csv (2008 HV)
2007 Data HVFile = 2007_i8.csv (2007 HV)
We have taken two sets of 1M pp events at sqrt(s)=500 GeV. For future reference, the statistical error on the slopes is typically in the range of 3.7%. I give a plot of the relative errors in the 5th attachment.
plus we have
Comparing the overall uniformity of the gain settings, I give the distribution of slopes divided by the average over the region |ETA|<0.8 for 2007, 2008 and 2009 (First three attachments)
I find that there is little difference in the overall uniformity of the slopes distribution over the detector...about +/-5%. I also give a plot showing the average slopes in each eta ring for the three different voltage settings in each year 2007. 2008 and 2009. (4th attachment) As you can see, the outer eta rings were overcorrected in 2008. They are now back to nearly the same positions as in 2007.
_________________________________________________________________
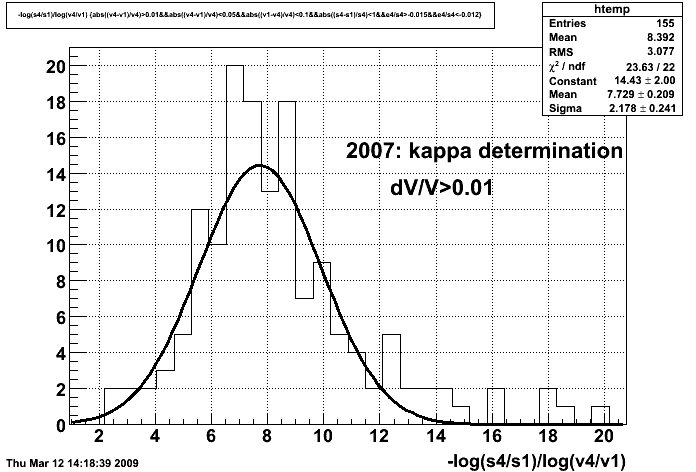
Here is my measurement of 'kappa' from 2007 data. I get from 7-8, depending on how stringent the cuts are. I think this method of determining kappa is dependent on the ADC fitting range. In theory, we should approach kappa~10.6 as we converge to smaller voltage shifts.
So which ones should we adjust? Here is a fit of the slope distribution to a gaussian.
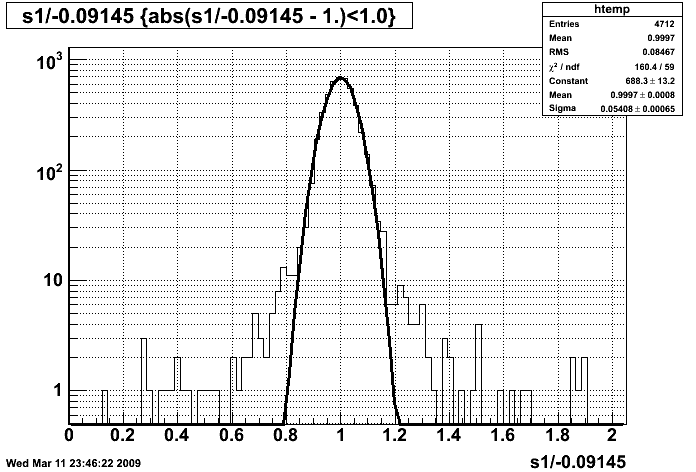
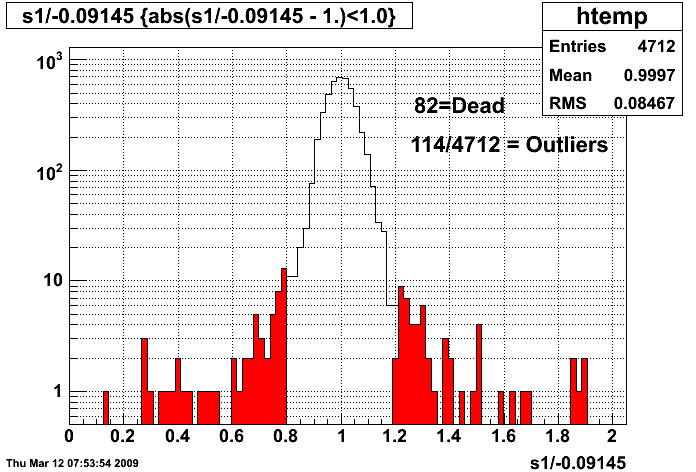
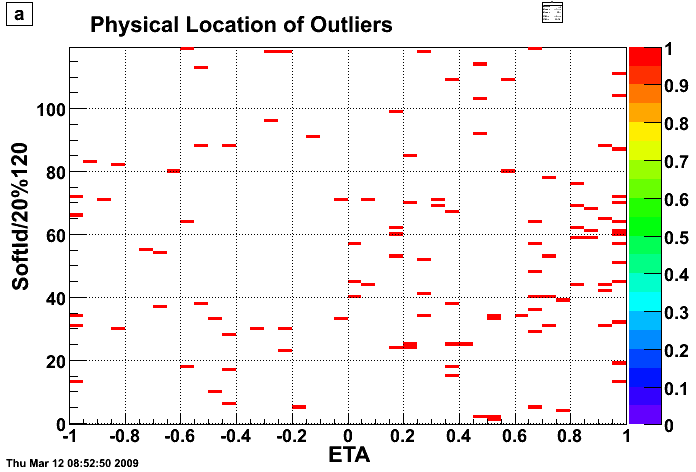
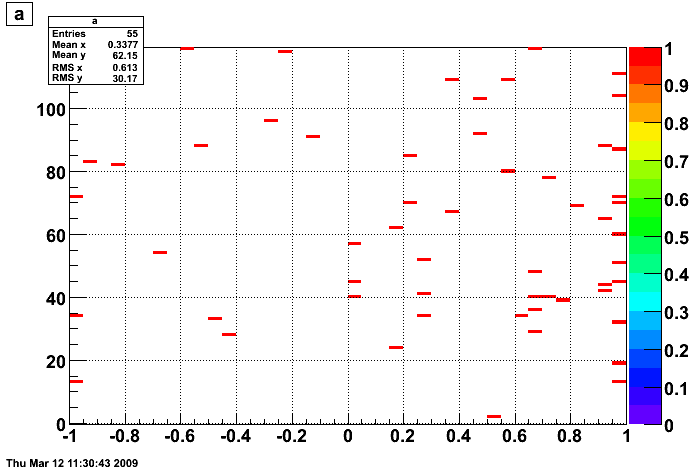
As we can see, the distribution has an excess of towers with slopes >+/-20% from the average. I checked that these problem towers are not overwhelmingly swapped towers (15/114 outliers are swapped towers; 191/4712 are swapped towers). Here is an eta:phi distribution (phi is SoftId/20%120, NOT angle!). The graph on the left gives ALL outliers, the graph on the right gives outliers with high slopes only (low voltage). There are slightly more than expected in the eta~1 ring, indicating that the voltages for this ring are set to accept few particles than the center of the barrel.
______________________________________________________________________
So Oleg Tsai and I propose to change only those outliers which satisfy the criteria:
|slope/ave_slope - 1|>0.2 && |eta|<0.8. (Total of 84 tubes)
We then looked one-by-one thru the spectra for all these tubes (Run 10066010) and found 12 tubes (not 13 as I stated in my email) with strange spectra:
Bad ADC Channels: Mask HV to Zero
We then calculated the proposed changes to the 2009_i1c.csv HV using the exponent kappa=5. Direct inspection of the spectra made us feel as though the predicted voltage changes were too large, so we recomputed them using kappa=10.48. We give a file containing a summary of these changes:
Proposed HV Changes (SoftId SwappedID Slope(i1c) Ave Slope Voltage(i1c) New Voltage
(We have identified 3 extra tubes with |eta|>0.8 which were masked out of the HT trigger to make it cleaner....we propose to add them to list to make a total of 87-7 = 80 HV changes.)
PS. We would also like to add SoftId-3017 HV800 -> 650. This make 81 HV changes.
_____________________________________________________________________
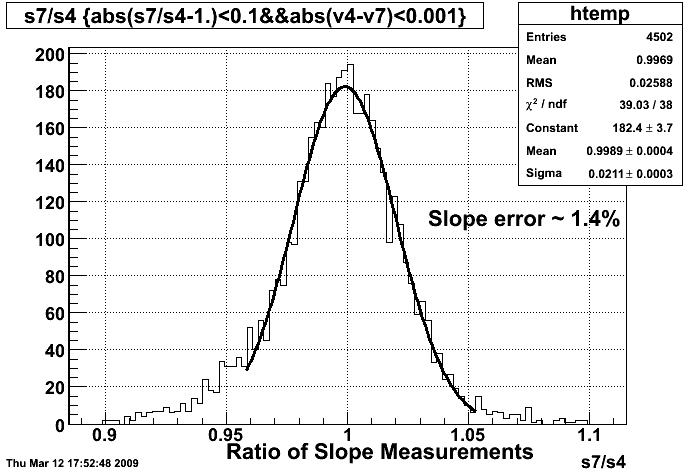
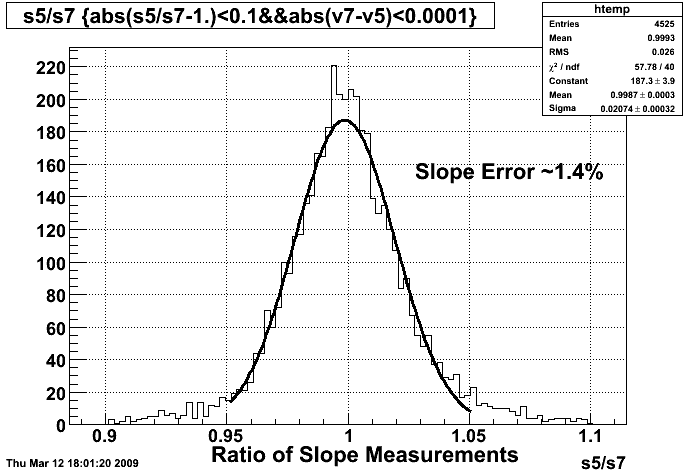
A word about stability of the PMT High Voltage and these measurements. I compared several pairs of measurements in 2007 taken days apart. Here is an intercomparison of 3 measurements (4,5 and 7) taken in 2007. The slopes have a statistical accuracy of 1.4%, so the distribution of the ratio of the two measurements should have a width of sqrt(2)*1.4 = 2% The comparison of the two measurements is just what we expect from the statistical accuracy of the slope measurements.
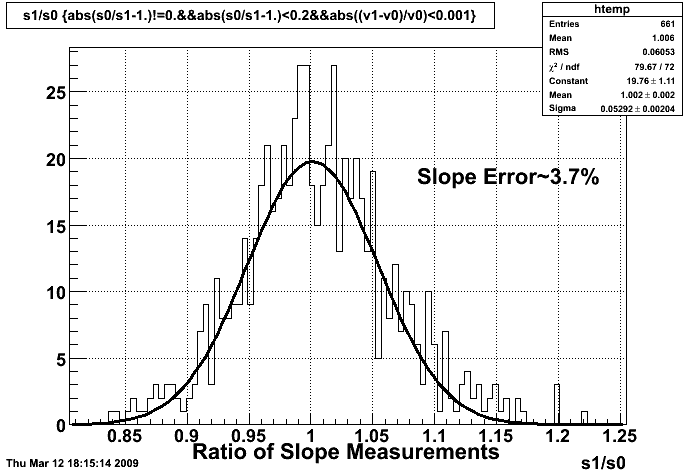
Comparing the two recent measurements in 2009, we have a set of about 600 tubes with a very small voltage change. The slopes were measured with an accuracy of 3.7%, so the width of the slope ratio distribution should be sqrt(2)*3.7% =5.2%. Again, this is exactly what we see. I do not find any evidence that (a large percentage of) the voltages are unstable!
___________________________________________________________________
»
- Printer-friendly version
- Login or register to post comments
