- BEMC
- BEMC Detector Operator Manual
- Calibrations
- Database
- Hardware
- Mapping
- Service Tasks
- Software
- Useful Documents
- EEMC
- ETOF
- FCS
- FGT
- FPD & FMS & FPS
- FTPC
- FTT
- HLT
- L3
- PMD
- PP2PP
- RICH
- Roman Pot Phase II*
- SSD
- SVT
- Slow Controls
- TPC
- TRG
- Trigger Detectors
- VPD
- test
Gain Stability Check
Updated on Wed, 2007-04-25 12:41. Originally created by kocolosk on 2006-11-28 22:01.
Under:
I've updated my codes to do a more systematic investigation of the stability of the gains. Instead of trying to get sufficient tower-by-tower statistics for different time periods, I'm looking at MIP peaks for single runs integrated over all towers. Here's the plot:
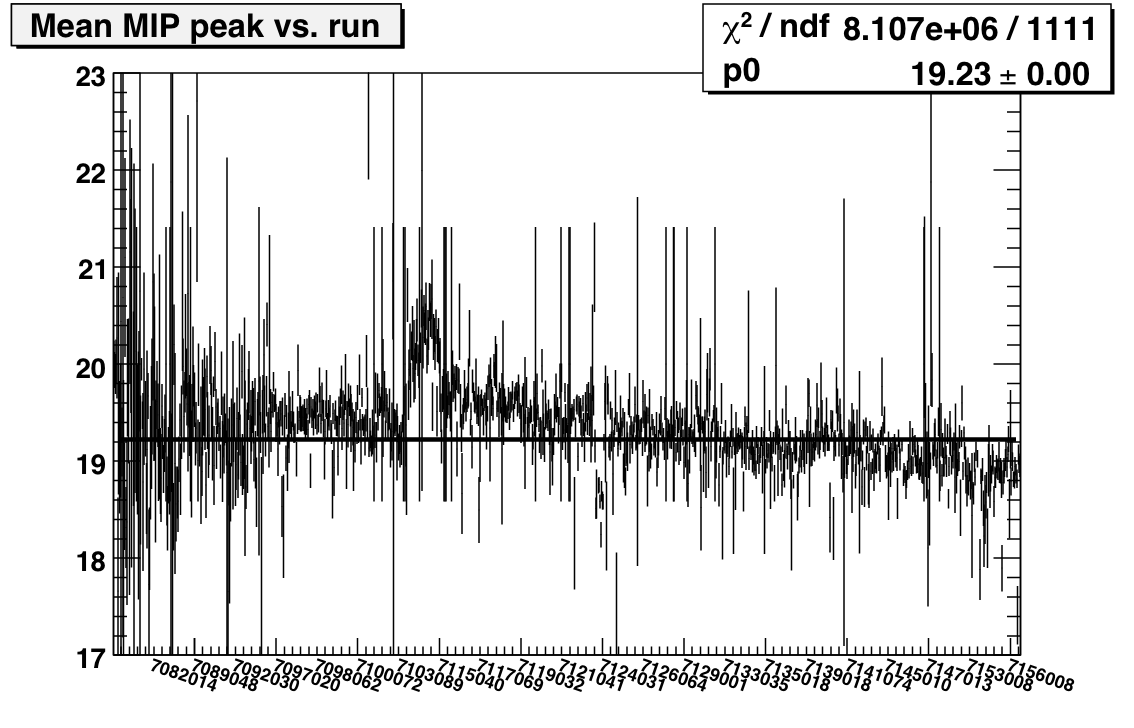
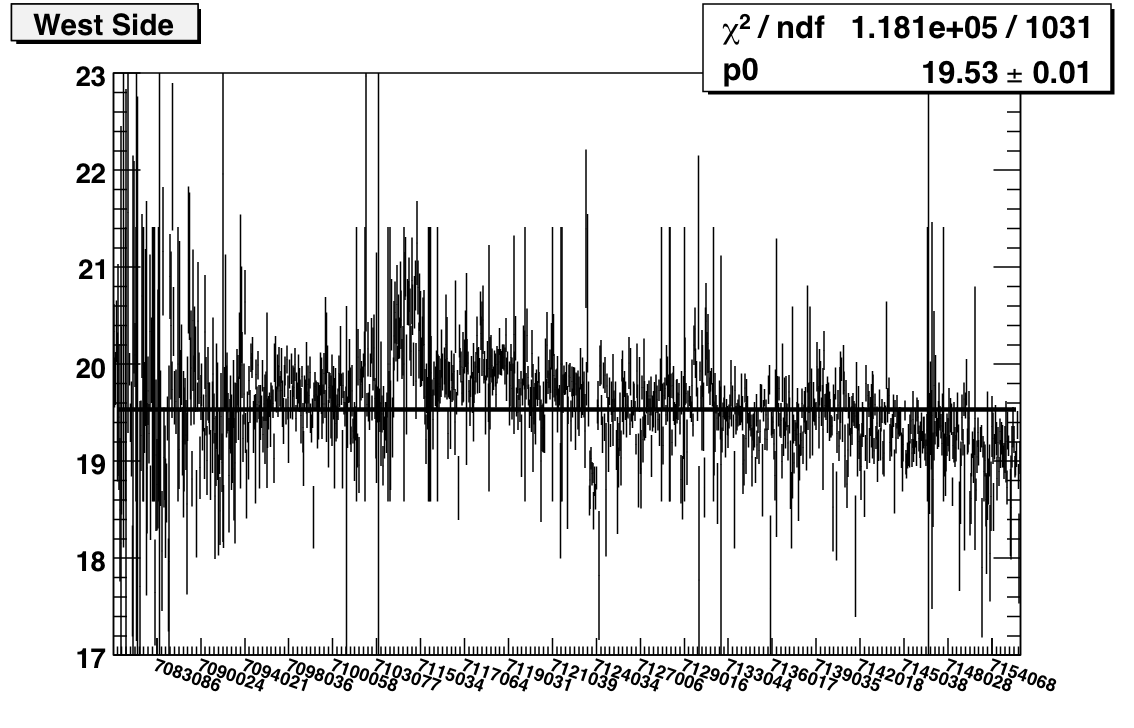
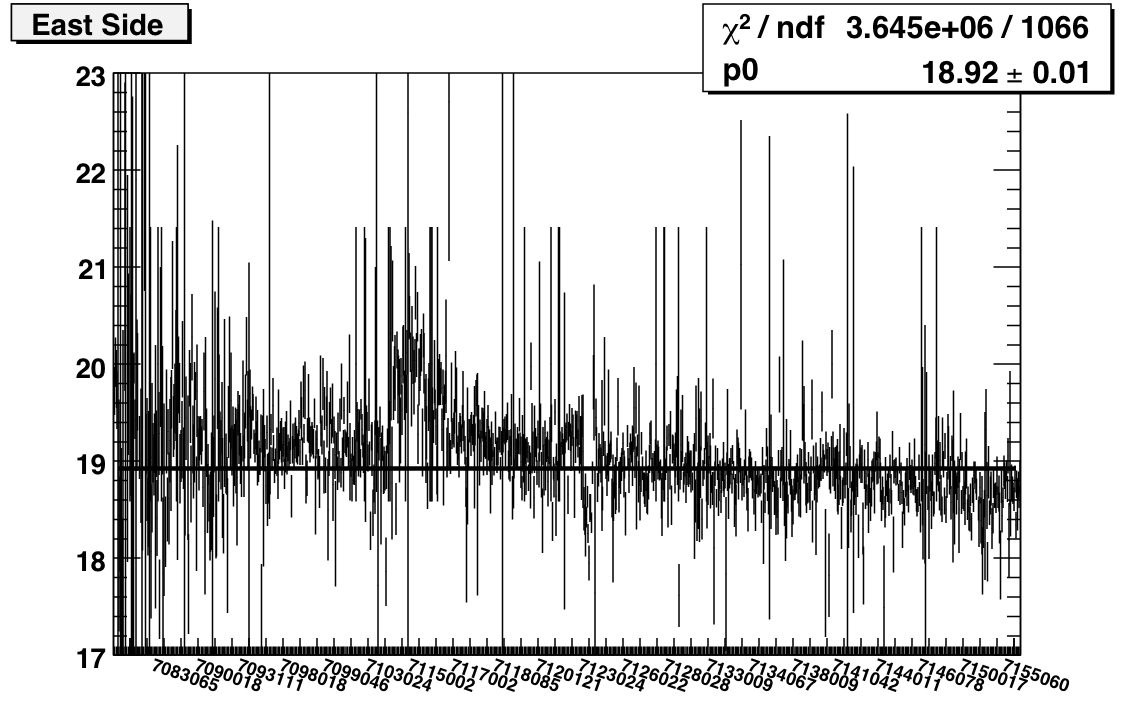
Features of note include the bump covering the first couple of days after the shutdown, the bunch of runs on day 123/4 with very low average peaks, and the general decreasing slope (consistent with towers losing high voltage). I also ran this plot for west and east separately:
I'm running jobs now to do electron selection instead of MIPs. I think that I can probably still do this as a function of run, but certainly I'll have sufficient stats to plot vs. fill if necessary.
Goal: Compare the tower slopes and MIP peaks from the following three periods to check for stability.
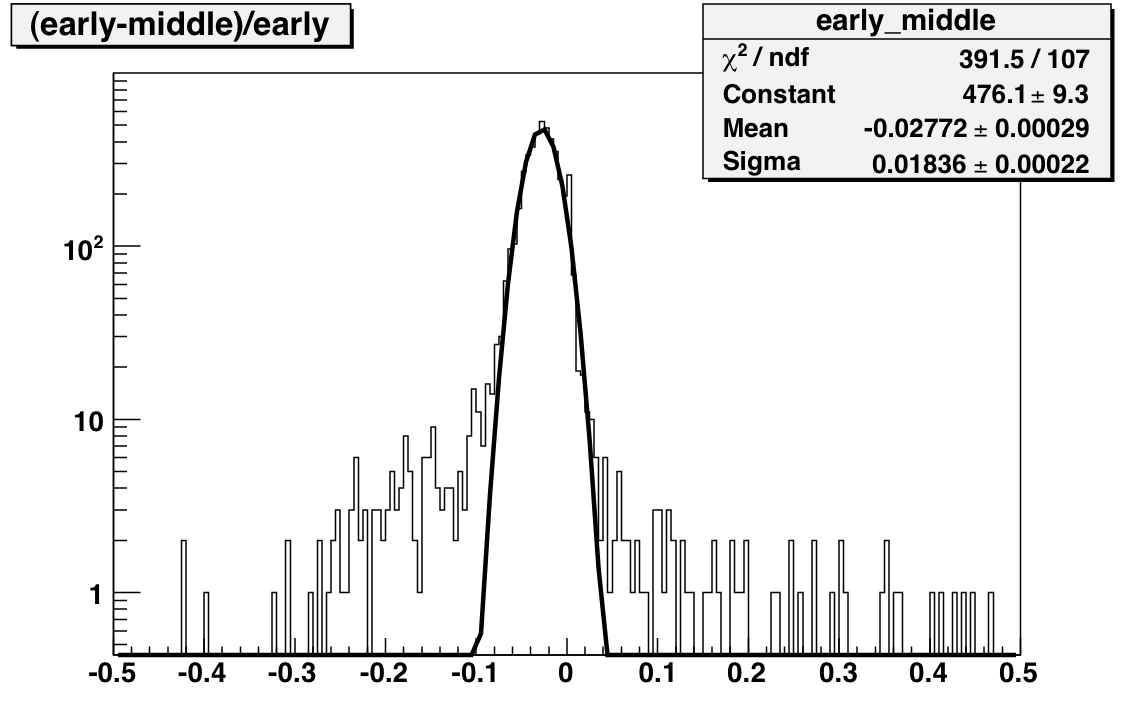
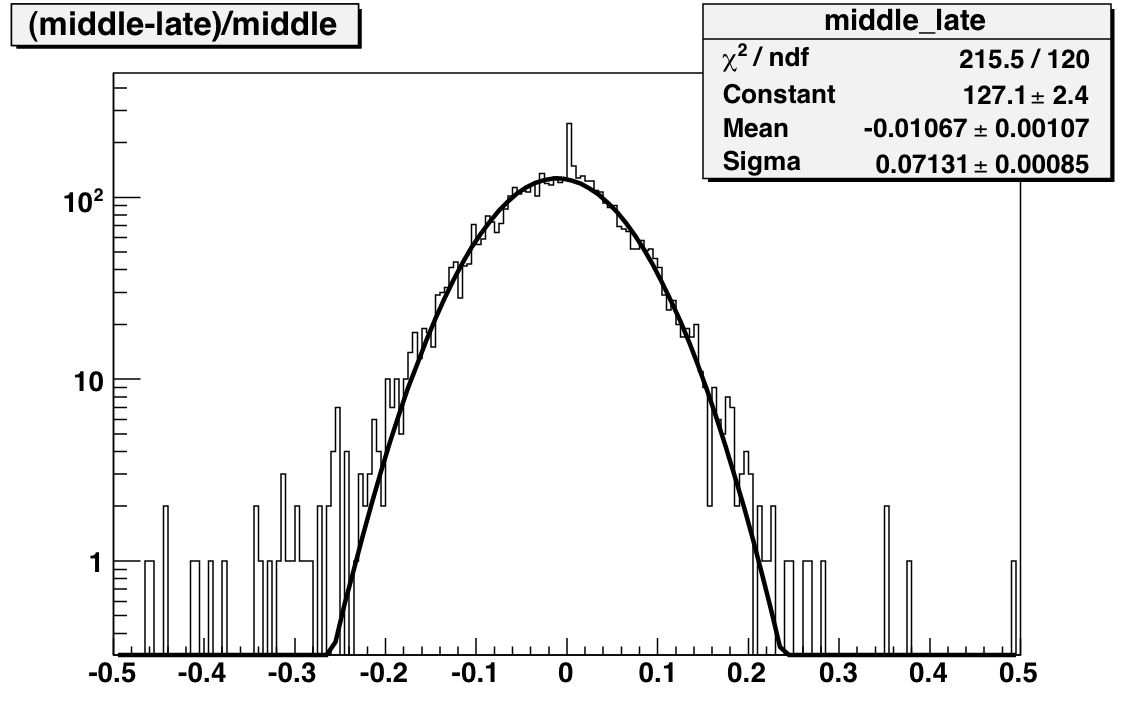
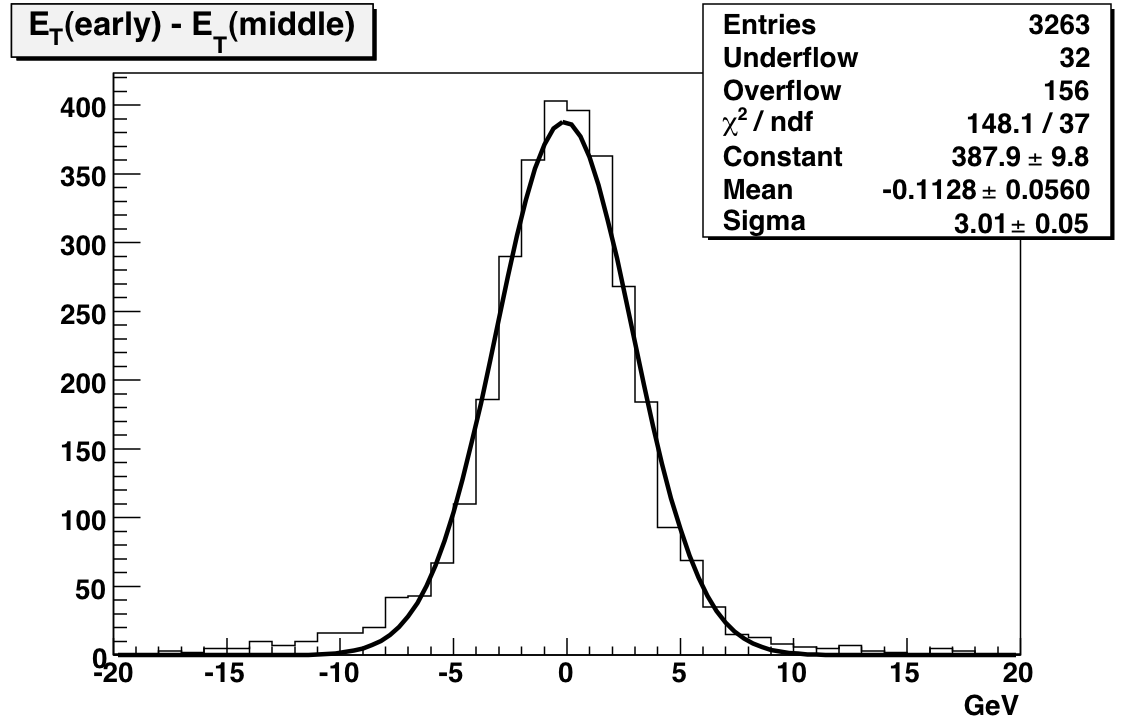
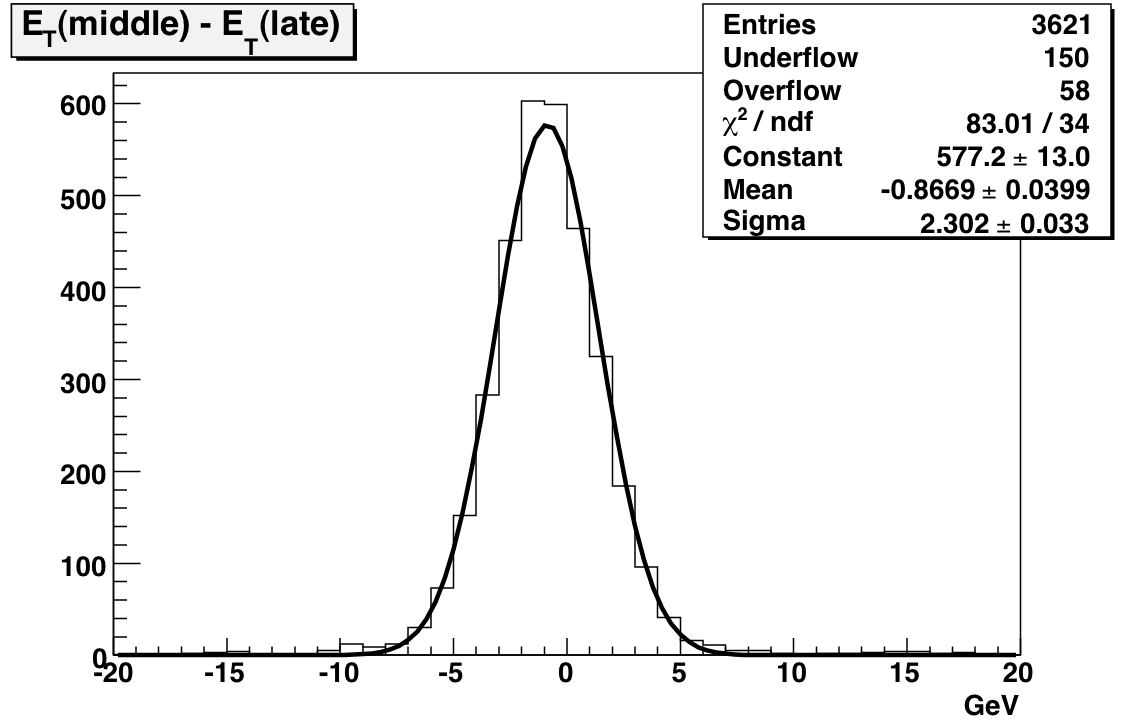
The next set of plots compare gains extracted from MIP peak positions where the MIP peaks are generated using subsets of the Run. Comparing before and after the shutdown yields a mean difference of 110 MeV with a width of 3 GeV. This difference is significantly less than 1 percent. The comparison between middle and late (essentially a comparison between transverse and late longitudinal running) indicates a 1.5 percent drop in the gains with a 2.3 GeV sigma.
Features of note include the bump covering the first couple of days after the shutdown, the bunch of runs on day 123/4 with very low average peaks, and the general decreasing slope (consistent with towers losing high voltage). I also ran this plot for west and east separately:
I'm running jobs now to do electron selection instead of MIPs. I think that I can probably still do this as a function of run, but certainly I'll have sufficient stats to plot vs. fill if necessary.
Goal: Compare the tower slopes and MIP peaks from the following three periods to check for stability.
- Day < 104 (97-99)
- 104 < Day < 134 (114-119)
- Day > 134 (134-139)
The next set of plots compare gains extracted from MIP peak positions where the MIP peaks are generated using subsets of the Run. Comparing before and after the shutdown yields a mean difference of 110 MeV with a width of 3 GeV. This difference is significantly less than 1 percent. The comparison between middle and late (essentially a comparison between transverse and late longitudinal running) indicates a 1.5 percent drop in the gains with a 2.3 GeV sigma.
»
- Printer-friendly version
- Login or register to post comments