05 May
May 2008 posts
2008.05.05 pt-distributions, sided residual (data vs dd-MC g-jet and bg di-jet)
Ilya Selyuzhenkov May 05, 2008
Data samples:
- pp2006(long) - 2006 pp production longitudinal data after applying gamma-jet aisolation cuts
(jet-tree sample: 4.114pb^-1 from Jamie script, 3.164 pb^1 analyses). - gamma-jet - Pythia gamma-jet sample (~170K events). Partonic pt range 5-35 GeV
- bg jets - Pythia di-jet sample (~4M events). Partonic pt range 3-65 GeV
Figure 1:pt distribution. MC data are scaled to the same luminosity as data
(Normalization factor: Luminosity * sigma / N_events).
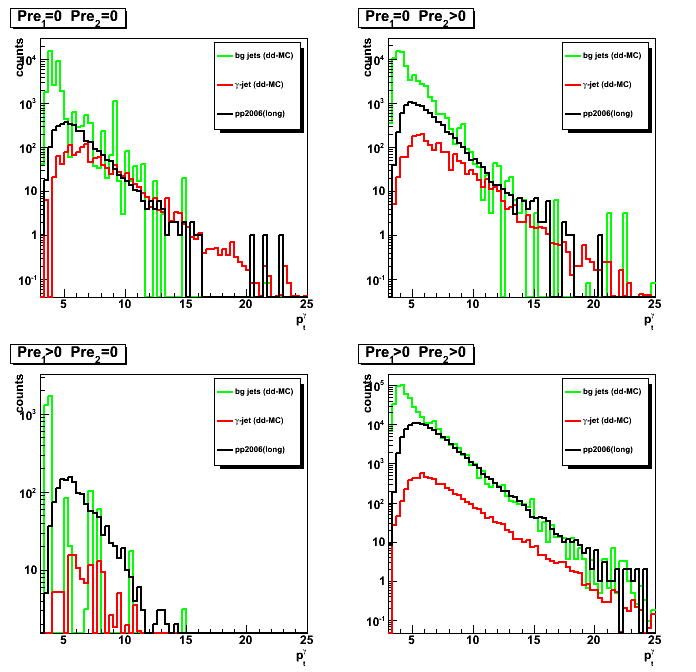
Figure 2:Integrated gamma yield vs pt.
For each pt bin yield is defined as the integral from this pt up to the maximum available pt.
MC data are scaled to the same luminosity as data.
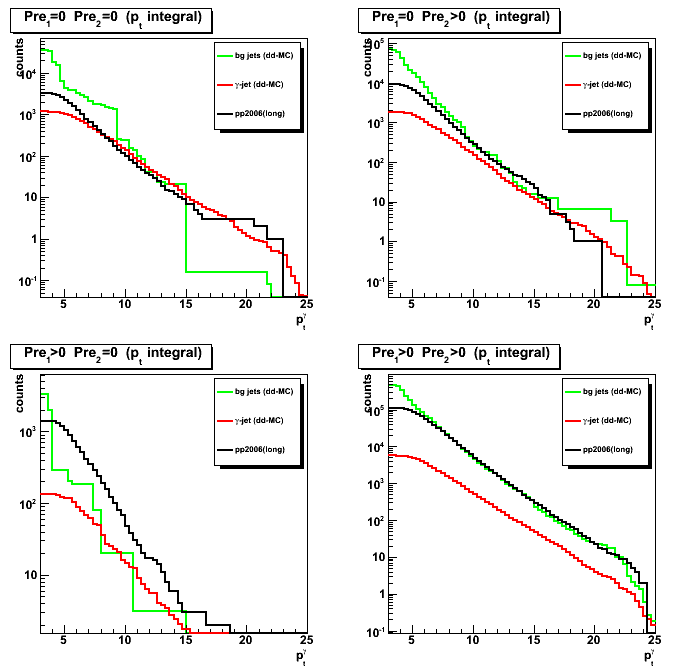
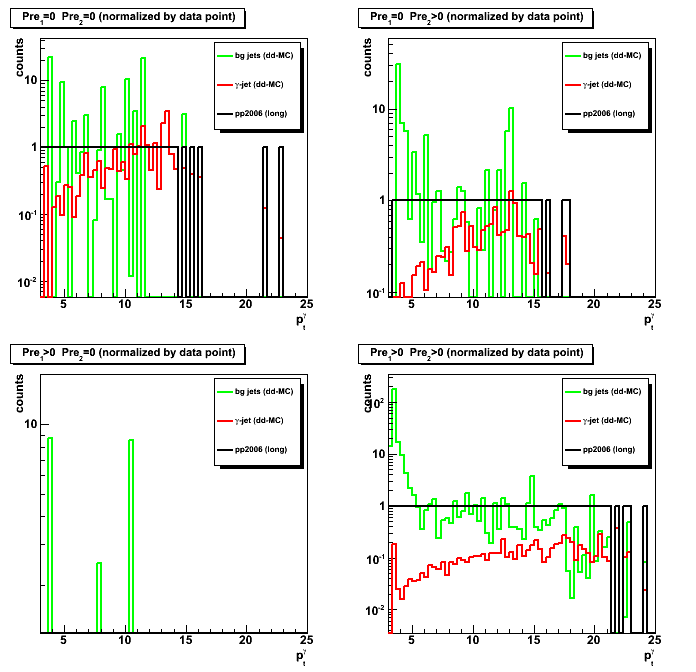
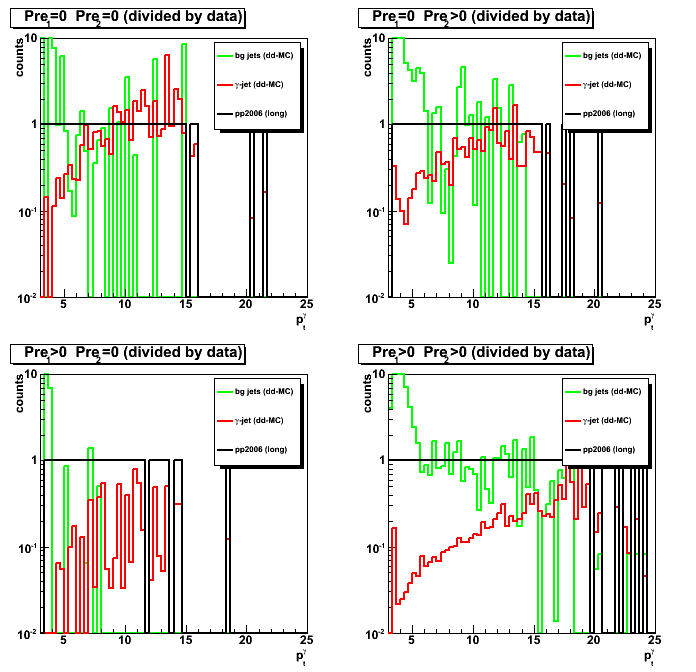
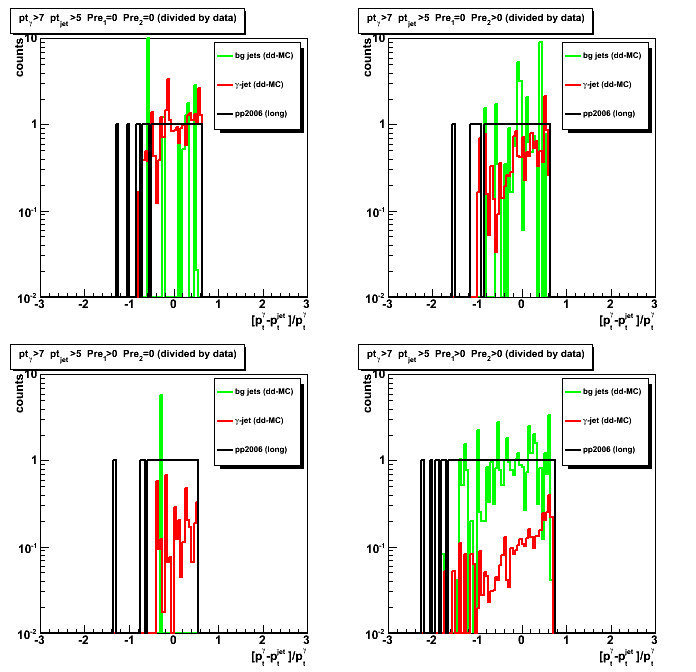
Figure 3:Signal to background ratio (all results divided by the data)
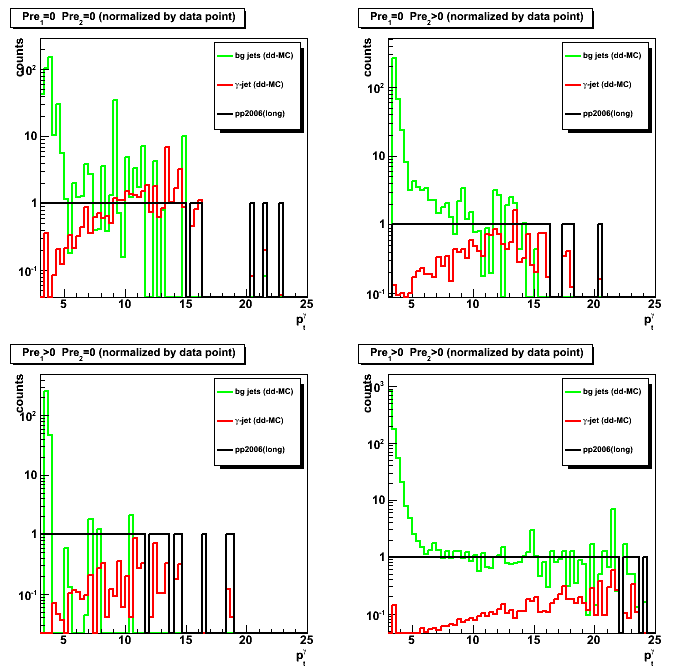
Sided residual: pp2006 data vs data-driven MC (gamma-jet and bg:jet-jet)
You can find sided residual 2-D plots here
Figure 4:Maximum sided residual for pt_gamma>7GeV; pt_jet>7GeV
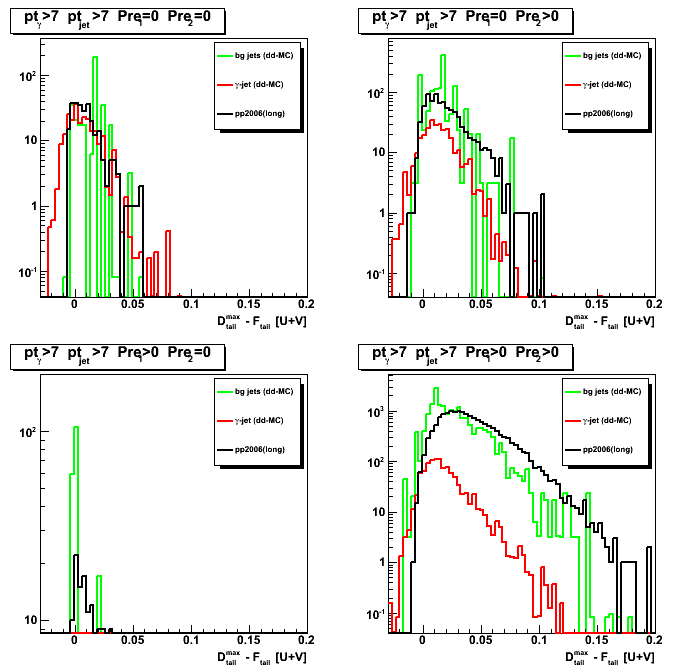
Figure 5:Fitted peak for pt_gamma>7GeV; pt_jet>7GeV
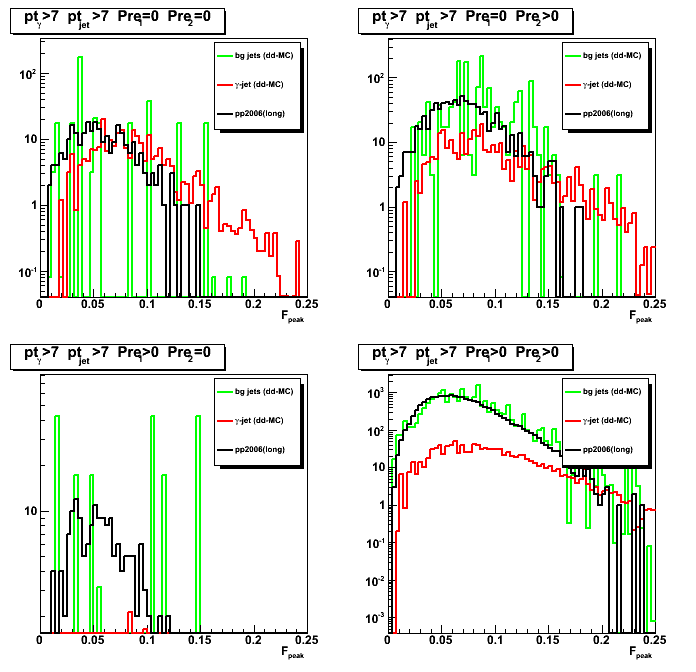
Figure 6:Max data tail for pt_gamma>7GeV; pt_jet>7GeV
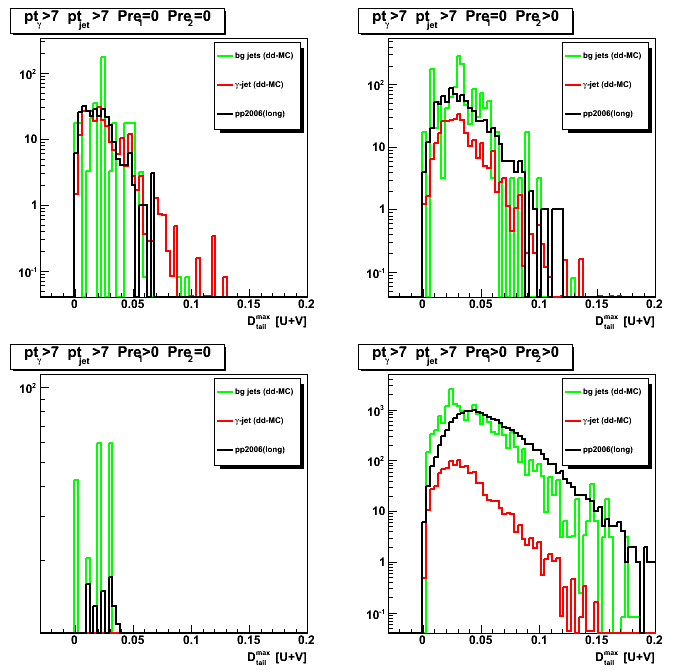
Figure 7:Max minus min data tails for pt_gamma>7GeV; pt_jet>7GeV
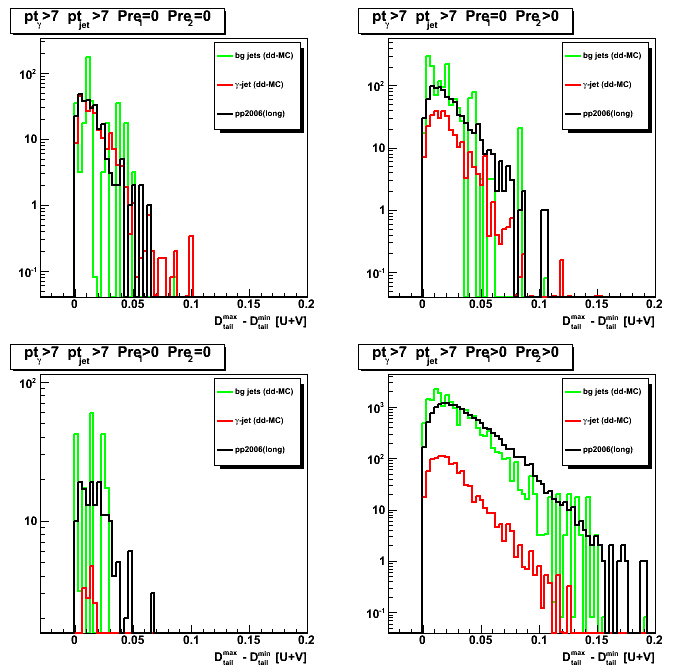
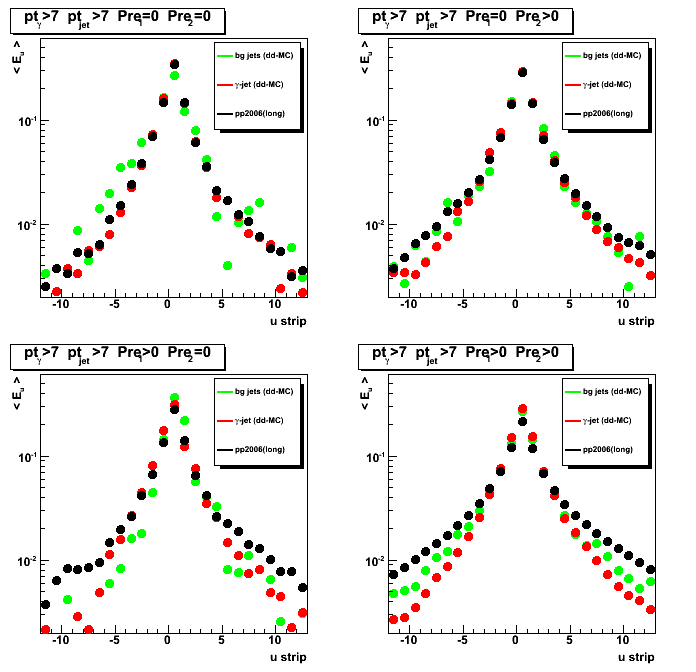
Figure 8:Shower shapes pt_gamma>7GeV; pt_jet>7GeV
2008.05.08 y:x EEMC position for gamma-jet candidates
Ilya Selyuzhenkov May 08, 2008
y:x EEMC position for gamma-jet candidates
Figure 1:y:x EEMC position for gamma-jet candidates:
Pythia gamma-jet sample (~170K events). Partonic pt range 5-35 GeV.
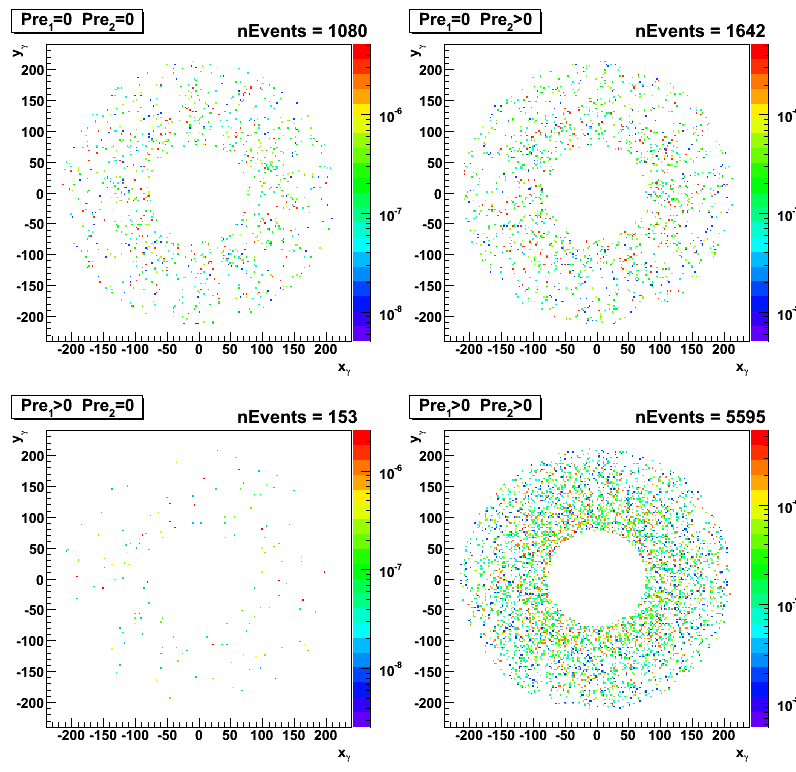
Figure 2:y:x EEMC position for gamma-jet candidates:
Pythia QCD bg sample (~4M events). Partonic pt range 3-65 GeV.
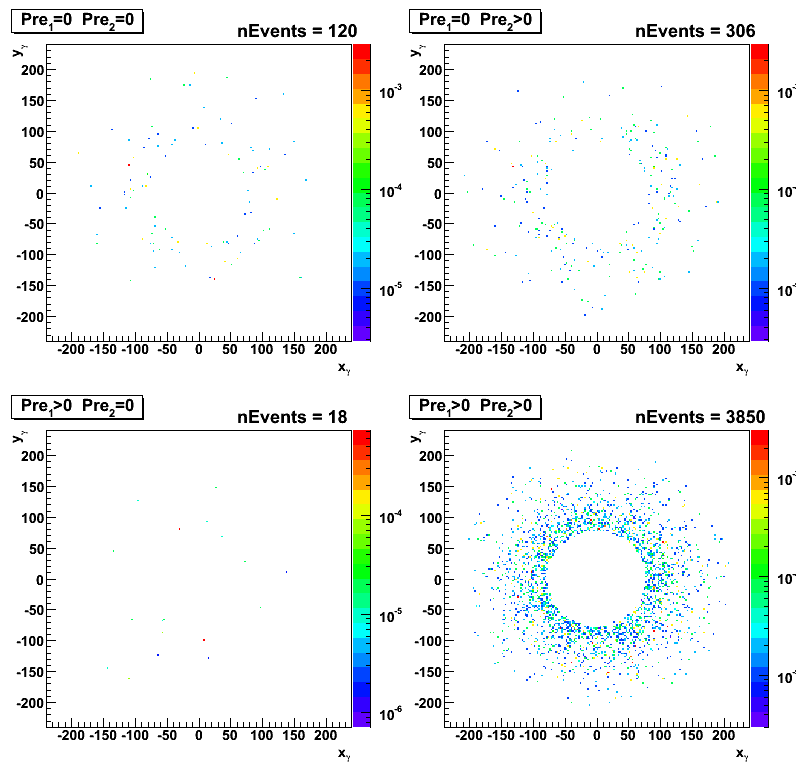
Figure 3:y:x EEMC position for gamma-jet candidates:
pp2006 (long) data [eemc-http-mb-l2gamma:137641 trigger]
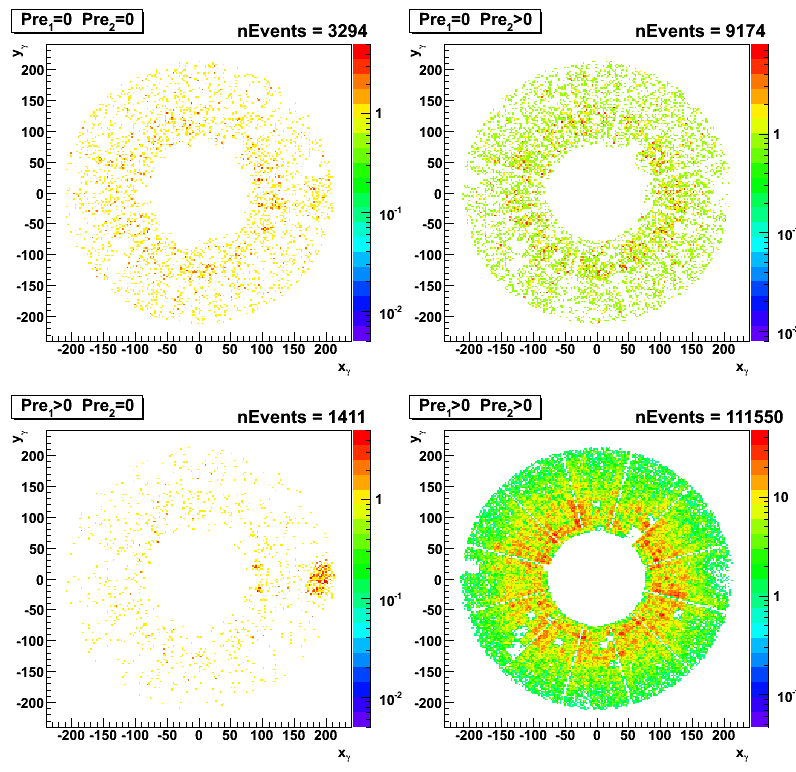
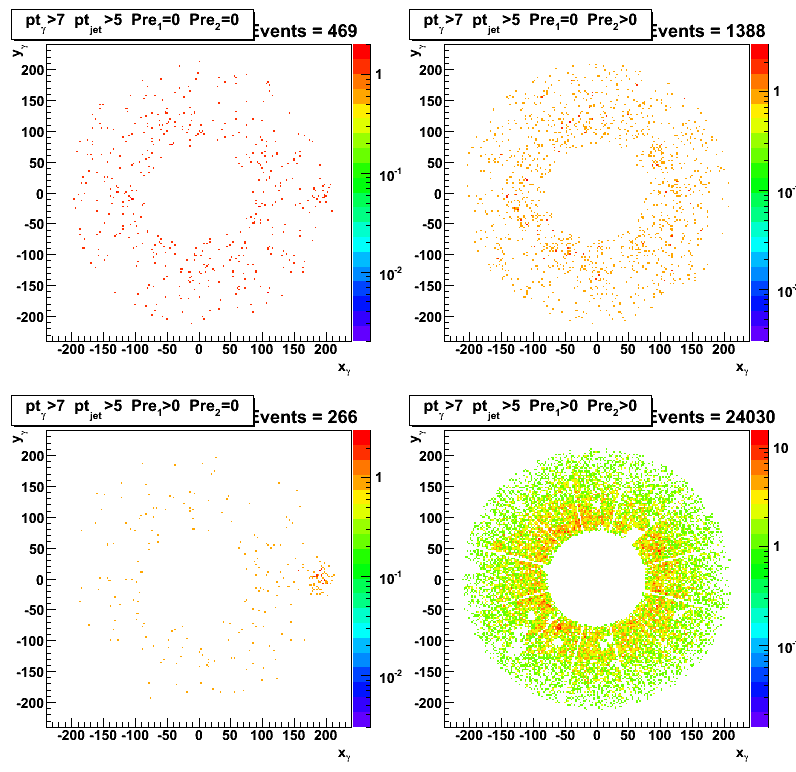
Figure 3b:y:x EEMC position for gamma-jet candidates:
pp2006 (long) data [eemc-http-mb-l2gamma:137641 trigger]
pt cut of 7 GeV for gamma and 5GeV for the away side jet has been applied.
high u vs. v strip for gamma-jet candidates
Figure 4:High v-strip vs high u-strip.
Pythia gamma-jet sample (~170K events). Partonic pt range 5-35 GeV.
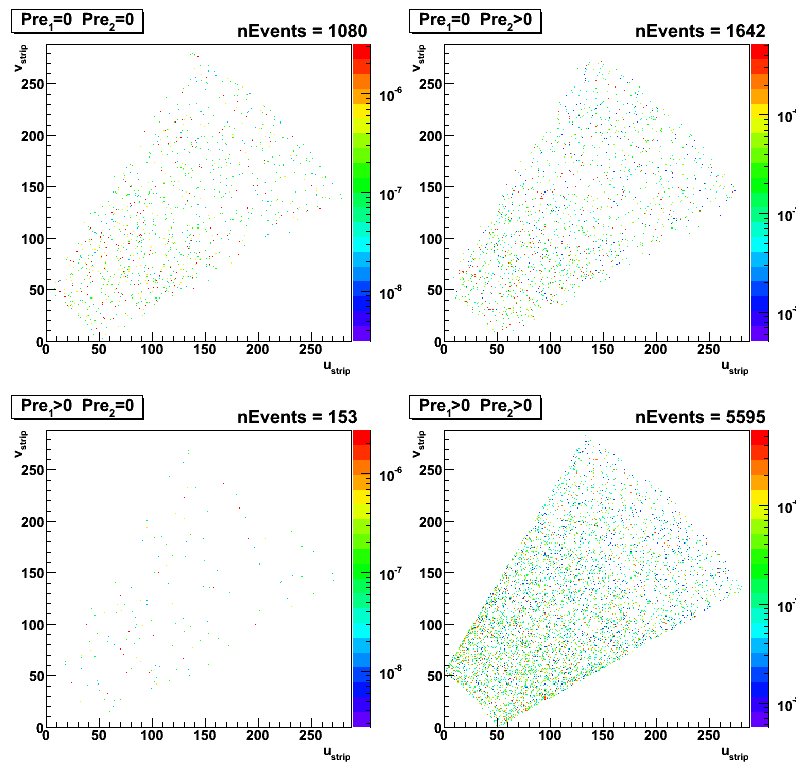
Figure 5:High v-strip vs high u-strip:
Pythia QCD bg sample (~4M events). Partonic pt range 3-65 GeV.
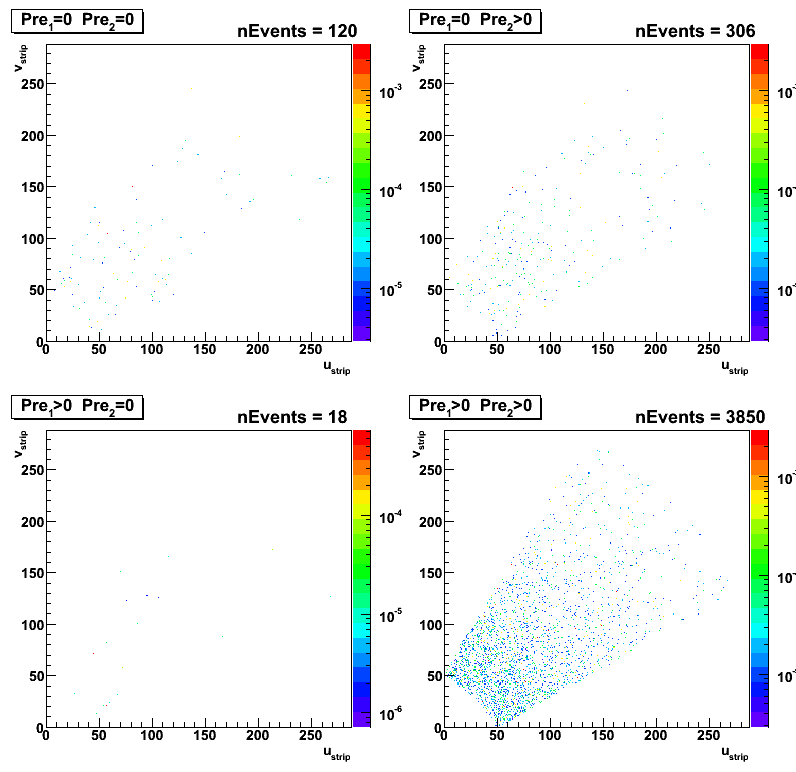
Figure 6:High v-strip vs high u-strip:
pp2006 (long) data [eemc-http-mb-l2gamma:137641 trigger]
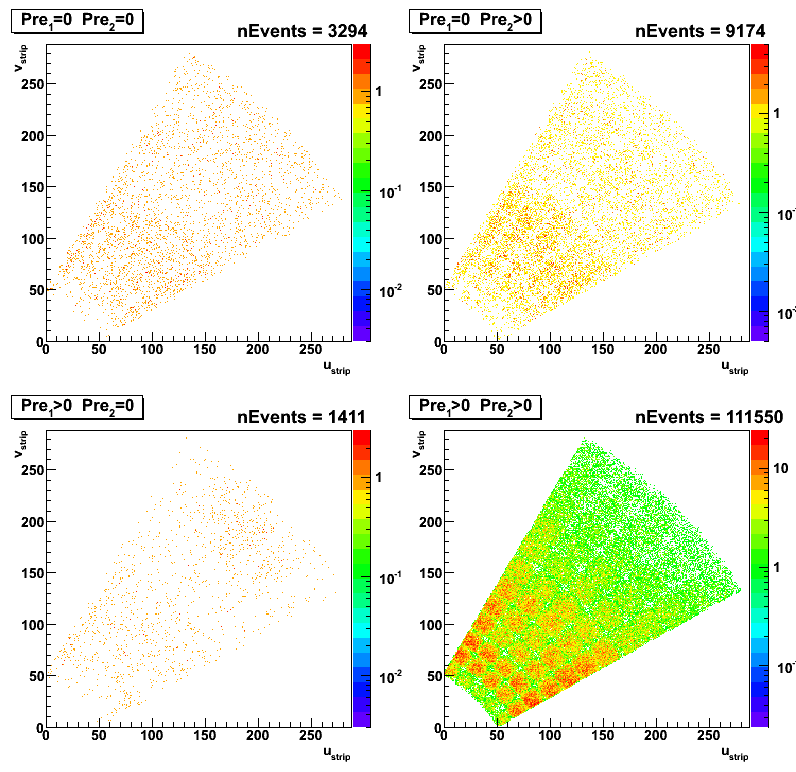
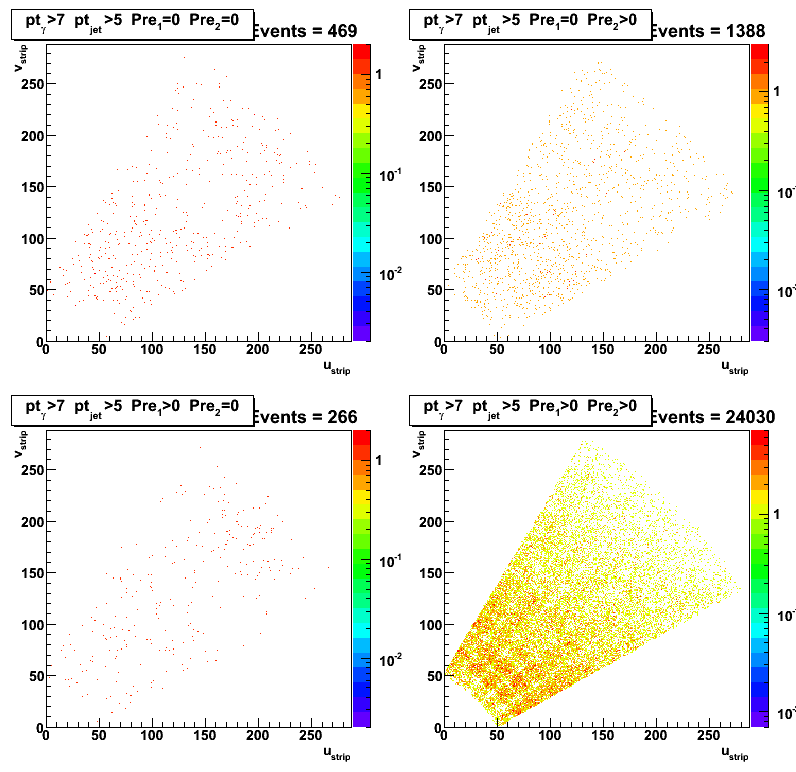
Figure 6b:High v-strip vs high u-strip:
pp2006 (long) data [eemc-http-mb-l2gamma:137641 trigger]
pt cut of 7 GeV for gamma and 5GeV for the away side jet has been applied.
2008.05.09 Gamma-jet candidates pt-distributions and TPC tracking
Ilya Selyuzhenkov May 09, 2008
Detector eta cut study (1< eta < 1.4):
-
For a three data samples (pp2006 [long], MC gamma-jet, and MC QCD background events)
the EEMC detector eta cut of 1< eta < 1.4 has been applied. -
Although a poor statistics available for MC background QCD sample,
the signal to background ratio (red to green line ratio)
getting closer to 1:3 (expected signal to background ratio from Les study).
Figure 1:Gamma pt distribution. MC data are scaled to the same luminosity as data
(Normalization factor: Luminosity * sigma / N_events).
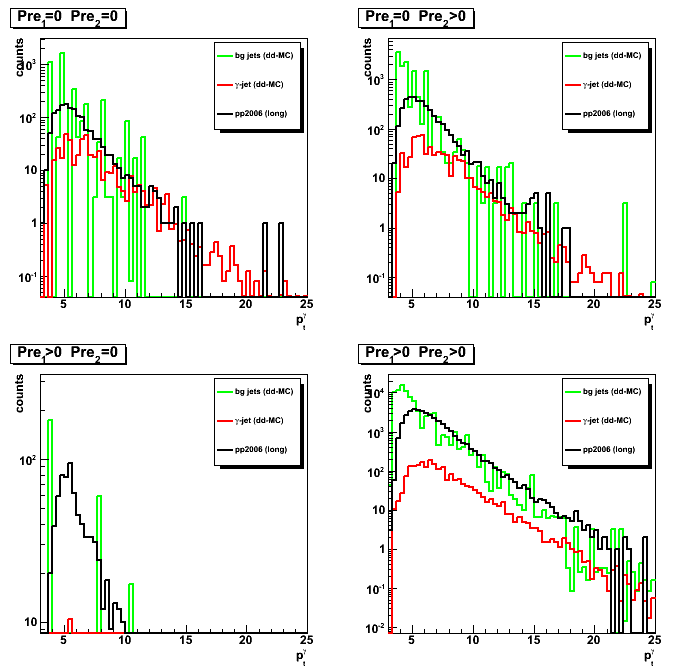
Figure 2:Gamma yield vs pt. MC data are scaled to the same luminosity as data.
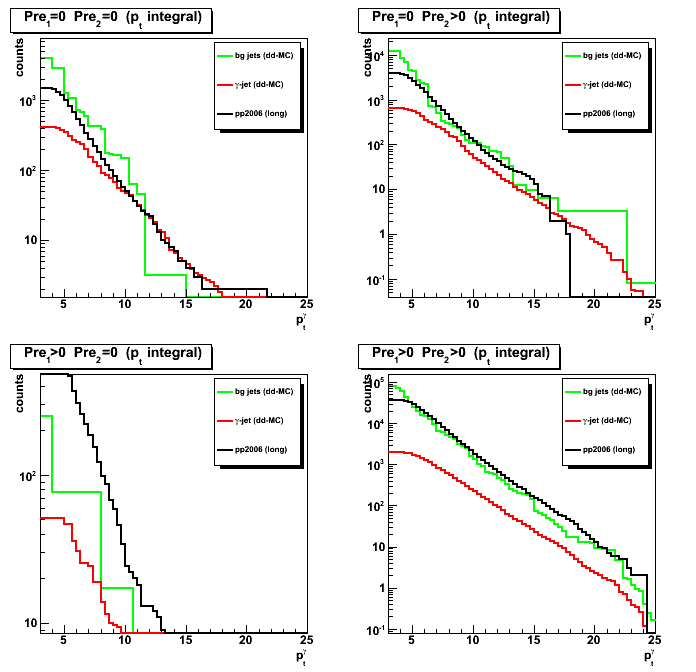
Figure 3:Signal to background ratio (MC results are normalized to the data)
2008.05.14 Gamma-cluster to jet energy ratio and away side jet pt matching
Ilya Selyuzhenkov May 14, 2008
Gamma-cluster to jet1 energy ratio
-
Correlation between gamma-candidate 3x3 cluster energy ratio (R_cluster) and
number of EEMC towers in a jet1 can be found here (Fig. 4). -
Gamma pt distribution, yield and signal to background ratio plots
for a cut of R_cluster >0.9 can be found here (Figs. 1-3). -
Gamma pt distribution, yield and signal to background ratio plots
for a cut of R_cluster >0.99 are shown below in Figs. 1-3.
One can see that by going from R_cluster>0.9 to R_cluster>0.99
improves signal to background ratio from ~ 1:10 to ~ 1:5 for gamma pt>10 GeV
Figure 1:Gamma pt distribution for R_cluster >0.99.
MC results scaled to the same luminosity as data
(Normalization factor: Luminosity * sigma / N_events).
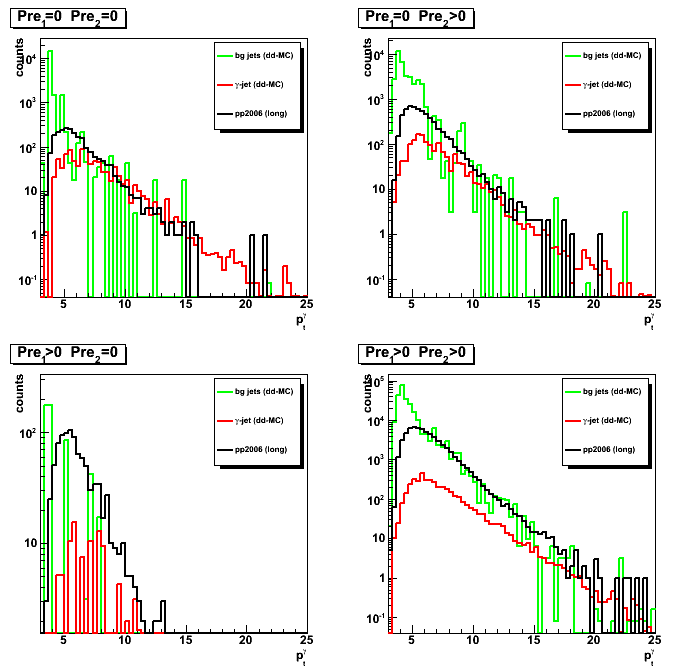
Figure 2:Integrated gamma yield vs pt for R_cluster >0.99
For each pt bin yield is defined as the integral from this pt up to the maximum available pt.
MC results scaled to the same luminosity as data.
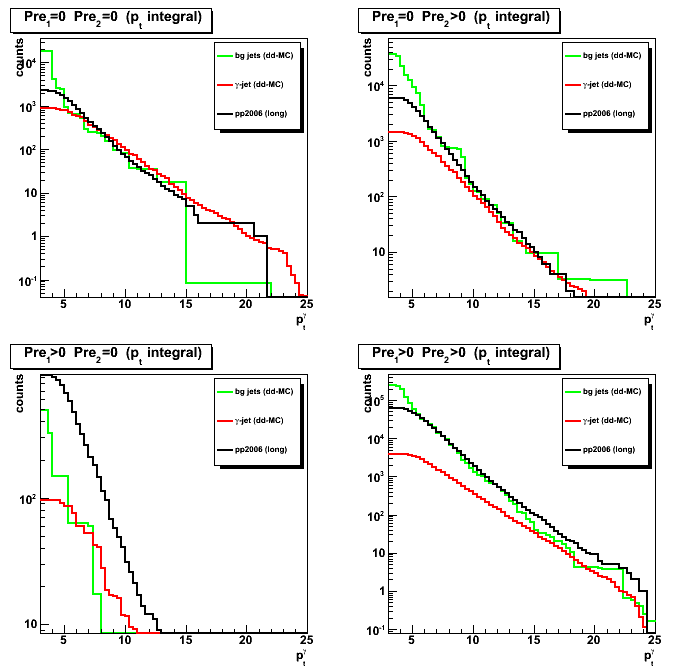
Figure 3:Signal to background ratio for R_cluster >0.99 (all results divided by the data)
Compare this figure with that for R_cluster>0.9 (Fig. 3 at this link)
Gamma and the away side jet pt matching
Figure 4: pt asymmetry between gamma and the away side jet (R_cluster >0.9)
for a three data samples (pp2006[long] data, gamma-jet MC, QCD jets background).
pt cut of 7 GeV for both gamma and jet has been applied.
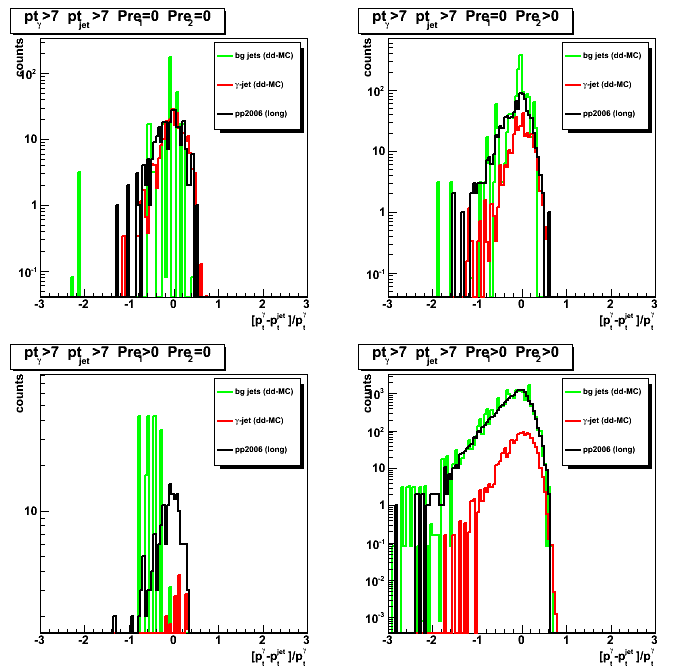
Figure 5: signal to background ratio (R_cluster >0.9)
as a function of pt asymmetry between gamma and the away side jet
pt cut of 7 GeV for both gamma and jet has been applied.
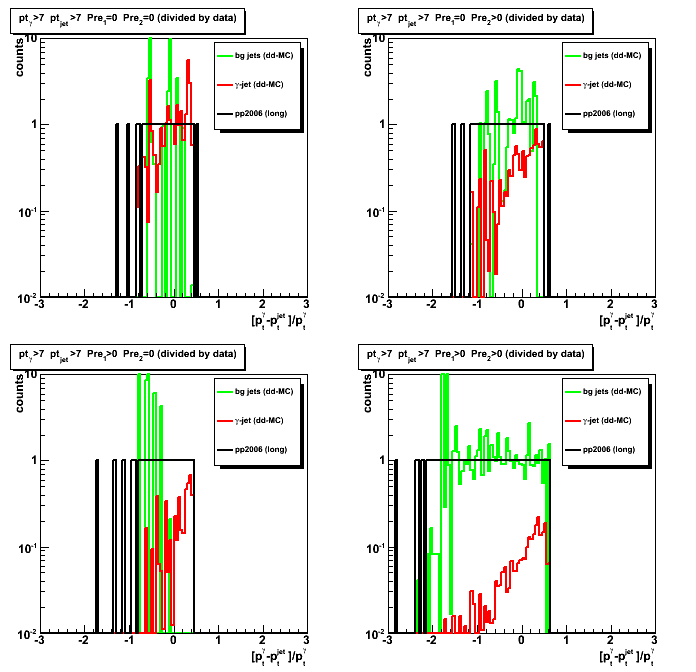
Figure 6: pt asymmetry between gamma and the away side jet (R_cluster >0.99)
for a three data samples (pp2006[long] data, gamma-jet MC, QCD jets background).
pt cut of 7 GeV for both gamma and jet has been applied.
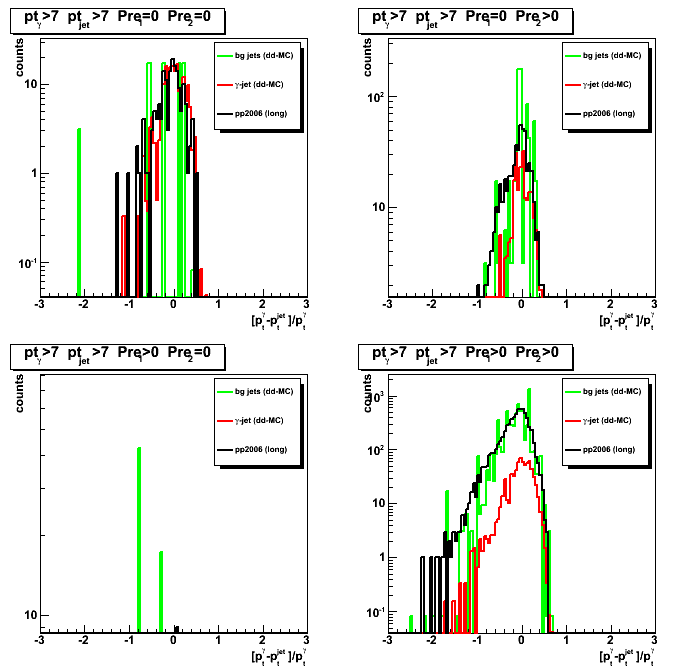
Figure 7: signal to background ratio
as a functio of pt asymmetry between gamma and the away side jet (R_cluster >0.99)
pt cut of 7 GeV for both gamma and jet has been applied.
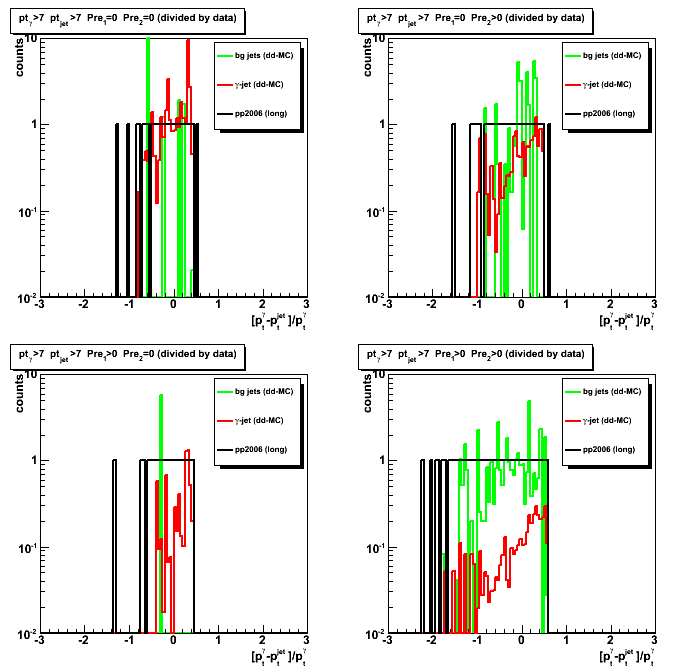
Figure 8: pt asymmetry between gamma and the away side jet (R_cluster >0.99)
for a three data samples (pp2006[long] data, gamma-jet MC, QCD jets background).
pt cut of 7 GeV for gamma and 5GeV for the away side jet has been applied.
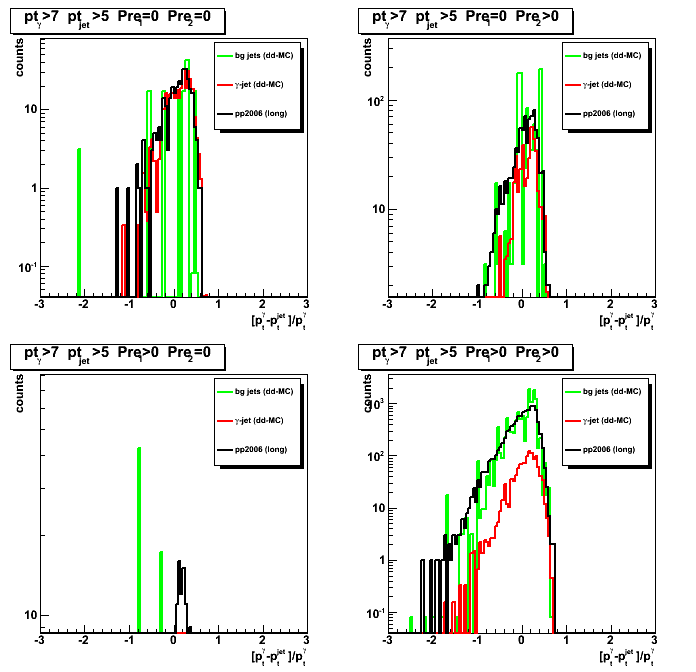
Figure 9: signal to background ratio
as a function of pt asymmetry between gamma and the away side jet (R_cluster >0.99)
pt cut of 7 GeV for gamma and 5GeV for the away side jet has been applied.
2008.05.15 Vertex z distribution for pp2006 data, MC gamma-jet and QCD jets events
Ilya Selyuzhenkov May 15, 2008
Figure 1:Vertex z distribution for pp2006 (long) data [eemc-http-mb-l2gamma:137641 trigger]
Note: In the upper right plot (pre1=0, pre2>0) one can see
a hole in the acceptance in the range bweeeen z_vertex -10 to 30 cm (probably due to SVT construction)
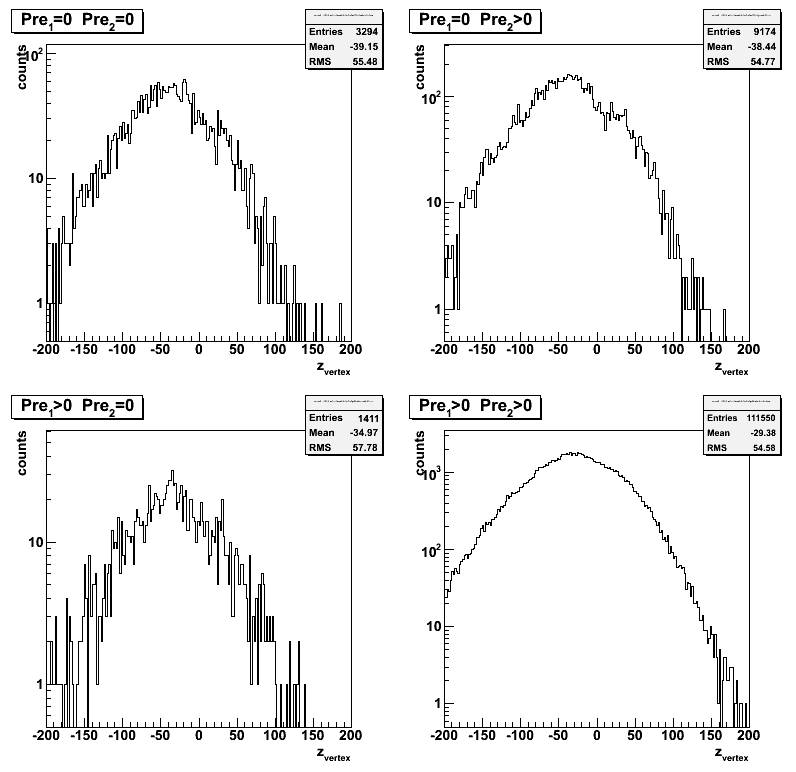
Figure 1b:Vertex z distribution for pp2006 (same as Fig. 1, but on a linear scale)
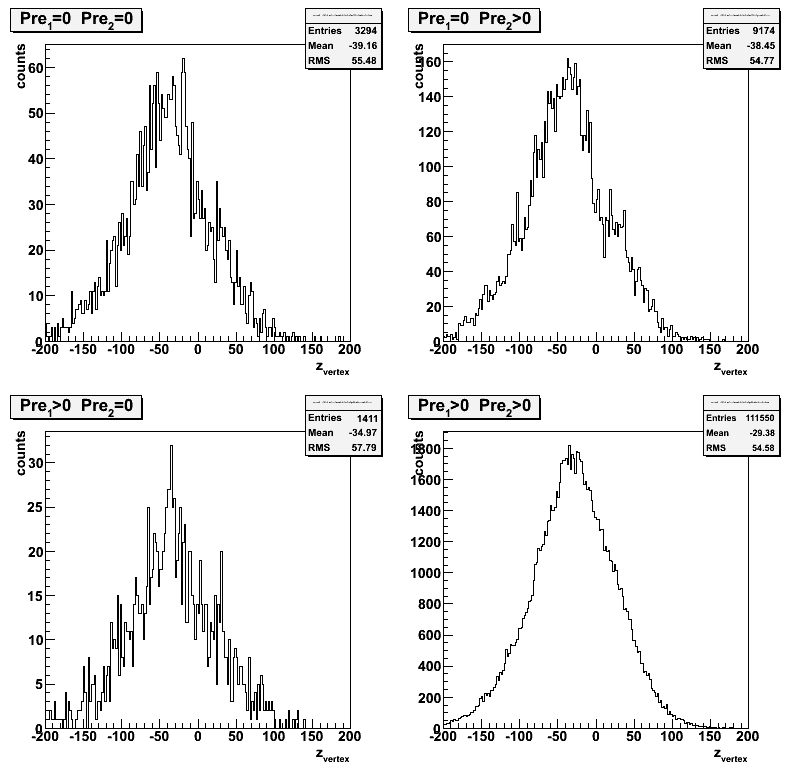
Figure 2:Vertex z distribution for three different data samples
MC results scaled to the same luminosity as data
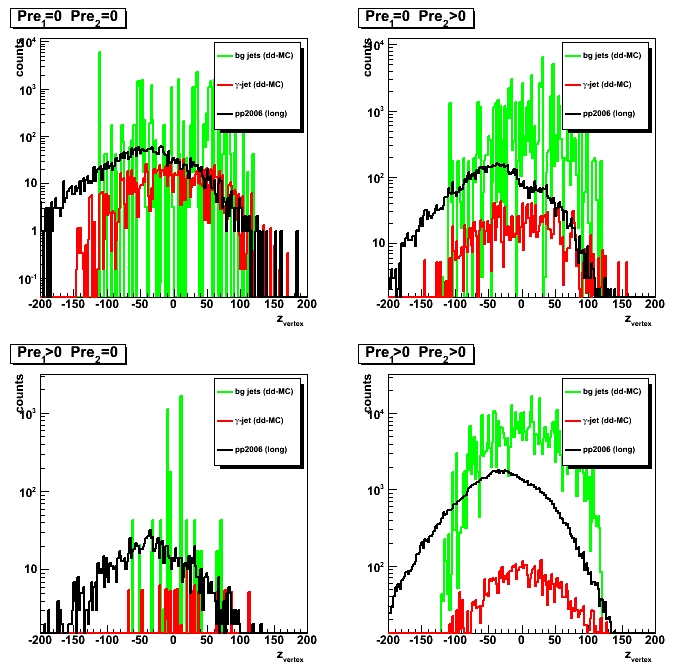
Figure 3:Vertex z distribution for three different data samples
pt cut of 7 GeV for gamma and 5GeV for the away side jet has been applied.

2008.05.20 Shower shapes sorted by pre-shower, z-vertex and gamma's eta, phi, pt
Ilya Selyuzhenkov May 20, 2008
Gamma-jet algorithm and isolation cuts:
-
Selecting only di-jet events identified by the STAR jet finder algorithm,
with jets pointing opposite in azimuth:
cos(phi_jet1 - phi_jet2) < -0.8 - Select jet1 with a maximum neutral energy fraction (R_EM1).
This is our gamma candidate, for which we further require:- No charge tracks associated with jet1 (default jet radius is 0.7):
nChargeTracks_jet1 = 0
Note, that this charge track veto only works
in the EEMC region where we do have TPC tracking - No barrel towers associated with jet1 (pure EEMC jet):
nBarrelTowers_jet1 = 0 - Ratio of the energy in the 3x3 EEMC high tower cluster
to the total jet energy to be:
R_cluster>0.99 (previous, softer, cut was 0.9)
- No charge tracks associated with jet1 (default jet radius is 0.7):
- For the second jet2 (away side jet) we require:
- That jet2 has at least ~10% of hadronic energy:
R_EM2<0.9
- That jet2 has at least ~10% of hadronic energy:
- Additional gamma candidate QA requirements:
- Matching between EEMC SMD uv-strip cluster with a 3x3 cluster of EEMC towers.
(in addition reject events for which we can not idetify uv-strip intersection) - Minimum number of strips in 5-strip EEMC SMD uv-plane clusters to be greater that 3.
- Matching between EEMC SMD uv-strip cluster with a 3x3 cluster of EEMC towers.
Data sample:
- pp2006(long) - 2006 pp production longitudinal data after applying gamma-jet isolation cuts
(note the new R_cluster>0.99 cut)
Shower shapes sorted by pre-shower, z-vertex and gamma's eta, phi, pt
Note, that all shapes are normalized at peak to unity
Figure 1:Shower shapes for different detector eta bins
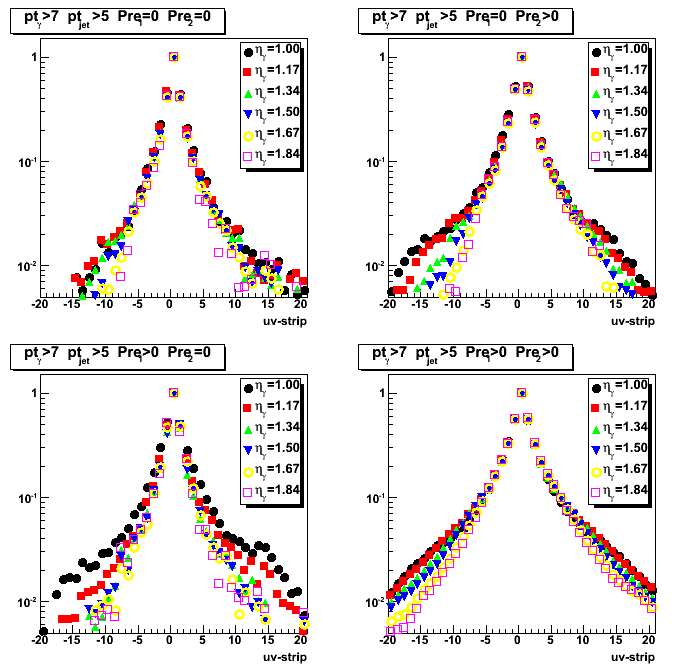
Figure 2:Shower shapes for different detector phi bins
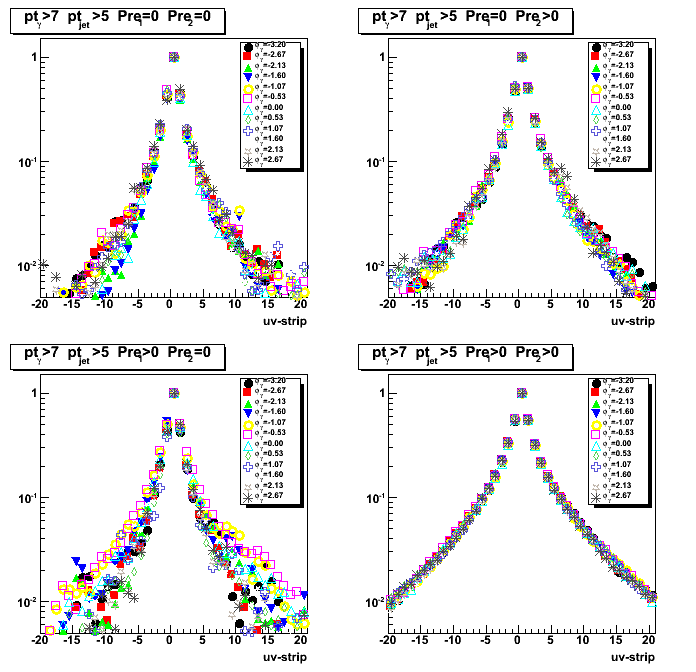
Figure 3:Shower shapes for different gamma pt bins
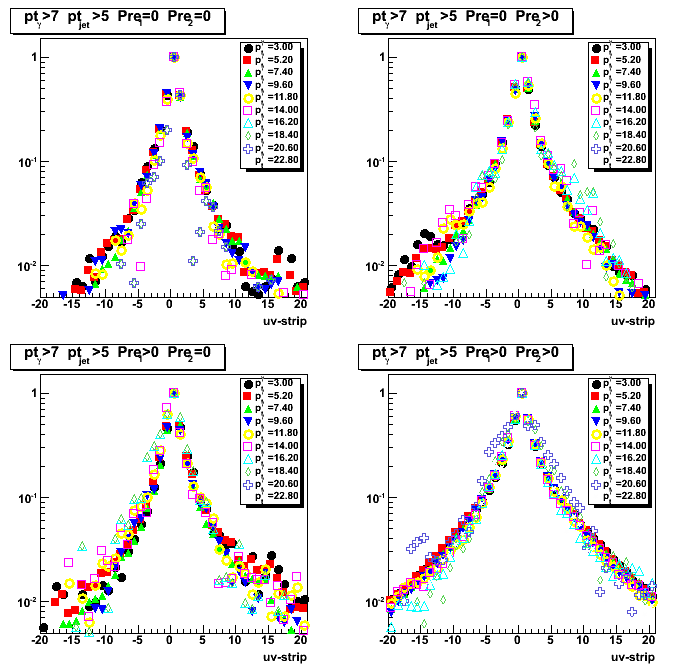
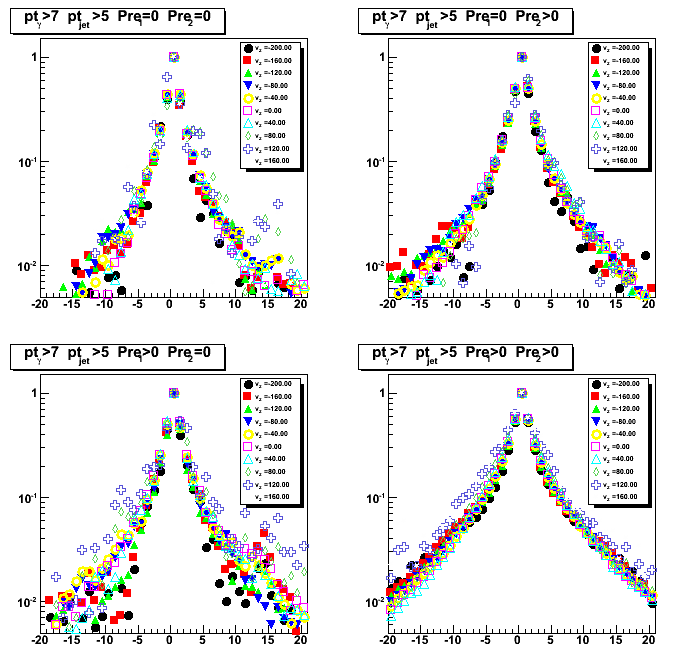
Figure 4:Shower shapes for different z-vertex bins
2008.05.21 EEMC SMD data-driven library: some eta-meson QA plots
Ilya Selyuzhenkov May 21, 2008
EEMC SMD data-driven library: some eta-meson QA plots
Data sample:
-
Subset of 441 eta-meson candidates from Will's analysis.
-
additional QA info (detector eta, pre1, pre2, etc)
has been added to pi0-tree reader script:
/star/institutions/iucf/wwjacobs/newEtas_fromPi0finder/ReadEtaTree.C -
pi0 trees from this RCF directory has been used to regenerate etas NTuple:
/star/institutions/iucf/wwjacobs/newEtas_fromPi0finder/out_23/
Some observations:
-
eta-meson purity within the invariant mass region [0.5, 0.65] is about 72%
-
Most of the eta-candidates has detector pseudorapidity less or about 1.4,
what may limits applicability of data-driven shower shapes
derived from these candidates for higher pseudo-rapidity region,
where we have most of the background for the gamma-jet
analysis due to lack of TPC tracking -
z-vertex distribution is very asymmetric, and peaked around -50cm.
Only a few candidates has a positive z-vertex values.
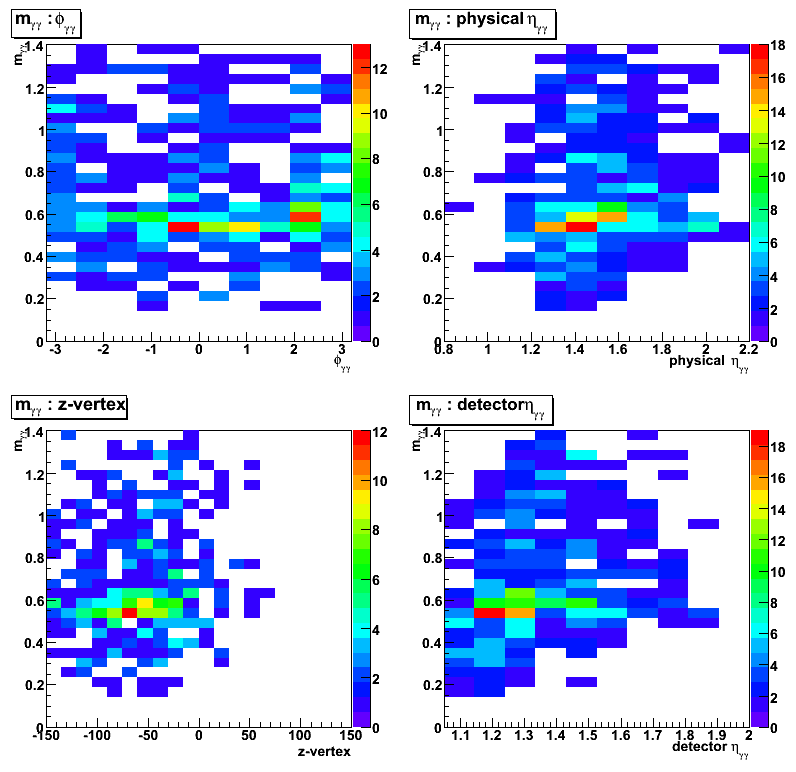
Figure 1: Eta-meson invariant mass with signal and background fits and ratio (upper left).
Pseudorapidity [detector and wrt vertex] distributions (right top and bottom plots),
vertex z distributions (bottom left)
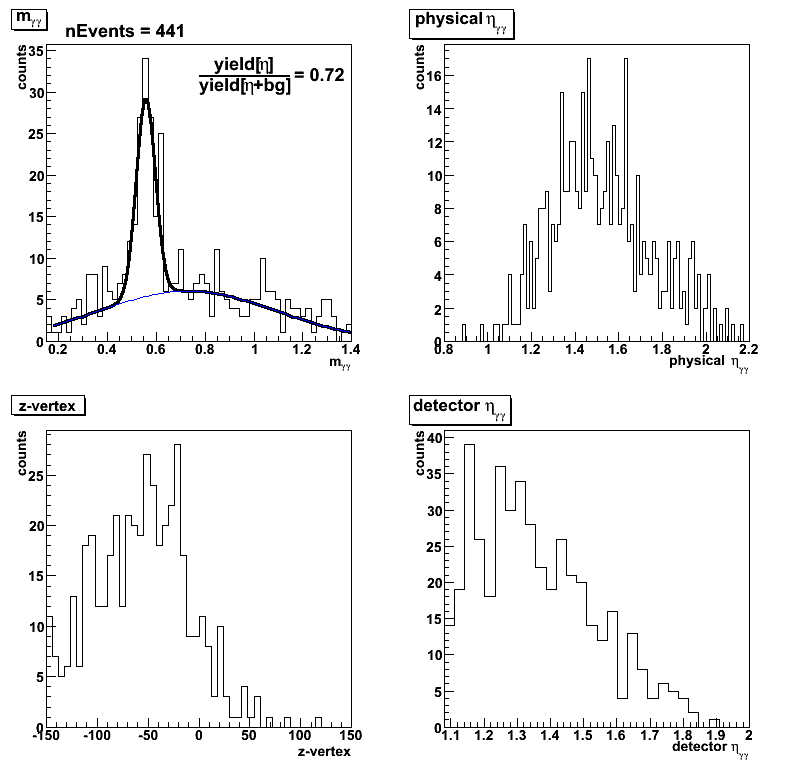
Figure 2:2D plots for the eta-meson invariant mass vs
azimuthal angle (upper left), pseudorapidity (upper right),
z-vertex (bottom right), and detector pseudorapidity (bottom right)
2008.05.27 Shower shapes: pp2006 data, MC gamma-jet and QCD jets, gammas from eta
Ilya Selyuzhenkov May 27, 2008
Shower shapes and triple Gaussian fits for gammas from eta-meson
Figure 1: Shower shapes and triple Gaussian fits for photons from eta-meson
sorted by different conditions of EEMC 1st and 2nd pre-shower layers.
Note: All shapes have been normalized at peak to unity
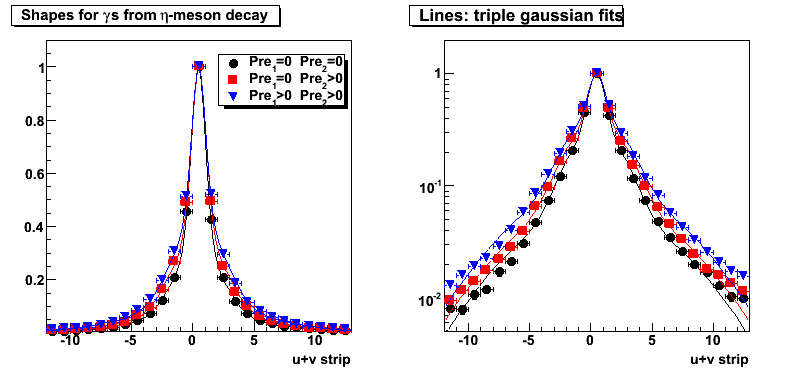
Triple Gaussian fit parameters:
Pre1=0 Pre2=0
0.669864*exp(-0.5*sq((x-0.46016)/0.574864))+0.272997*exp(-0.5*sq((x-0.46016)/-1.84608))+0.0585682*exp(-0.5*sq((x-0.46016)/5.49802))
Pre1=0 Pre2>0
0.0694729*exp(-0.5*sq((x-0.493468)/5.65413))+0.615724*exp(-0.5*sq((x-0.493468)/0.590723))+0.314777*exp(-0.5*sq((x-0.493468)/2.00192))
Pre1>0 Pre2>0
0.0955638*exp(-0.5*sq((x-0.481197)/5.59675))+0.558661*exp(-0.5*sq((x-0.481197)/0.567596))+0.345896*exp(-0.5*sq((x-0.481197)/1.9914))
Shower shapes: pp2006, MC gamma-jet and QCD jets, gammas from eta
Shower shapes comparison between different data sets:
- gammas from eta-meson decay. Obtained from Will's eta-meson analysis
- pp2006 - STAR 2006 pp longitudinal data (~ 3.164 pb^1) after applying gamma-jet isolation cuts.
- gamma-jet - data-driven Pythia gamma-jet sample (~170K events). Partonic pt range 5-35 GeV.
- QCD jets - data-driven Pythia QCD jets sample (~4M events). Partonic pt range 3-65 GeV.
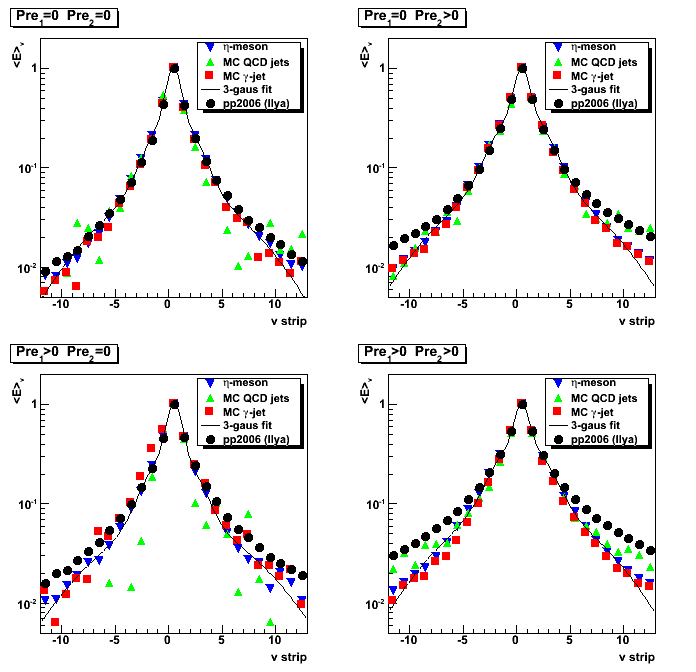
Some observations:
-
Shapes for gammas from eta-meson decay
are in a good agreement with those from MC gamma-jet sample
(compare red squares with blue triangle in Fig. 2 and 3).MC gamma-jet shapes obtained by running a full gamma-jet reconstruction algorithm,
and this agreement indicates that we are able to reconstruct gamma shapes
which we put in with data-driven shower shape library. -
MC gamma-jet shapes match pp2006 data shapes
for pre1=0 condition, where we expect to be very efficient in background rejection
(compare red squares with black circles in upper plots of Fig. 2 and 3).This indicates that we are able to reproduce EEMC SMD of direct photons with data-driven Monte-Carlo.
-
There is no match between Monte-Carlo QCD background jets and pp2006 data
for the case when both pre-shower layer fired (pre1>0 and pre2>0).
(compare green triangles with black circes in bottom right plots of Fig.2 and 3).
This is the region where we know background dominates our gamma-jet candidates.This shows that we still do not reproduce SMD response for our background events
in our data-driven Monte-Carlo simulations
(note, that in Monte-Carlo we replace SMD response with real shapes for all background photons
the same way we do it for direct gammas).
Figure 2: Shower shapes comparison between different data sets.
Shapes for gamma-jet candidates obtained with the same gamma-jet reconstruction algorithm
for three different data samples (pp2006, gamma-jet and QCD jets MC).
pt cuts of 7GeV for the gamma and of 5 GeV for the away side jet have been applied.
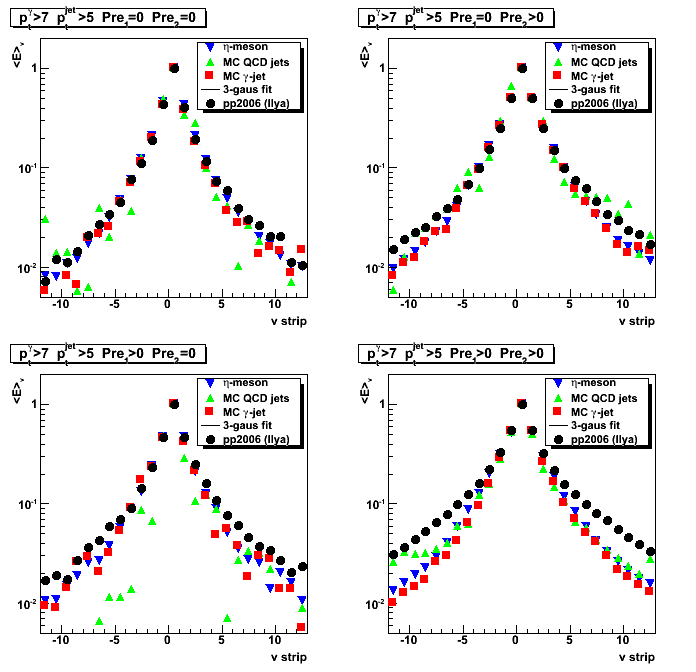
Figure 3:Same as Fig. 2, but with no cuts on gamma and jet pt.
All shapes are similar to those in Fig. 2 with an additional pt cuts.
Note, that blue triangles are the same as in Fig. 2.
2008.05.30 Eta, phi, and pt distributions for gamma and jet from MC and pp2006 data
Ilya Selyuzhenkov May 30, 2008
Three data sets:
- pp2006 - STAR 2006 pp longitudinal data (~ 3.164 pb^1) after applying gamma-jet isolation cuts.
- gamma-jet - data-driven Pythia gamma-jet sample (~170K events). Partonic pt range 5-35 GeV.
- QCD jets - data-driven Pythia QCD jets sample (~4M events). Partonic pt range 3-65 GeV.
Figure 1: Gamma eta distribution.
pt cuts of 7GeV for the gamma and of 5 GeV for the away side jet have been applied.
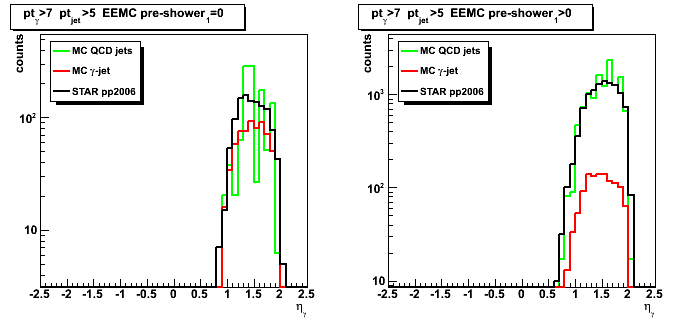
Figure 2: Gamma pt distribution.
pt cuts of 7GeV for the gamma and of 5 GeV for the away side jet have been applied.
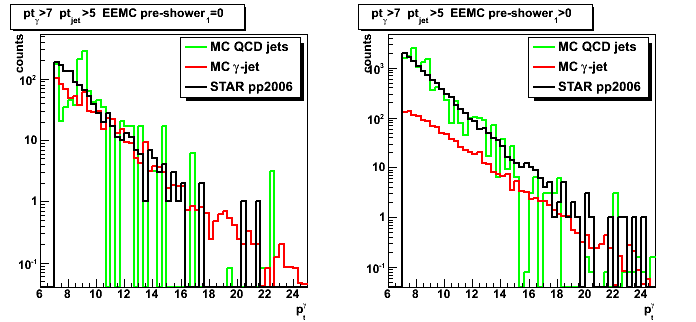
Figure 3: Gamma phi distribution.
pt cuts of 7GeV for the gamma and of 5 GeV for the away side jet have been applied.
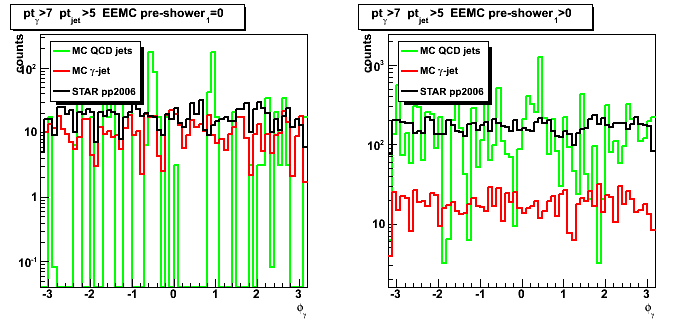
Figure 4: Away side jet eta distribution.
pt cuts of 7GeV for the gamma and of 5 GeV for the away side jet have been applied.
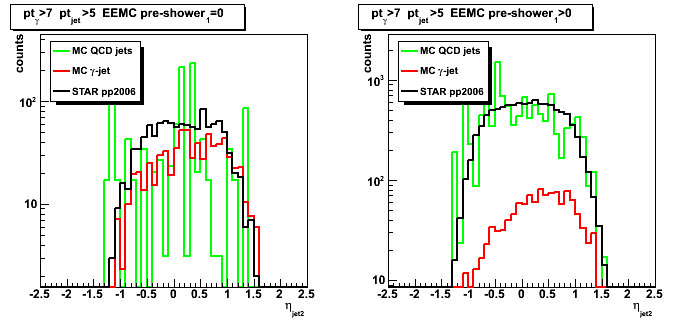
Figure 5: Away side jet pt distribution.
pt cuts of 7GeV for the gamma and of 5 GeV for the away side jet have been applied.
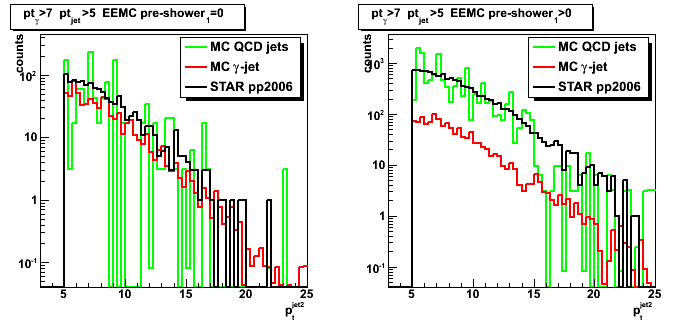
Figure 6: Gamma-jet delta pt distribution.
pt cuts of 7GeV for the gamma and of 5 GeV for the away side jet have been applied.
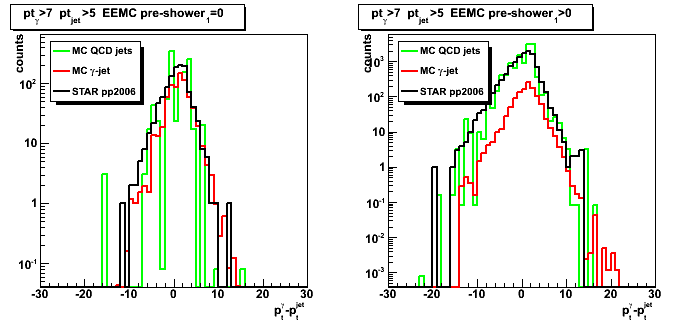
Figure 7: Gamma-jet delta eta distribution.
pt cuts of 7GeV for the gamma and of 5 GeV for the away side jet have been applied.
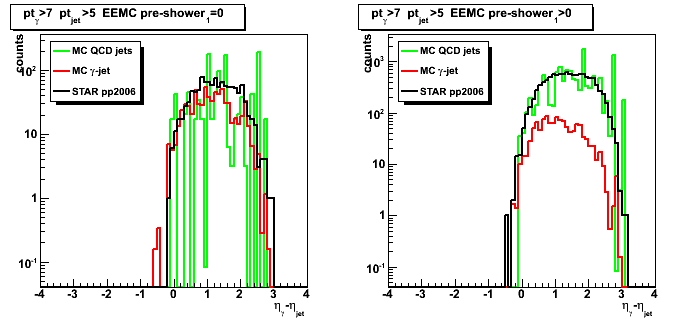
Figure 8: Gamma-jet delta phi distribution.
pt cuts of 7GeV for the gamma and of 5 GeV for the away side jet have been applied.
