2008.03.26 Sided residual and chi2 distribution for gamma-jet candidates (pre1,2 sorted)
Ilya Selyuzhenkov March 26, 2008
gamma-jet candidates (no pt cut)
Definitions:
- F_peak - integral for a fit within [-2,2] strips around SMD u/v peak
- D_peak - integral over the data within [-2,2] strips around SMD u/v peak
- D_tail^max (D_tail^min) - maximum (minimum) integral over the data tail within +-[3,30] strips from a SMD u/v peak
- F_tail is the integral over the fit tail within [3,30] strips from a SMD u/v peak.
- Maximum residual = D_tail^max - F_tail
All results are for combined distributions from u and v planes: ([u]+[v])/2
Gamma-jet isolation cuts described here
Additional quality cuts:
- Matching between 3x3 tower cluster and u-v high strip intersection
- At least 4 strips fired within [-2,2] strips from a peak
Figure 1: F_peak vs maximum residual
for various cuts on energy deposited in the EEMC pre-shower 1 and 2
(within a 3x3 clusters around tower with a maximum energy).
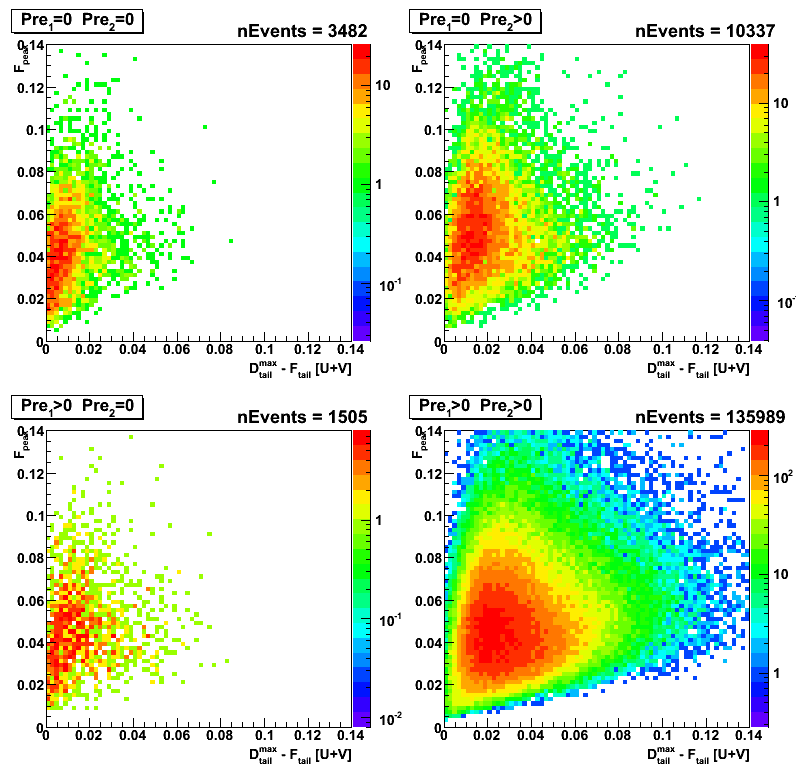
Figure 2: F_data vs D_tail^max
Note:This plot is fit independend (only the peak position is defined based on the fit)
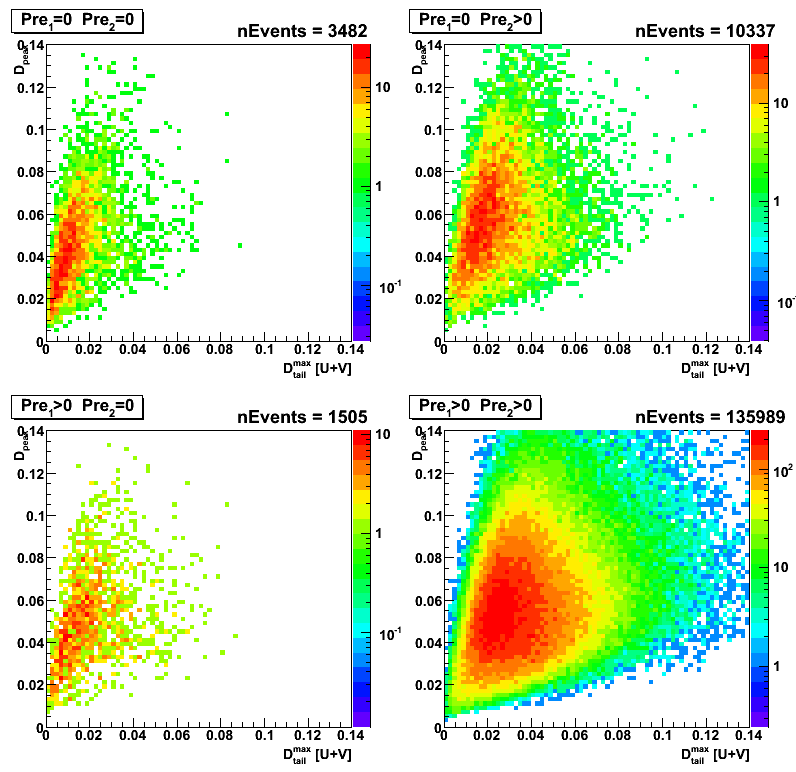
Figure 3: F_data vs D_tail^max-D_tail^max
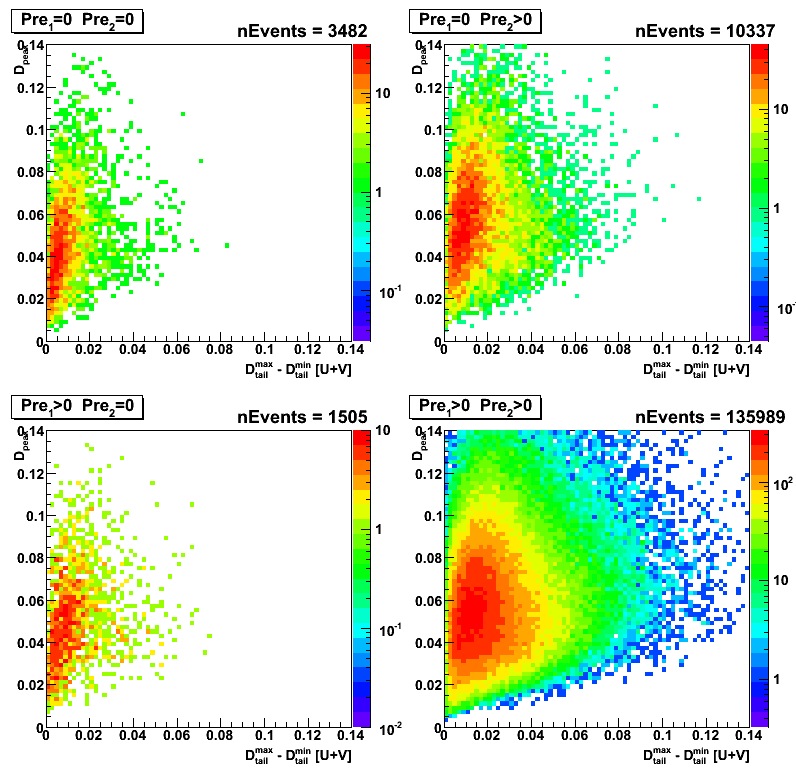
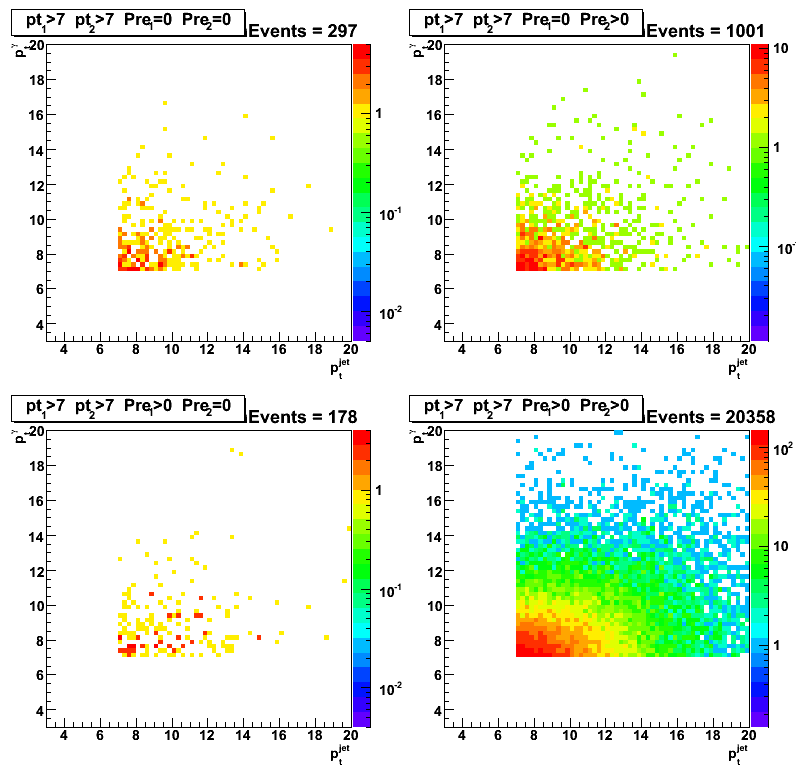
Figure 4: Gamma transverse momentum vs jet transverse momentum
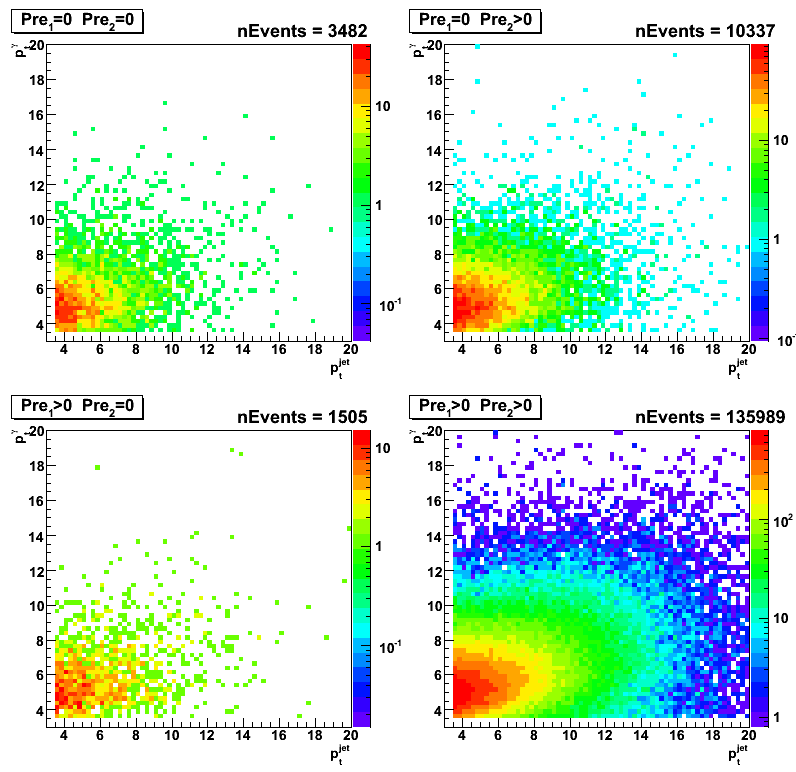
gamma-jet candidates: pt > 7GeV
Figure 5: F_peak vs maximum residual
for various cuts on energy deposited in the EEMC pre-shower 1 and 2
(within a 3x3 clusters around tower with a maximum energy).
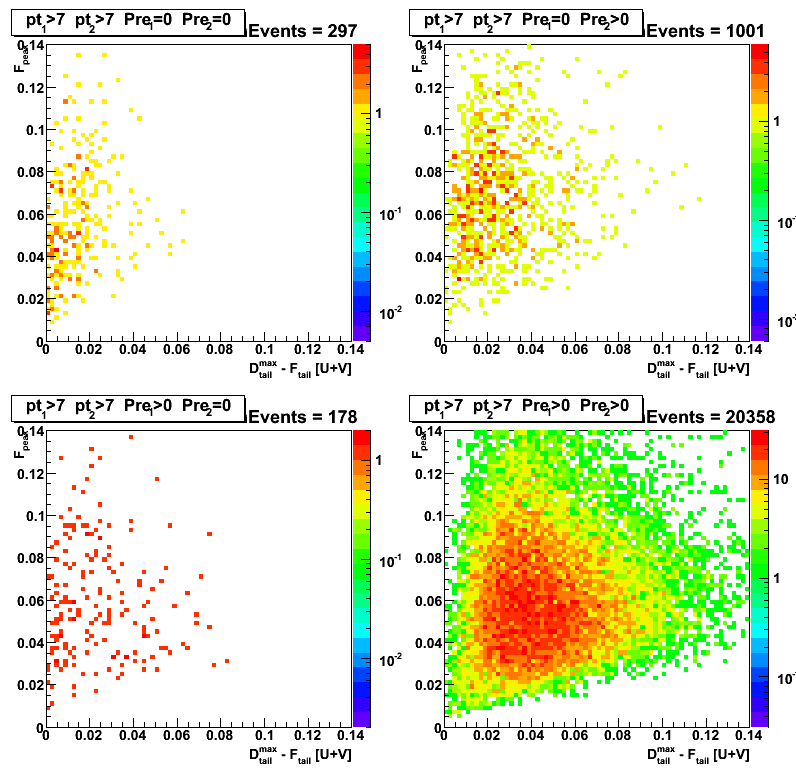
Figure 6: F_data vs D_tail^max
Note:This plot is fit independend (only the peak position is defined based on the fit)
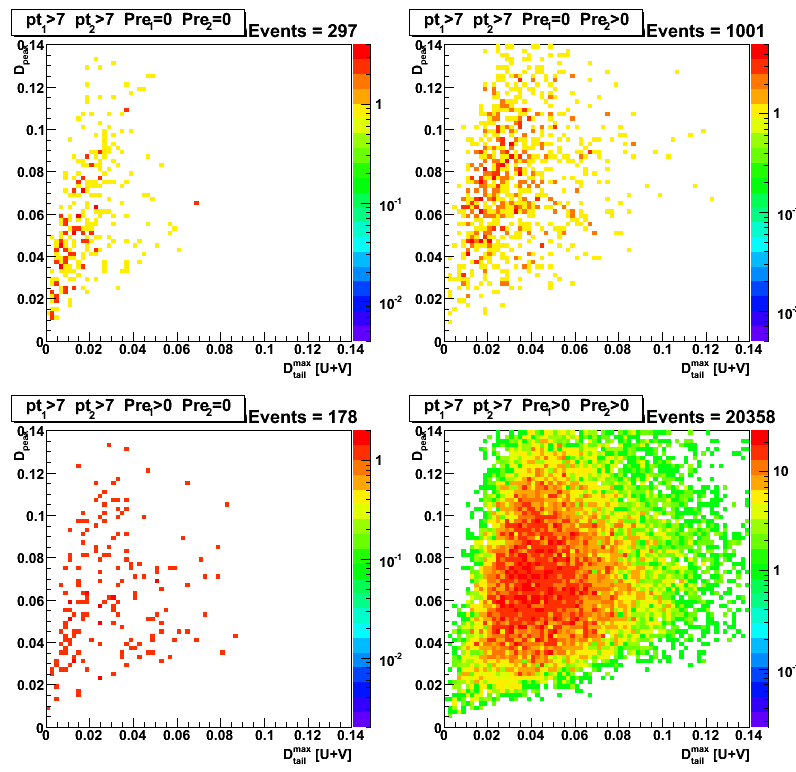
Figure 7: F_data vs D_tail^max-D_tail^max
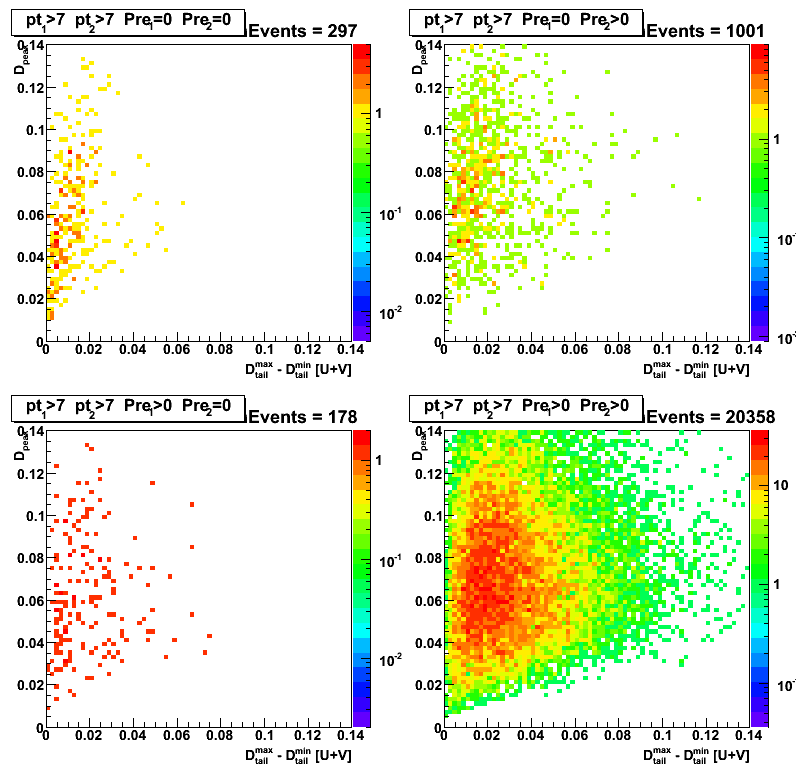
Figure 8: Gamma transverse momentum vs jet transverse momentum
gamma-jet candidates: eta, phi, and max[u,v] strip distributions (no pt cuts)
Figure 9: Gamma pseudorapidity vs jet pseudorapidity
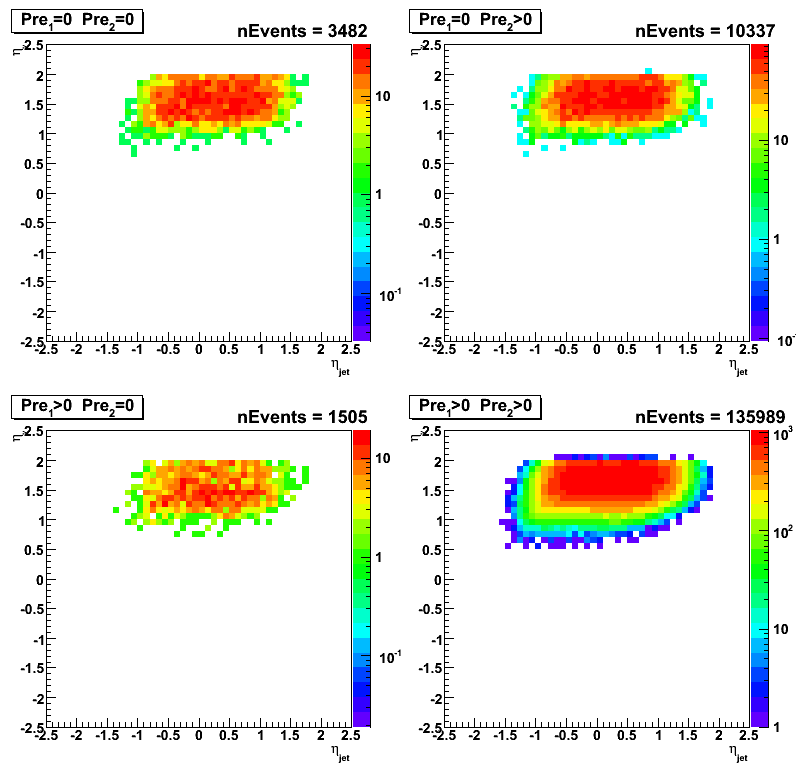
Figure 10: Gamma azimuthal angle vs jet azimuthal angle
Note: for the case of Pre1>1 && Pre2==0 there is an enhancement around phi_gamma = 0?
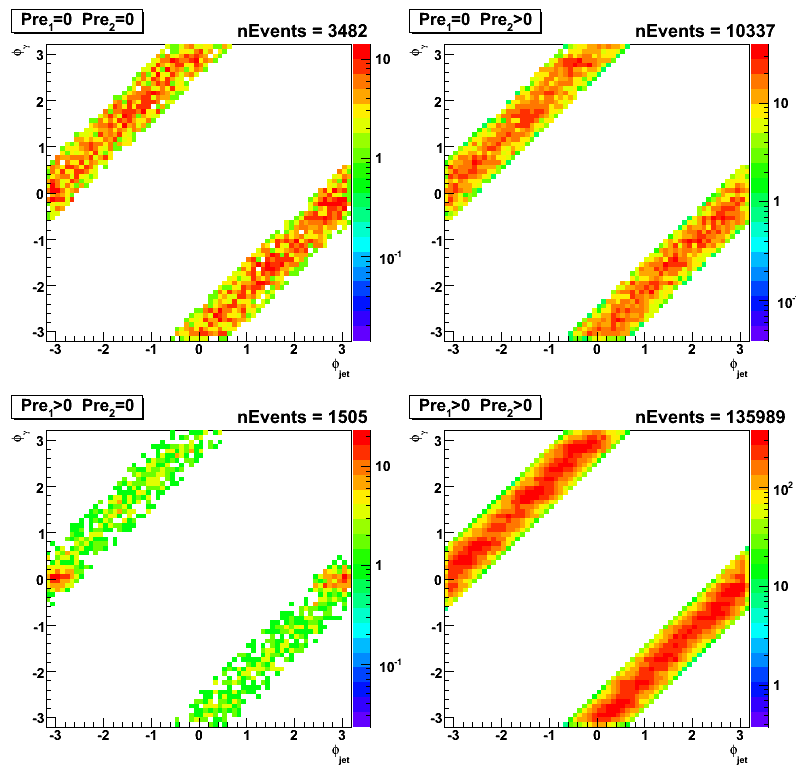
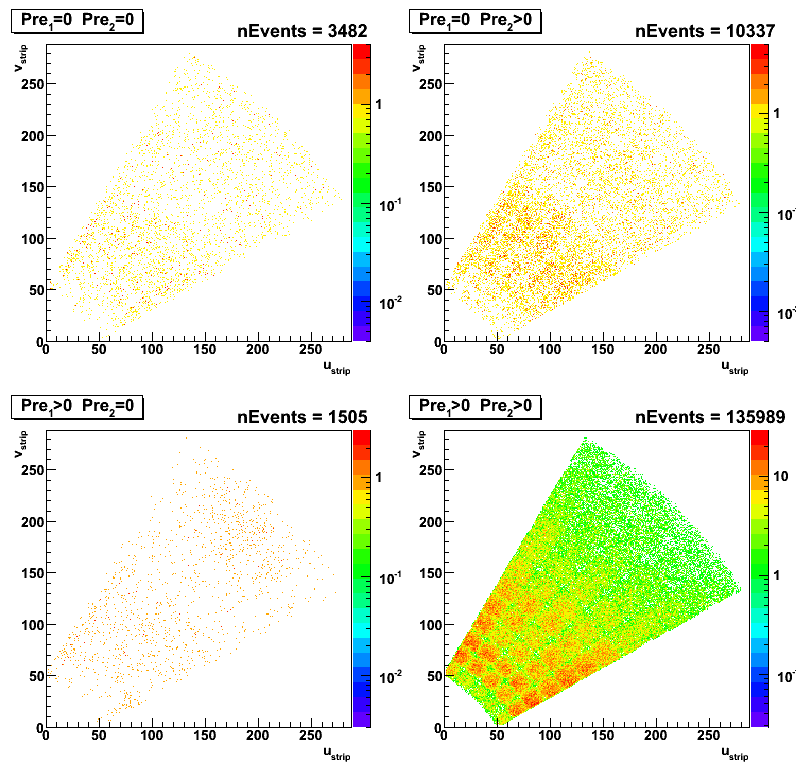
Figure 11: maximum strip in v-plane vs maximum strip in u-plane
Chi2 distribution for gamma-jet candidates (no pt cuts)
Figure 12:Chi2/ndf for gamma-jet candidates using Monte Carlo shape (combined for [u+v]/2 plane )
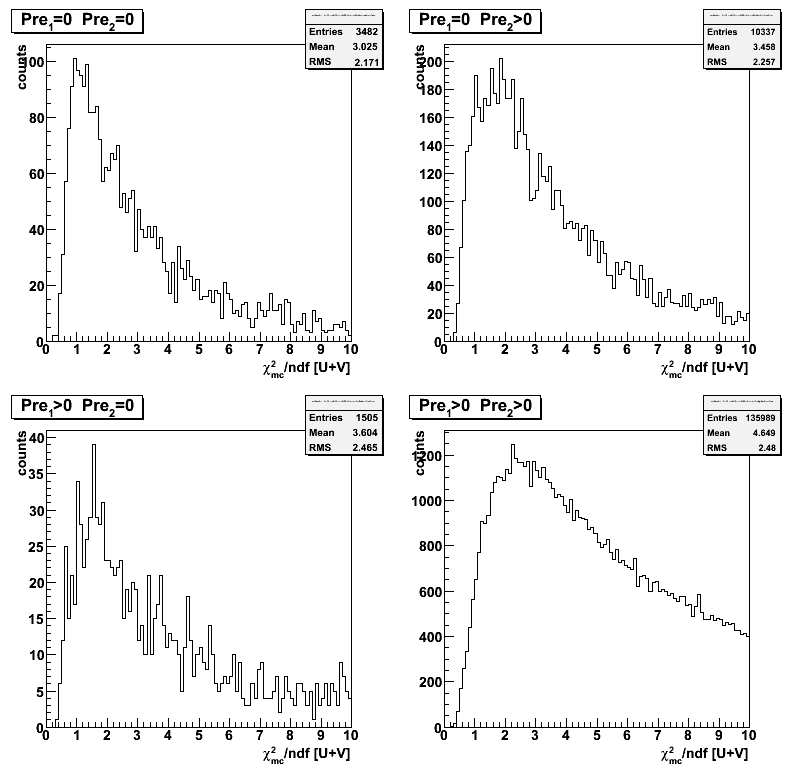
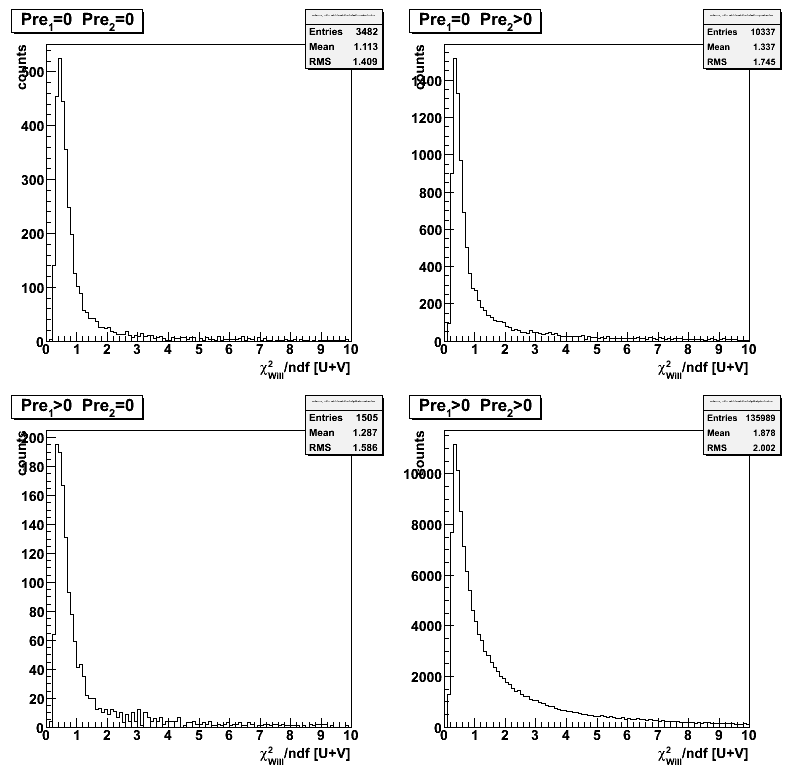
Figure 13:Chi2/ndf for gamma-jet candidates (combined for [u+v]/2 plane ) using Will's shape
