04 Apr
April 2008 posts
2008.04.02 EEMC SMD shapes: data-driven (eta, gamma-jet) vs Monte Carlo (single gamma, gamma-jet)
Ilya Selyuzhenkov April 02, 2008
Some observations:
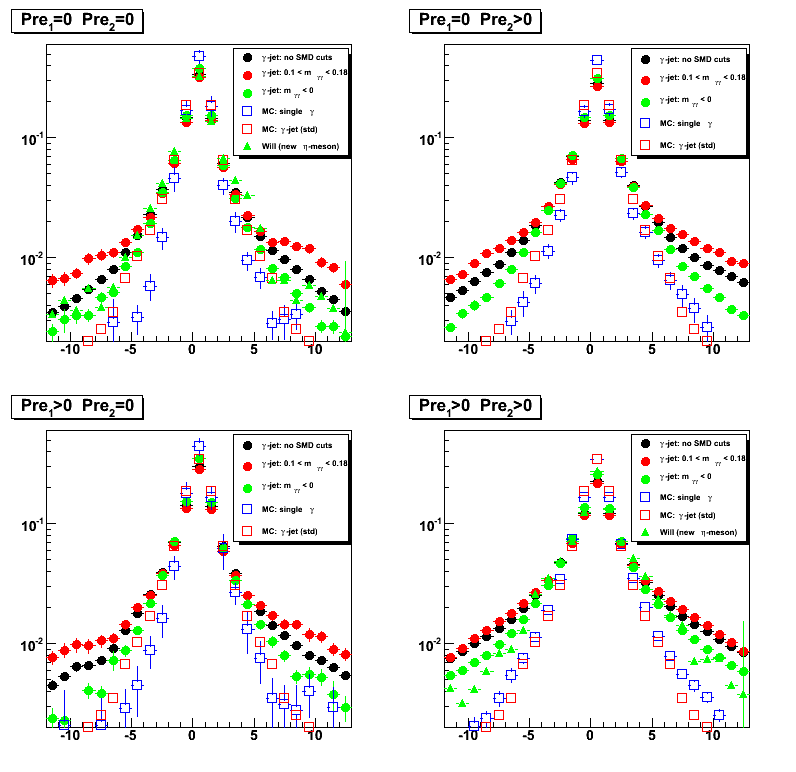
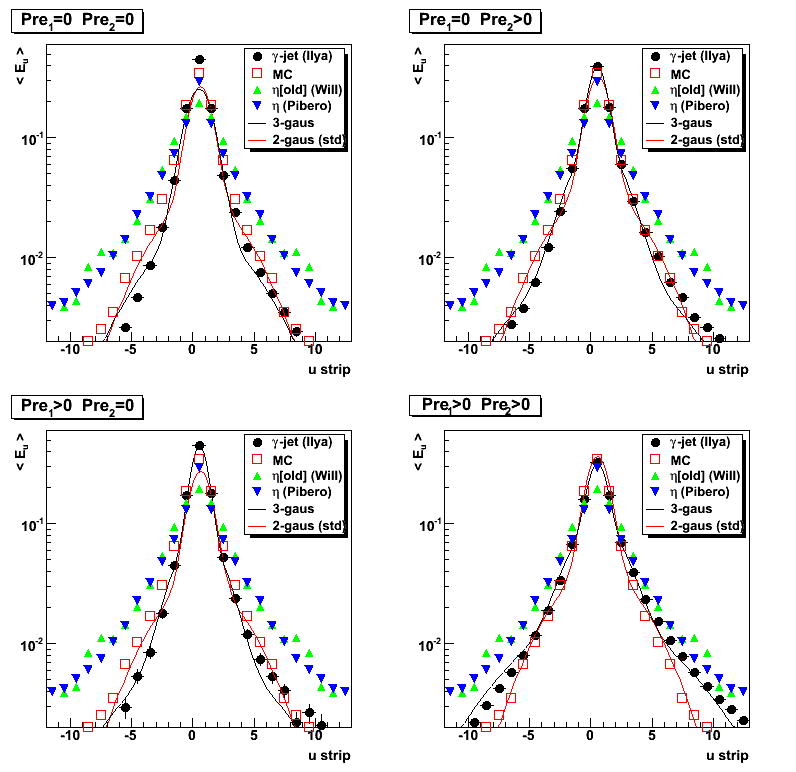
- SMD data-driven shapes from eta-meson and gamma-jet studies
are in a good agreement for different preshower conditions
(compage Fig.1 green circles/triangles in upper-left/bottom-right plots) - single gamma MC shapes show preshower dependance,
but they are still narrower compared to the data shapes
(compare Fig.1 green circles vs blue open squares) - MC shapes for gamma-jet and single gamma are consistent (Fig.1, bottom right plot)
Figure 1: EEMC SMD shape comparison for various preshower cuts
Note:Only MC gamma-jet shape (open red squares) is the same on all plots
2008.04.02 Sided residual: Using data driven gamma-jet shape (3 gaussian fit)
Ilya Selyuzhenkov April 02, 2008
Figure 1: Side residual for various cuts on energy deposited in the EEMC pre-shower 1 and 2
No EEMC SMD based cuts
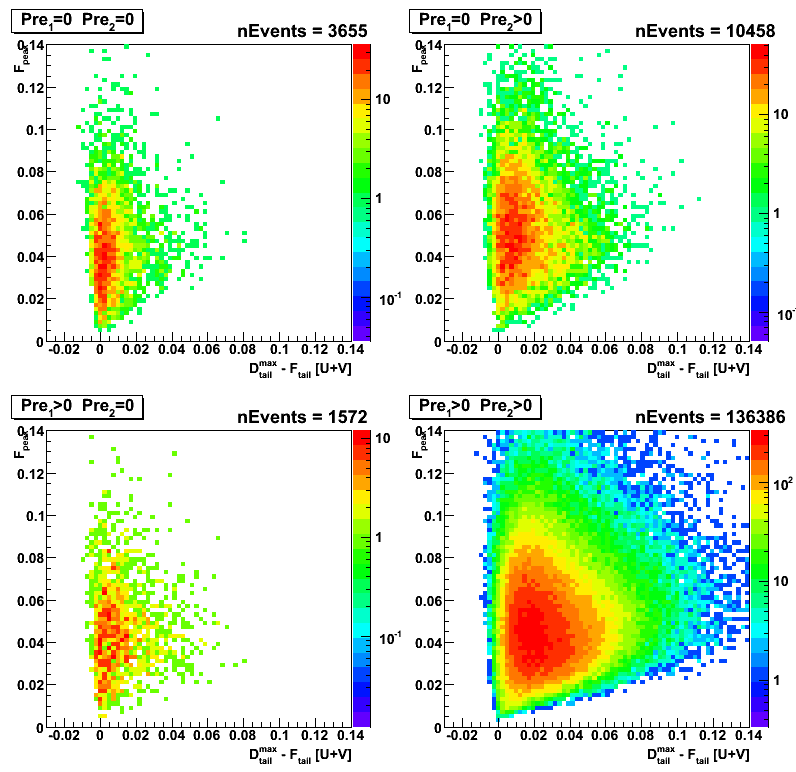
Figure 2: Side residual for various cuts on energy deposited in the EEMC pre-shower 1 and 2
"Simple" pi0 finder can not find a second peak
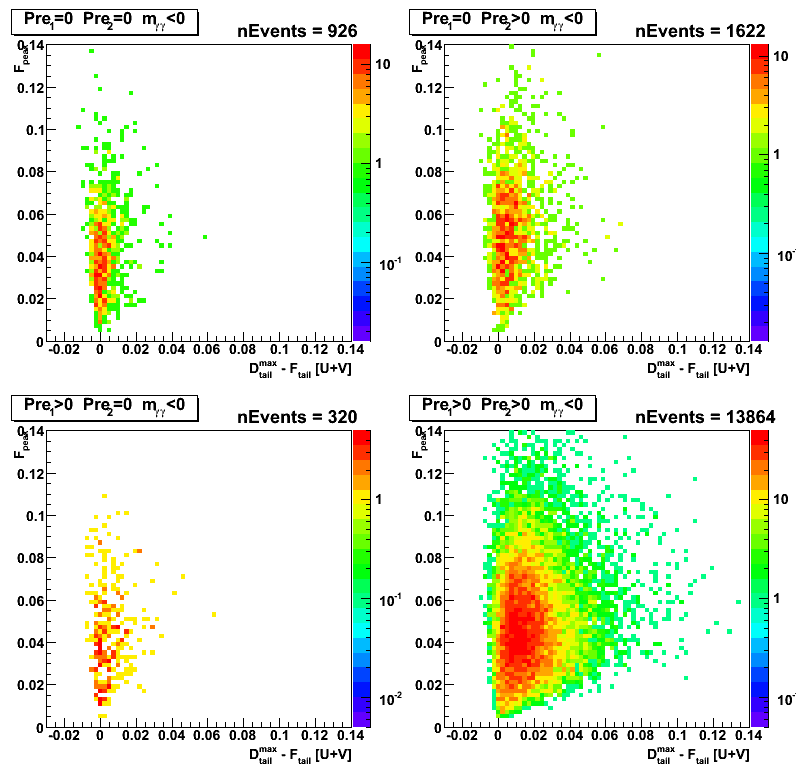
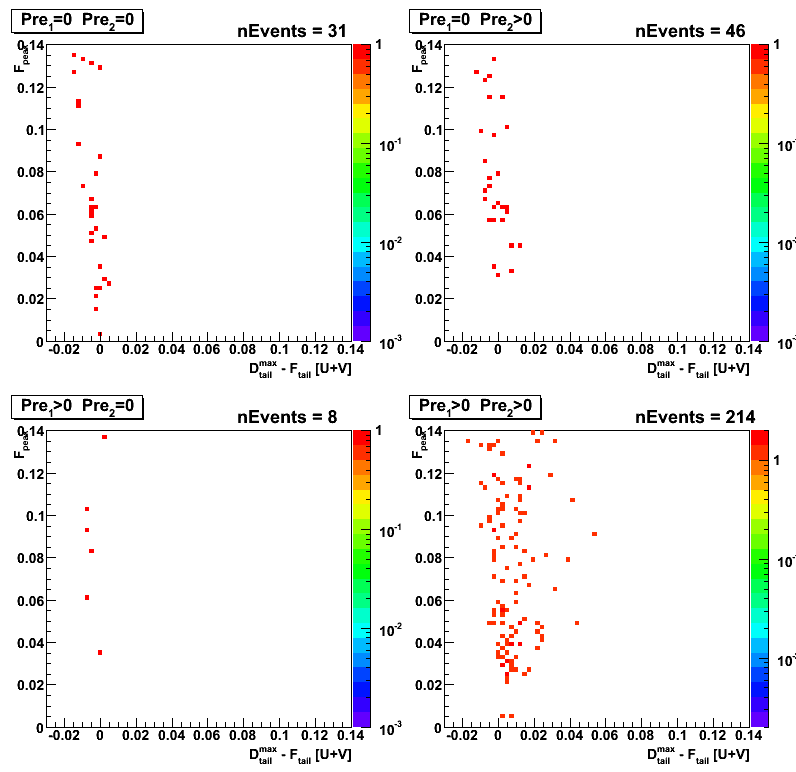
Figure 3: Side residual for various cuts on energy deposited in the EEMC pre-shower 1 and 2
"Simple" pi0 finder reconstruct the invarian mass within [0.1,0.18] range
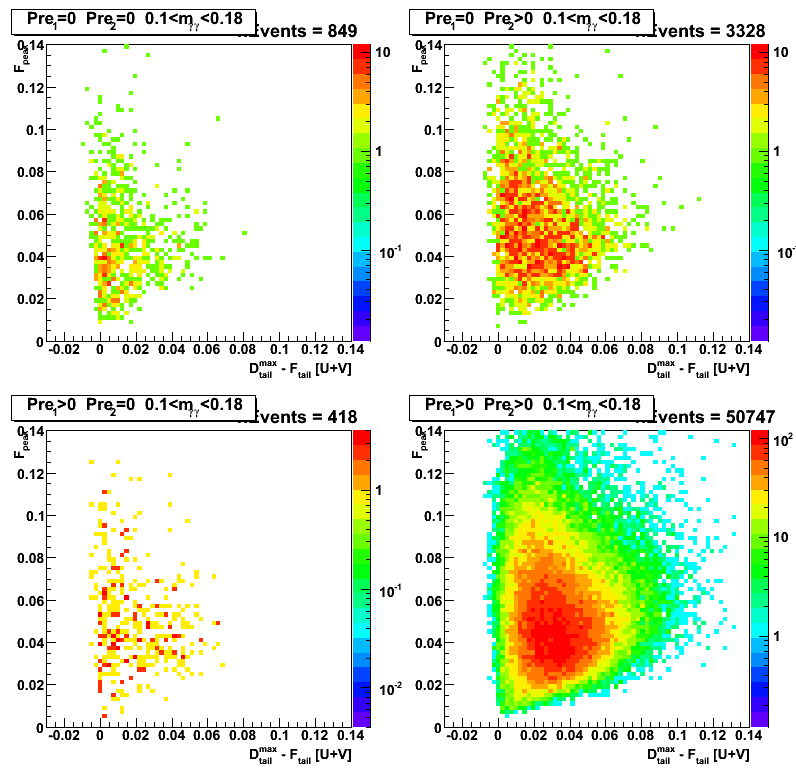
Figure 4: Side residual distribution (Projection for side residual in Figs.1-3 on vertical axis)
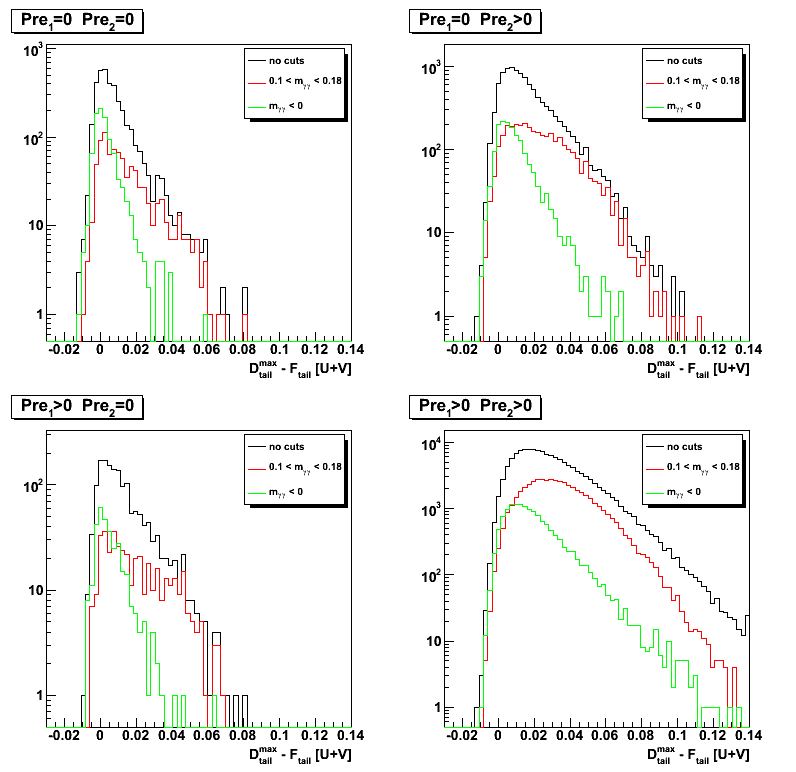
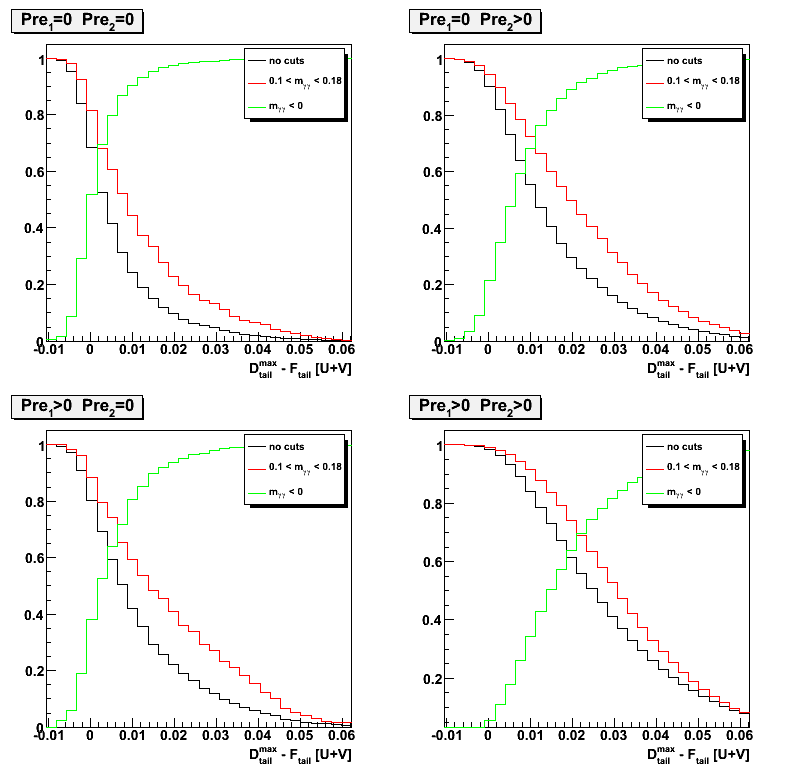
Figure 5: Signal (green: m < 0) vs background (black, red) separation
2008.04.02 Sided residual: single gamma Monte-Carlo simulations
Ilya Selyuzhenkov April 02, 2008
Side residual: single gamma Monte-Carlo simulations
Figure 1: Side residual for various cuts on energy deposited in the EEMC pre-shower 1 and 2
No EEMC SMD based cuts
2008.04.03 chi2-shape subtraction for different Preshower conditions
Ilya Selyuzhenkov April 03, 2008
Request from Hal Spinka:
Hi Ilya,
I think you gave up on the chi-squared method too quickly, and am sorry I missed the phone meeting last week. So, I would like to make a request that will hopefully take a minimal amount of your time to show that all is okay. Then, if there is a delay in getting the sided residual information out and into the beam use request, you can still fall back on the chi-squared method.
In your March 28 posting, Figure 8 at the bottom, I would like to get numerical values for the events per bin for the black curves. I won't use the preshower1>0 and preshower2=0 data, so those you don't need to send. Also, I won't use the red or blue curve information.
I think your problem has been that you normalized your curves at chi-squared/ndf = 1.4 instead of the peak. What I plan to do is to normalize the (pre1=0, pre2=0) to the (pre1=0, pre2>0) data in the peak and subtract. The (pre1=0, pre2=0) set should have some single photons, but also some multiple photons. The (pre1=0, pre2>0) should also have single photons, and more multiple photons, since the chance that one of them will convert is larger. The difference should look roughly like your blue curve, though perhaps not exactly if Pibero's mean shower shape is not perfect (which it isn't). I will do the same thing with taking the difference between (pre1>0, pre2>0) and (pre1=0, pre2=0), and again the difference should look roughly like your blue curve. The (pre1>0, pre2>0) data should have even larger fraction of multiple photons than either of the other two data sets. I would expect the two difference curves to look approximately the same.
Hope this is possible for you to do. Since our reduced chi-squared curve looks so much like the one from CDF, I am pretty confident that we are okay, but this should be checked to convince people that we are not doing anything terribly wrong.
Reply by Ilya:
Dear Hal,
I have tried to implement your idea and produce a figure attached.
There are 4 plots in it:
1. Upper left plot shows normalized to unity (at maximum) chi2 distribution (obtained with Pibero shape for gamma-jet candidates) for a different pre1, pre2 conditions
2. Upper right plot shows bin-by-bin difference: a) between normalized chi2 for pre1=0, pre2>0 and pre1=0, pre2=0 (red) and b) between normalized chi2 for pre1>0, pre2>0 and pre1=0, pre2=0 (blue)
3. Bottom left Same as upper right, but normalization were done based on the integral within [-4,4] bins around maximum.
4. Bottom right Same as for upper right, but with a different normalization ([-4,4] bins around maximum)
I have also tried to normalized by the total integral, but the results looks similar.
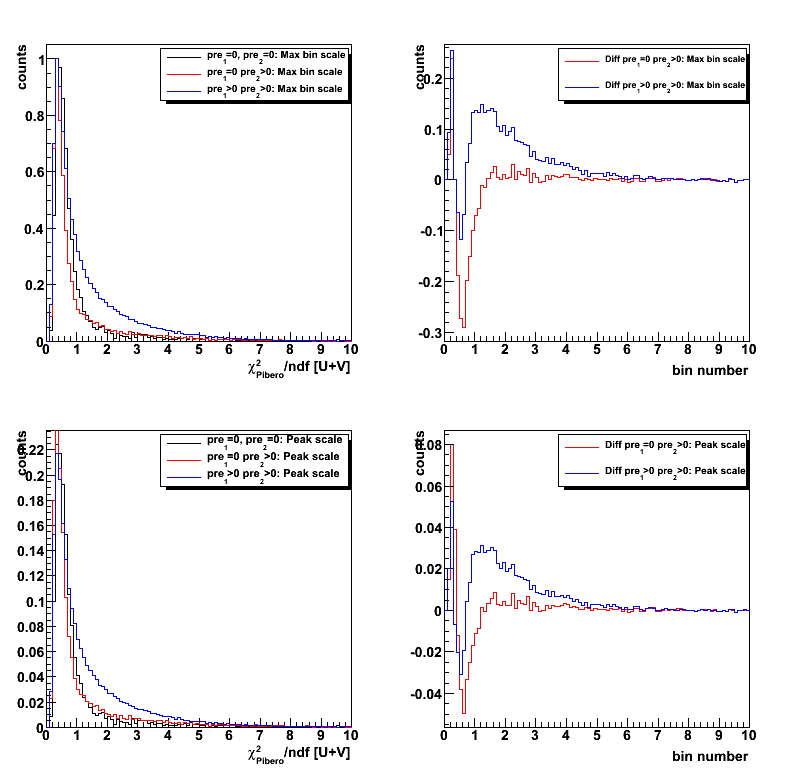
Figure 1: See description above
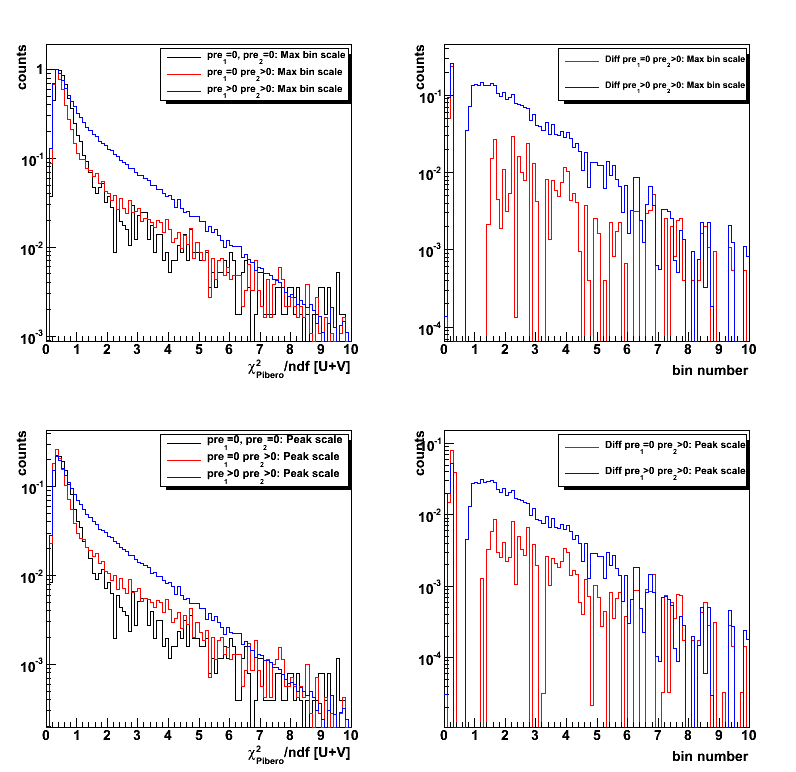
Figure 2: Same without log scale (See description above)
2008.04.09 Applying gamma-jet reconstruction algorithm for gamma-jet simulated events
Ilya Selyuzhenkov April 09, 2008
Data sample:
Monte-Carlo gamma-jet sample for partonic pt range of 5-7, 7-9, 9-11,11-15, 15-25, 25-35 GeV.
Analysis: Simulated MuDst files were first processed through jet finder algorithm (thanks to Renee Fatemi),
and later analyzed by applying gamma-jet isolation cuts (see this link for details) and studying EEMC SMD response (see below).
To test the algorithm, Geant records were not used in this analysis.
Further studies based on Geant records (yield estimates, etc) are ongoing.
EESMD shapes comparison
Figure 1:Comparison between shower shape profile for data and MC.
Black circles shows results for MC gamma-jet sample (all partonic pt).
For v-plane results see this figure
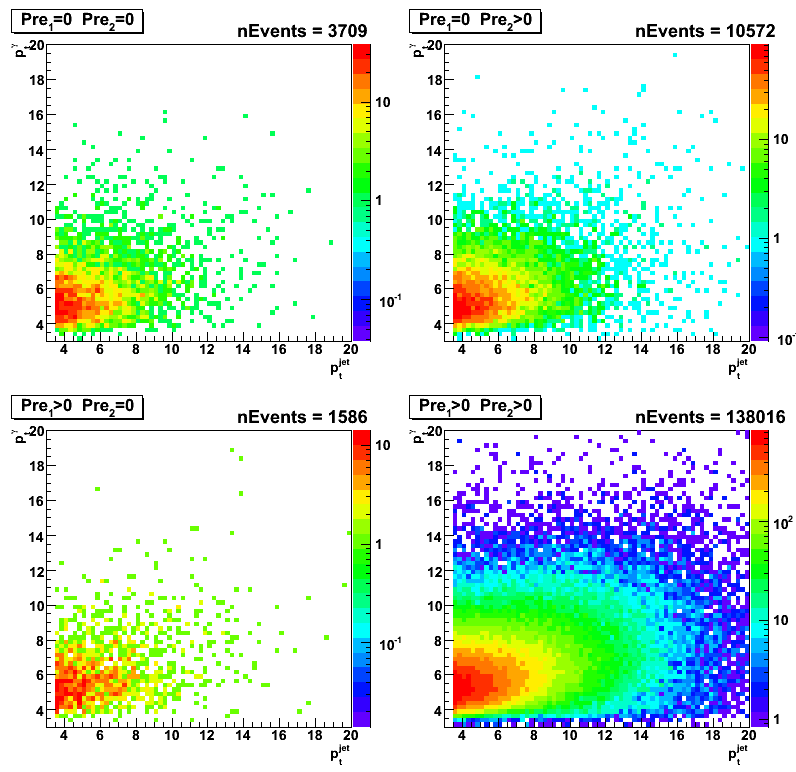
Correlation between gamma and jet pt, eta, phi
Figure 2:Gamma vs jet transverse momentum.
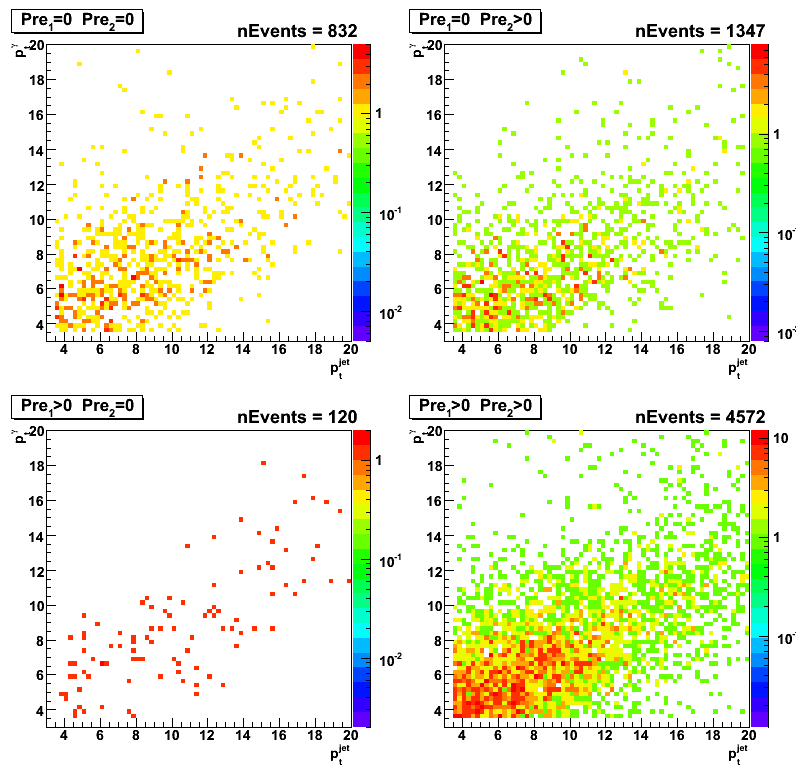
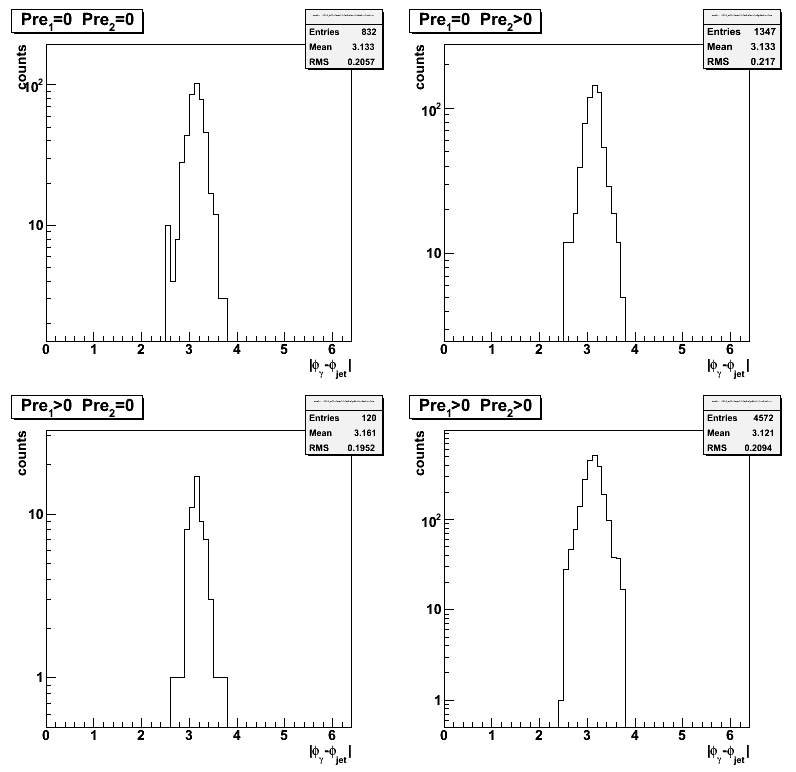
Figure 3:Gamma vs jet azimuthal angle.
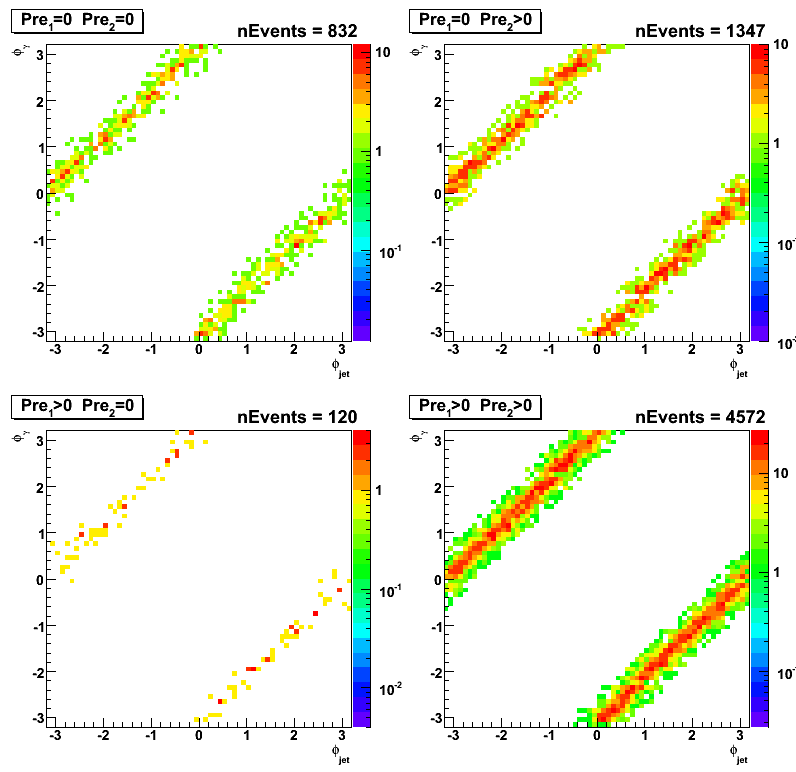
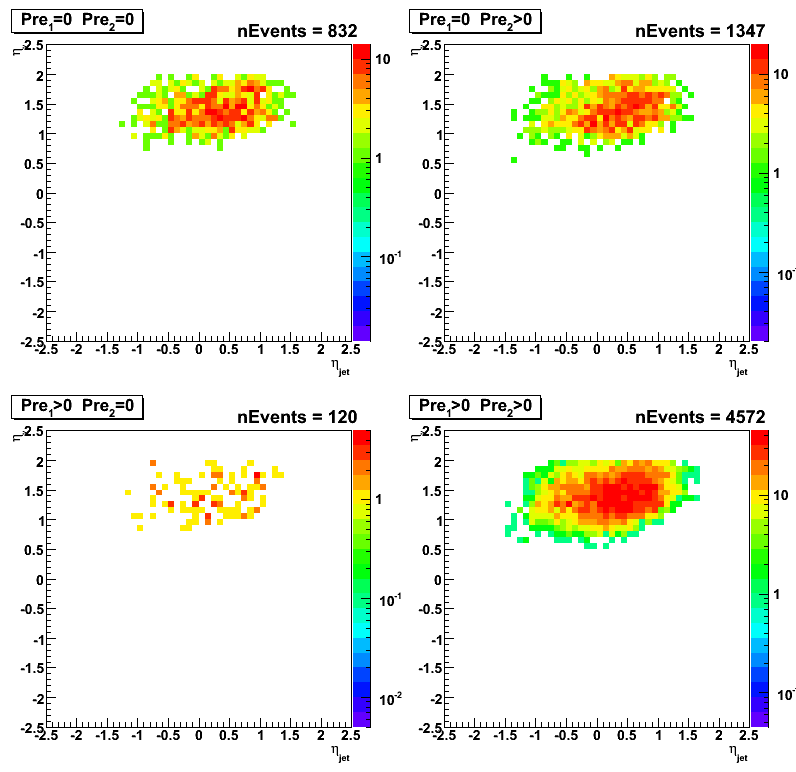
Figure 4:Gamma vs jet pseudo-rapidity.
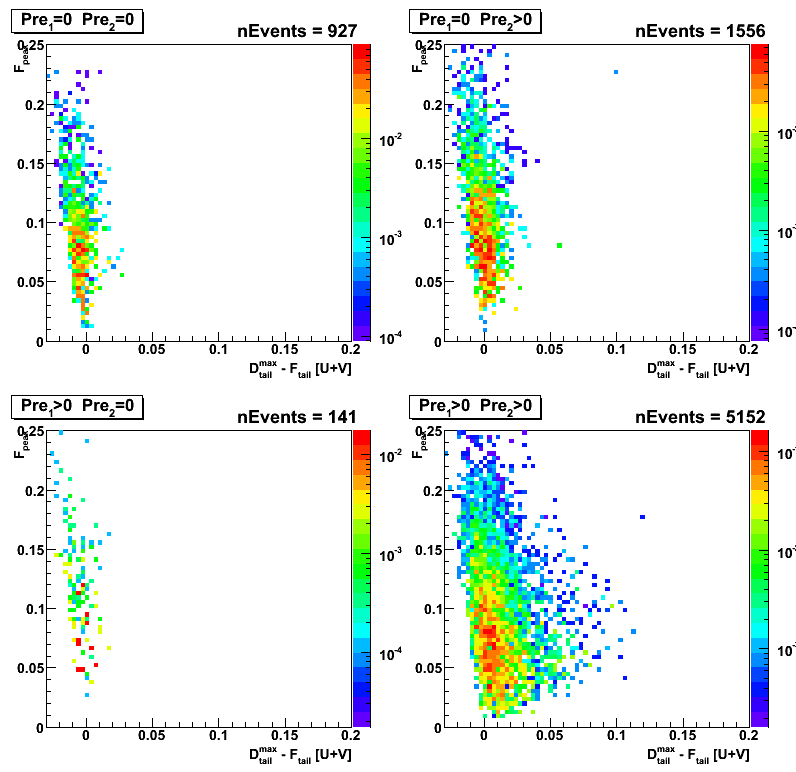
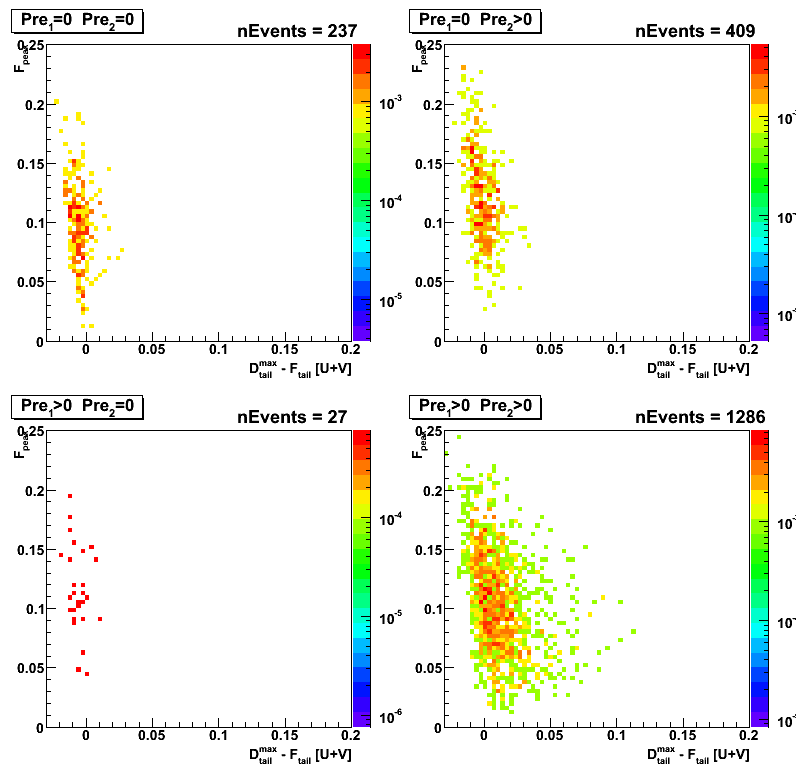
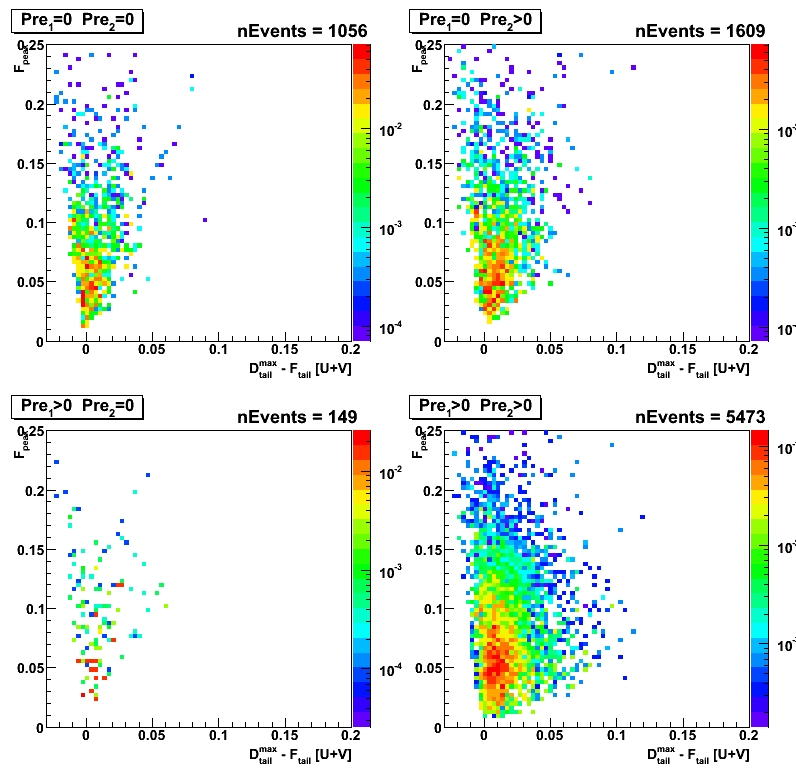
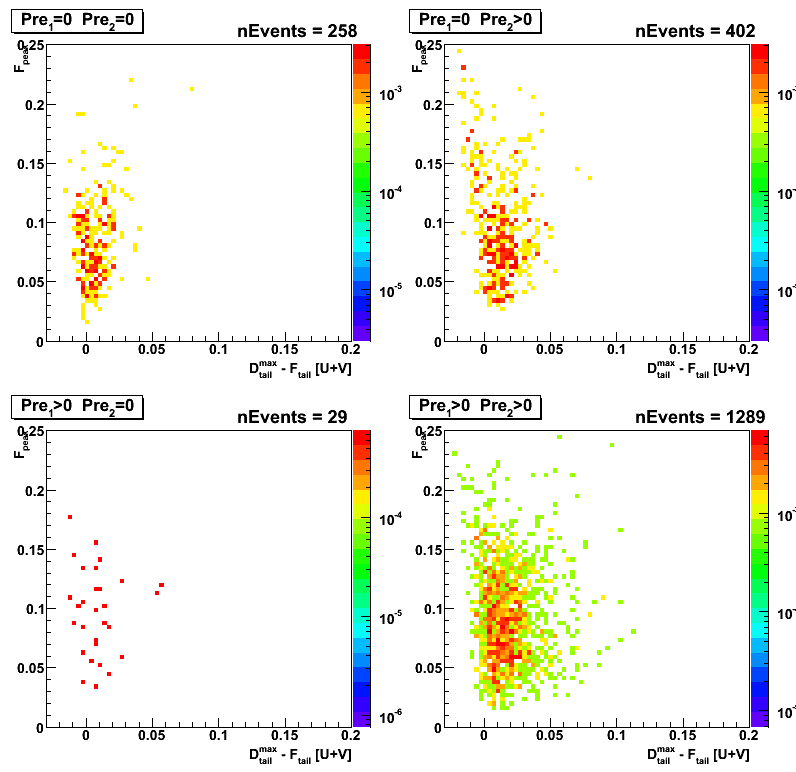
Results from maximum sided residua study
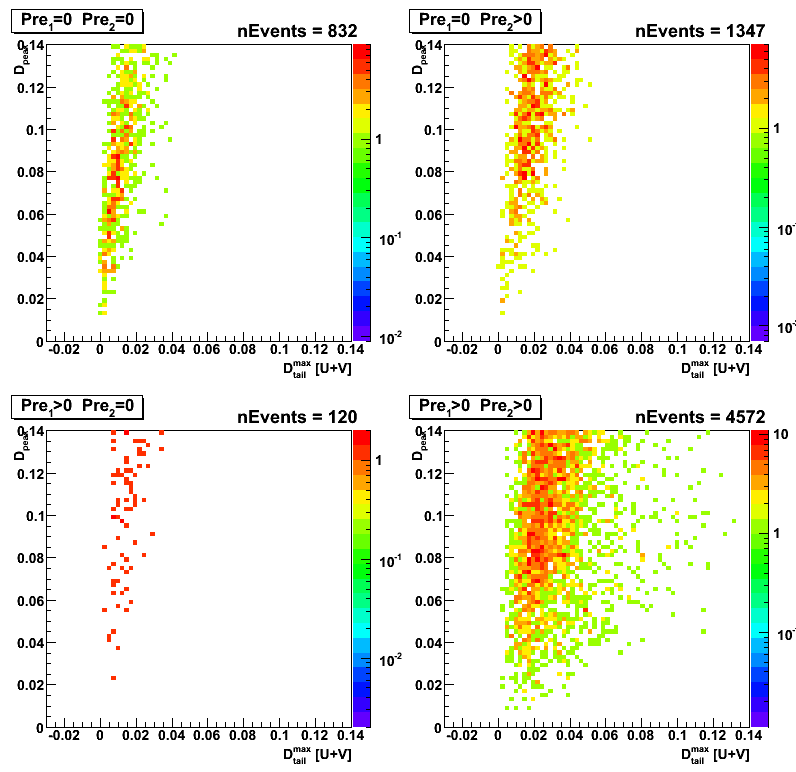
Definitions for F_peak, D_peak, D_tail^max (D_tail^min) can be found here
Figure 5:F_peak vs maximum residual
for various cuts on energy deposited in the EEMC pre-shower 1 and 2
(within a 3x3 clusters around tower with a maximum energy).
Shower shape used to fit data is fixed to the shape from the previous gamma-jet study of real events
(see black point on Fig.1 [upper left plot] at this page)
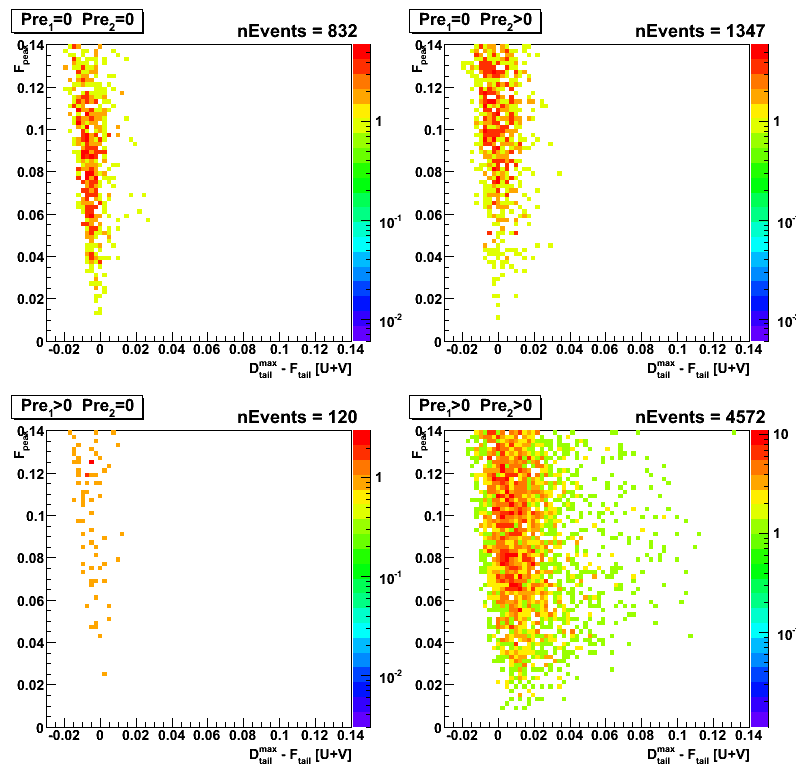
Figure 6: F_peak vs D_tail^max: click here
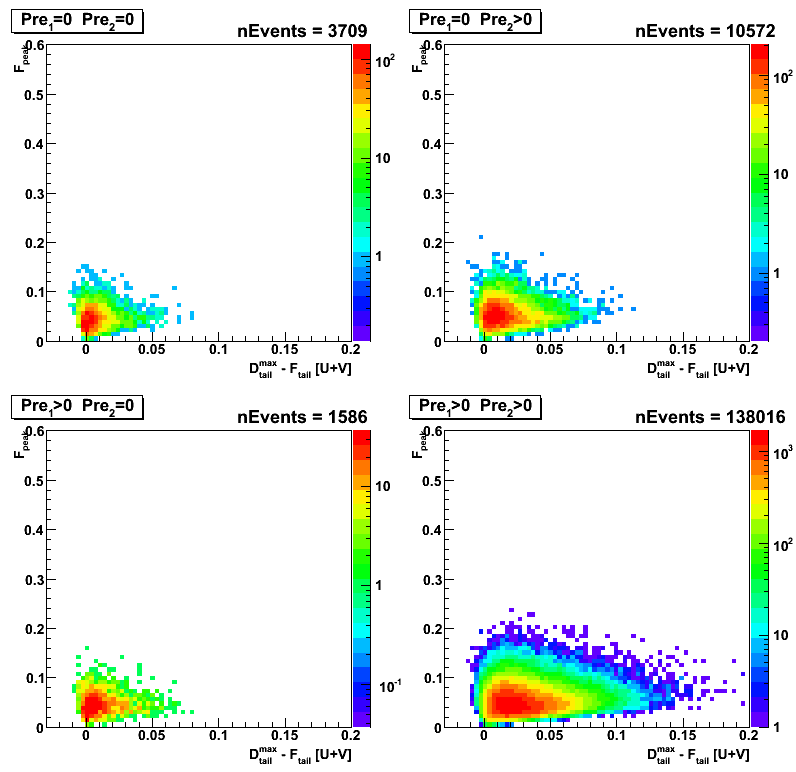
Figure 7: F_peak vs D_tail^max-D_tail^min: click here
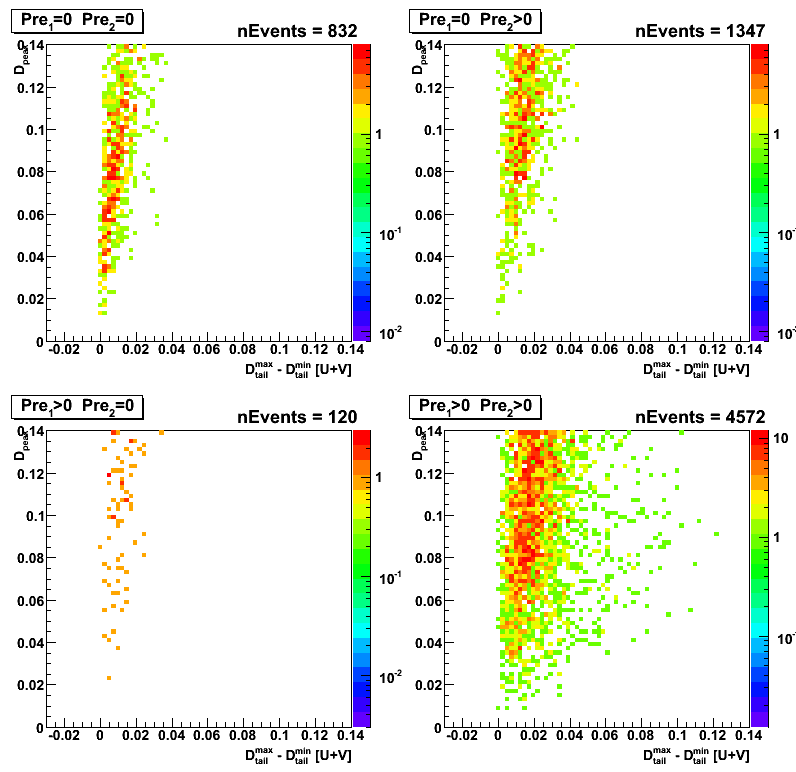
Postshower to SMD[uv] energy ratio
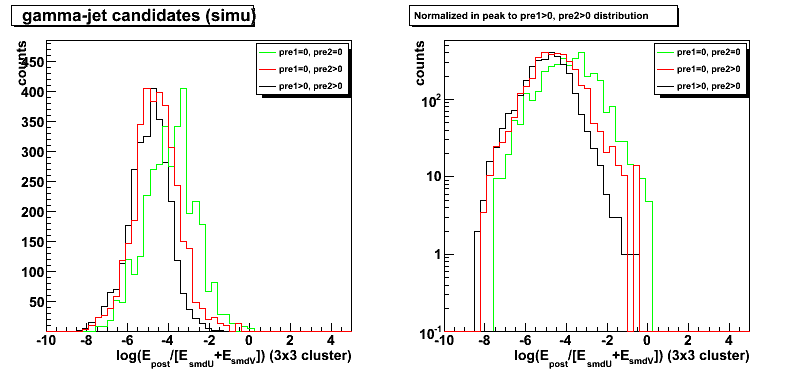
Figure 8:Logarithmic fraction of energy in post shower (3x3 cluster) to the total energy in SMD u- and v-planes
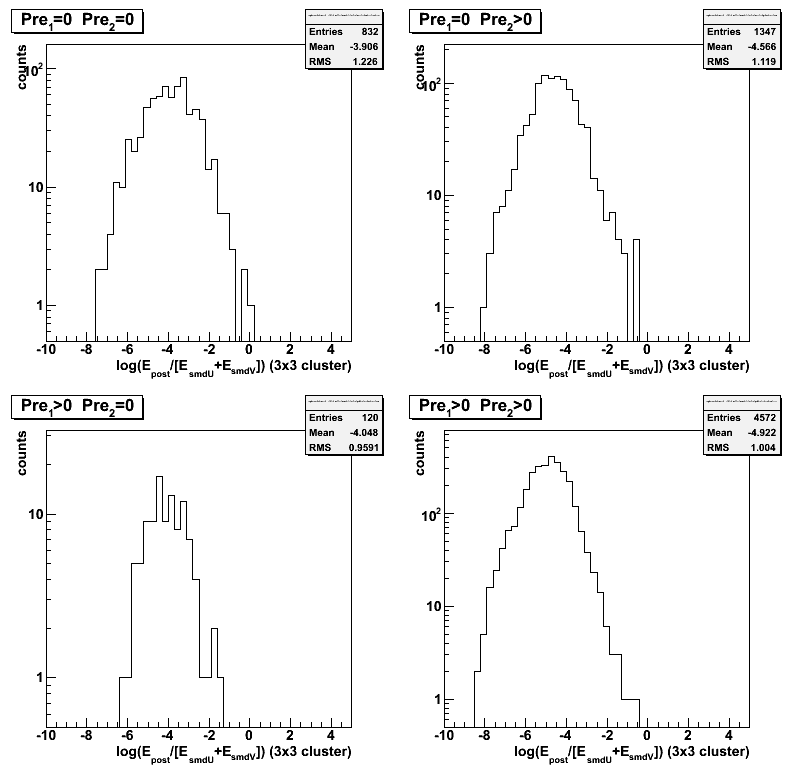
Figure 8a:
Same as figure 8, but for gamma-jet candidates from the real data (no pt cuts).
Logarithmic fraction of energy in post shower (3x3 cluster) to the total energy in SMD u- and v-planes
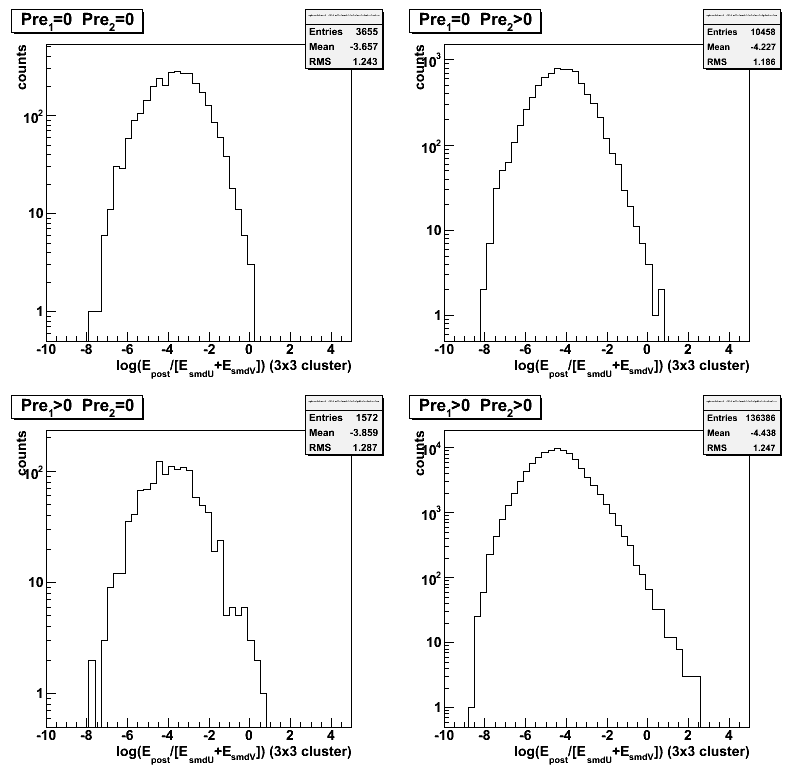
Figure 8b:
Comparison between gamma-jet candidates from data with different preshower conditions.
Points are normalized in peak to the case of pre1 > 0, pre2 > 0
Logarithmic fraction of energy in post shower (3x3 cluster) to the total energy in SMD u- and v-planes
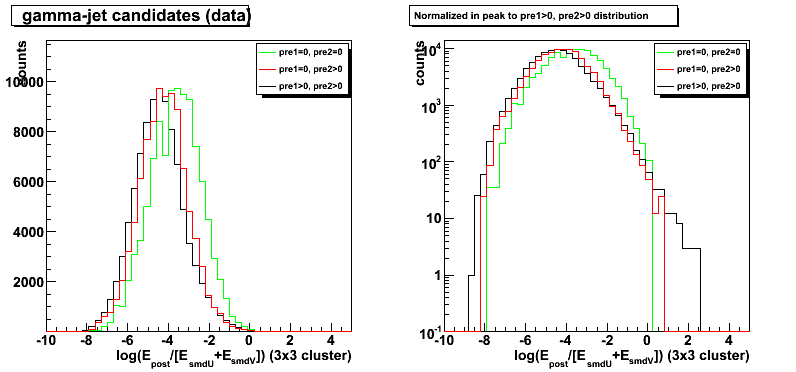
Figure 8c:
Comparison between gamma-jet candidates from Monte-Carlo simulations with different preshower conditions.
Points are normalized in peak to the case of pre1 > 0, pre2 > 0
Logarithmic fraction of energy in post shower (3x3 cluster) to the total energy in SMD u- and v-planes
Additional QA plots
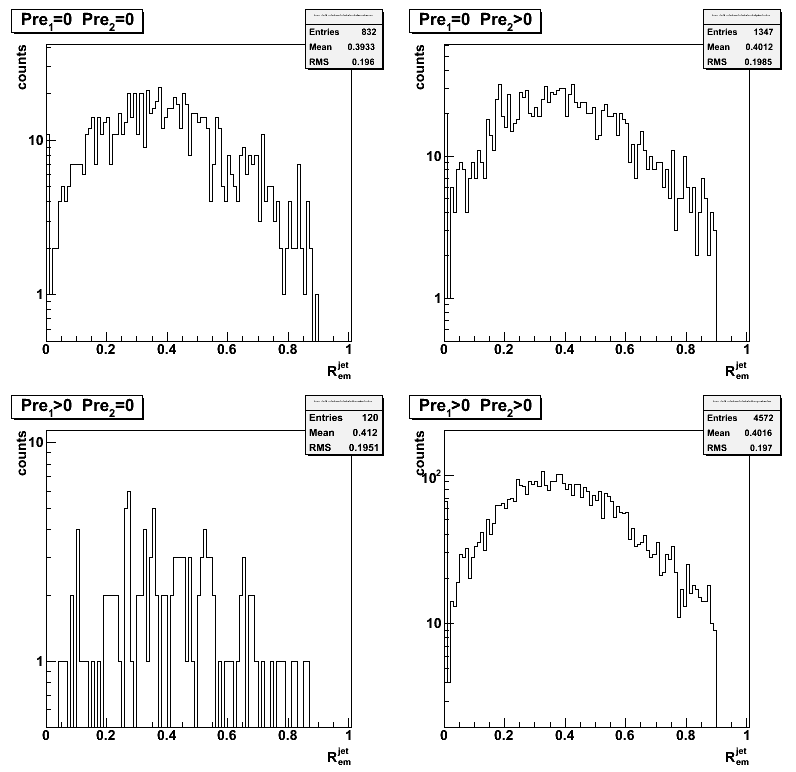
Figure 9: Jet neutral energy fraction
Figure 10: High v-strip vs u-strip
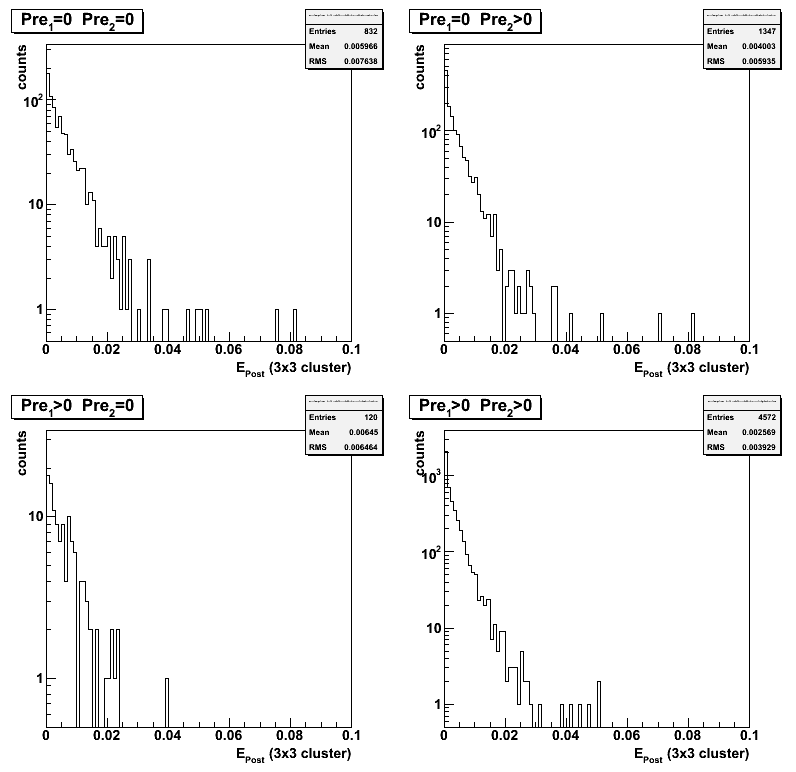
Figure 11: energy post shower (3x3 cluster)
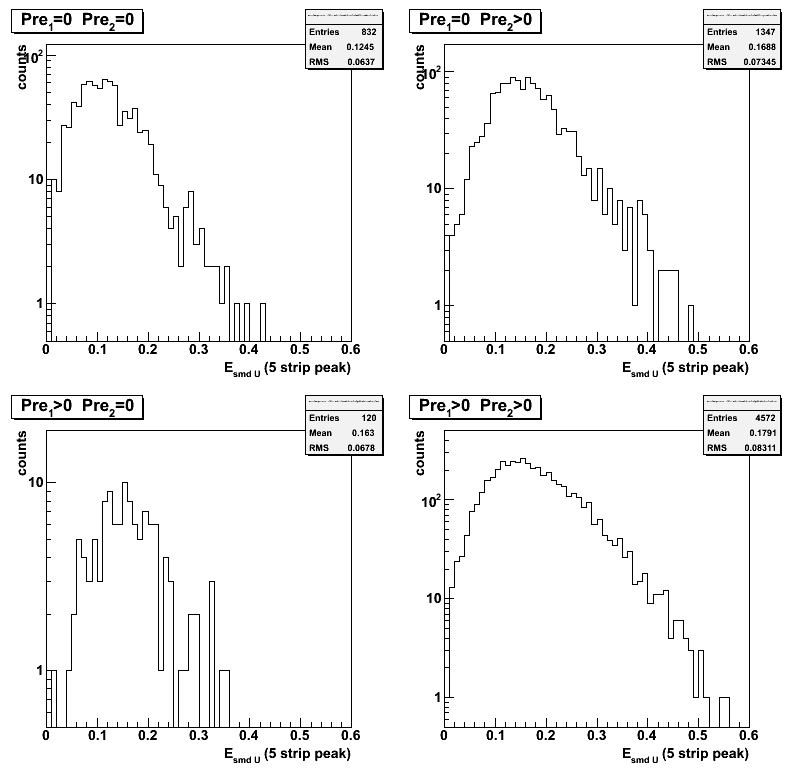
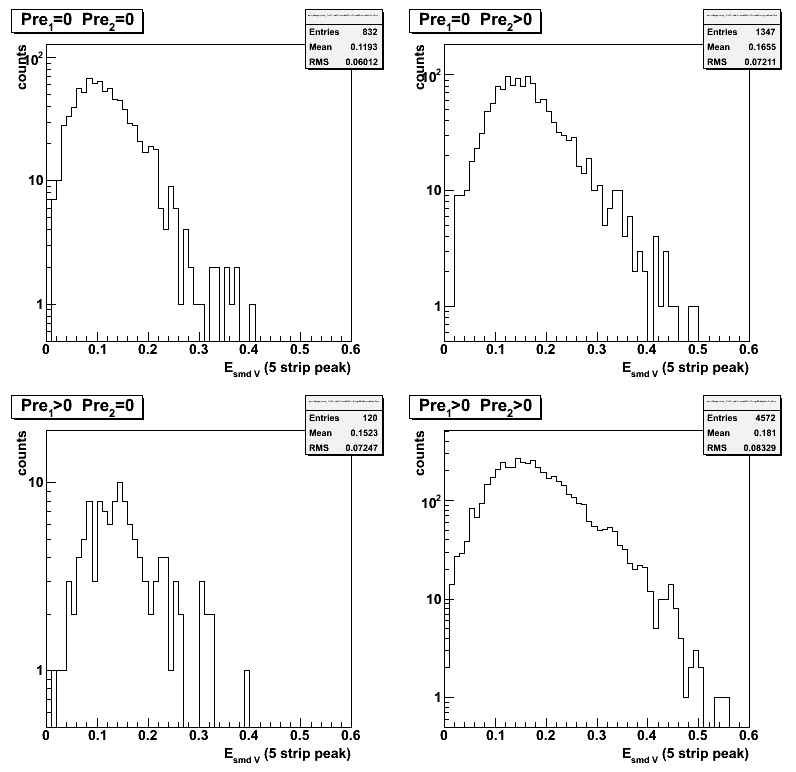
Figure 12: Peak energy SMD-u
Figure 13: Peak energy SMD-v
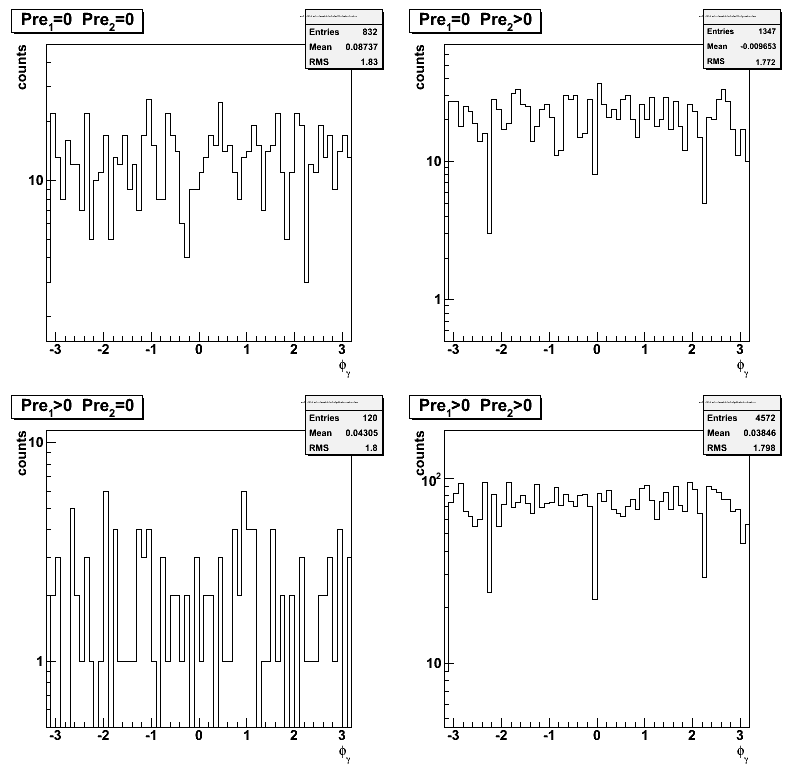
Figure 14: Gamma phi
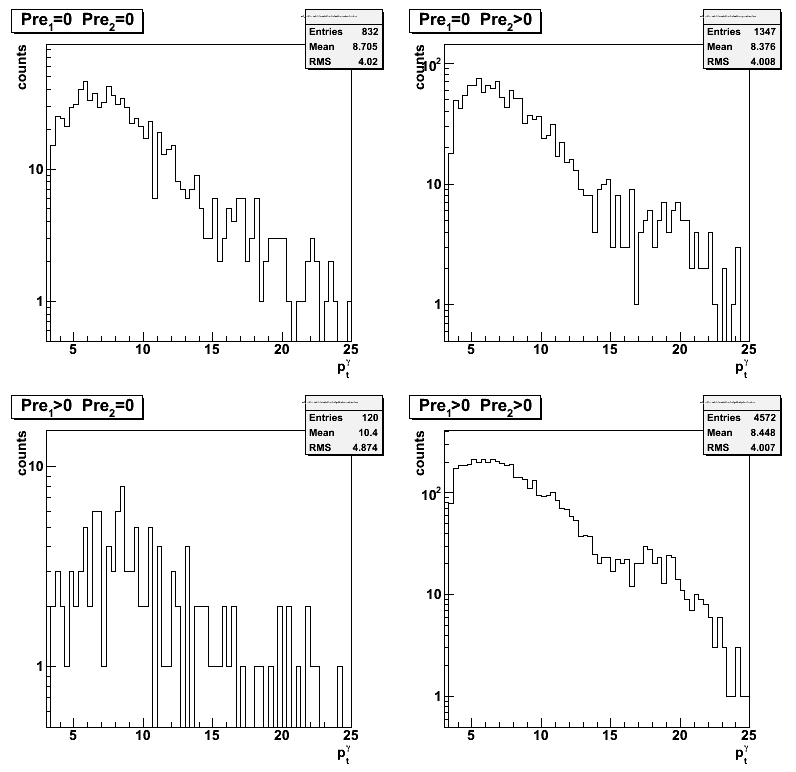
Figure 15: Gamma pt
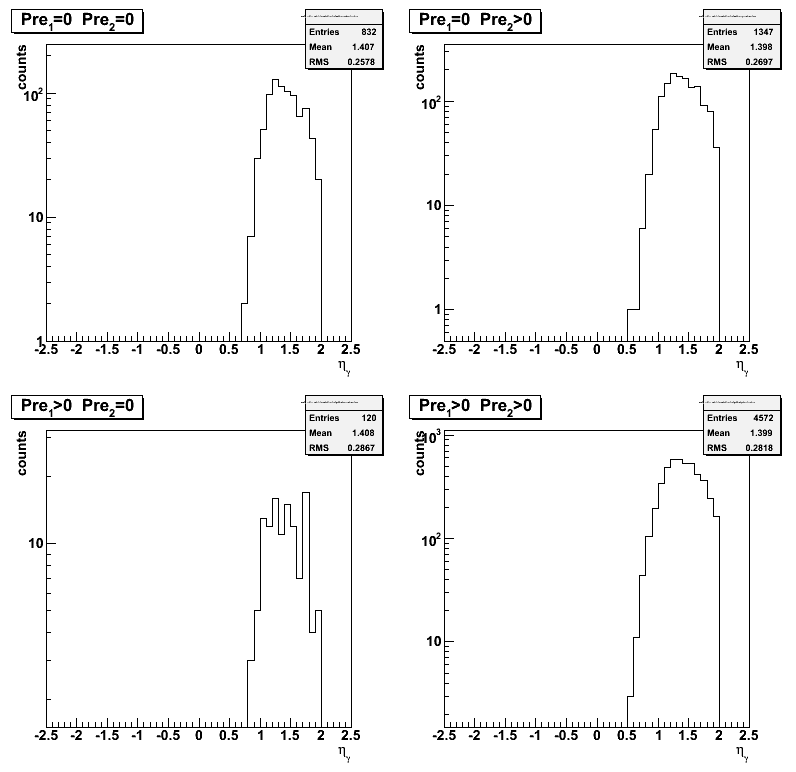
Figure 16: Gamma eta
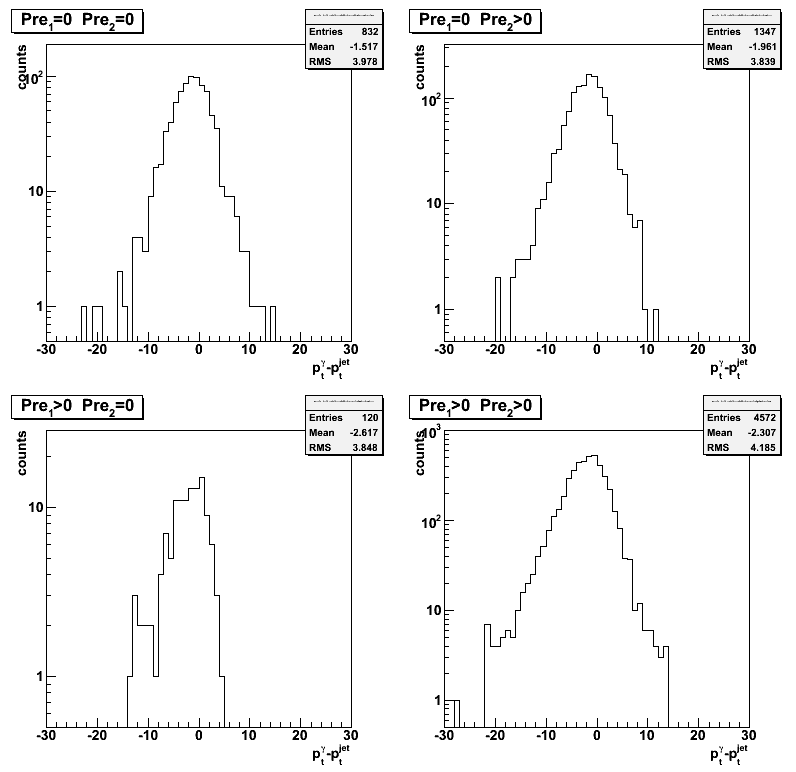
Figure 17: Delta gamma-jet pt
Figure 18: Delta gamma-jet eta
Figure 19: Delta gamma-jet phi
chi2 distributions
Figure 20:chi2 distribution using "standard" MC shape
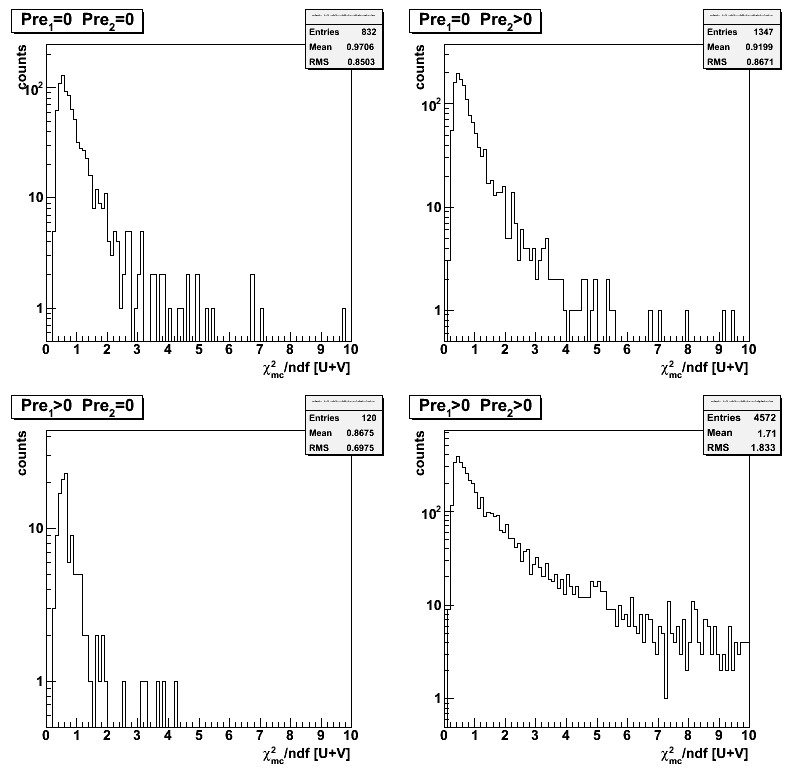
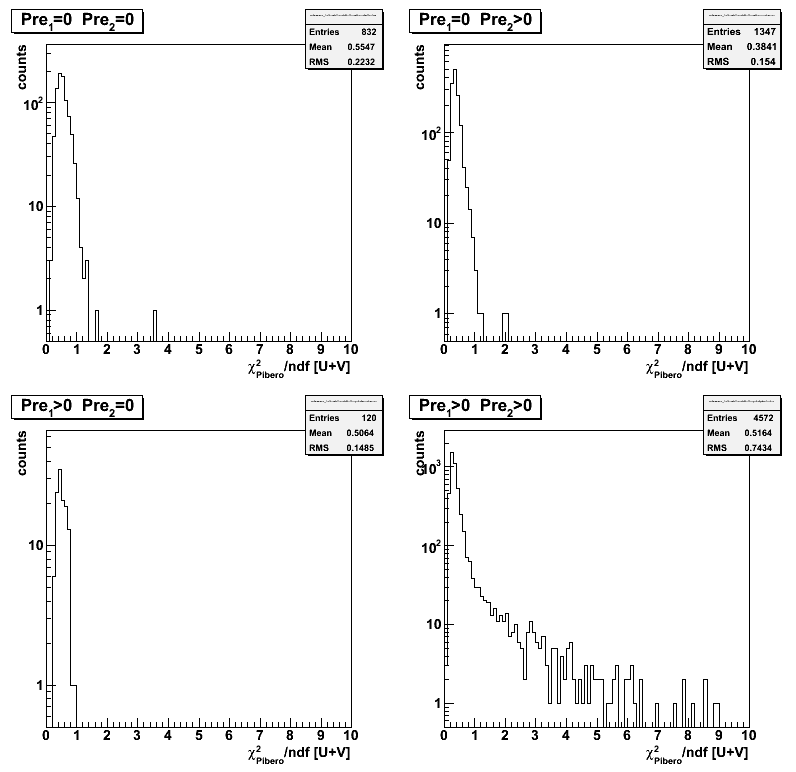
Figure 21:chi2 distribution using Pibero shape
2008.04.16 Sided residual: Data Driven MC vs raw MC vs 2006 data
Ilya Selyuzhenkov April 16, 2008
Figure 1: Sided residual for raw MC (partonic pt 9-11)
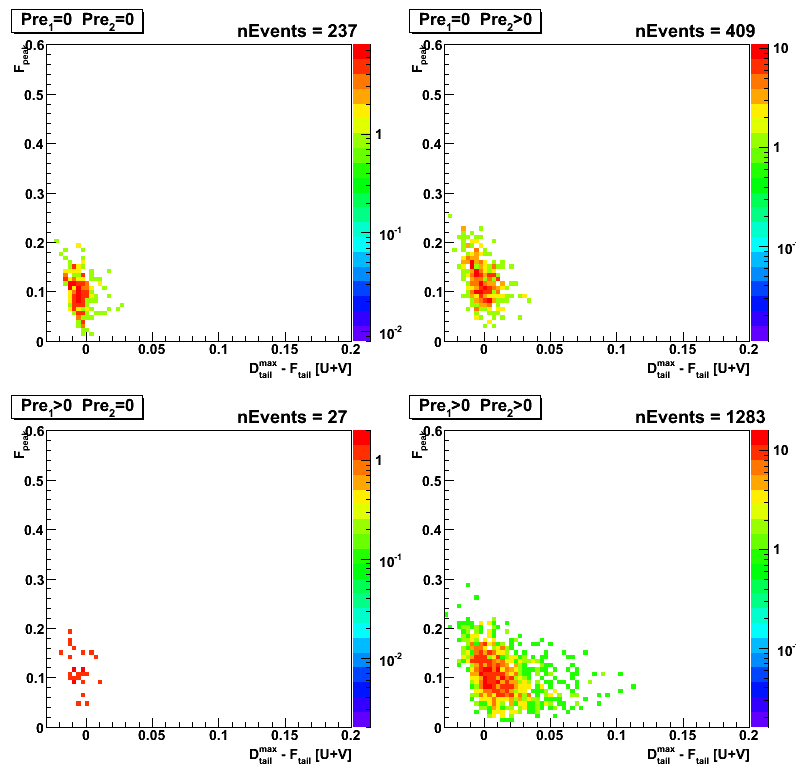
Figure 2: Sided residual for data-driven MC (partonic pt 9-11)
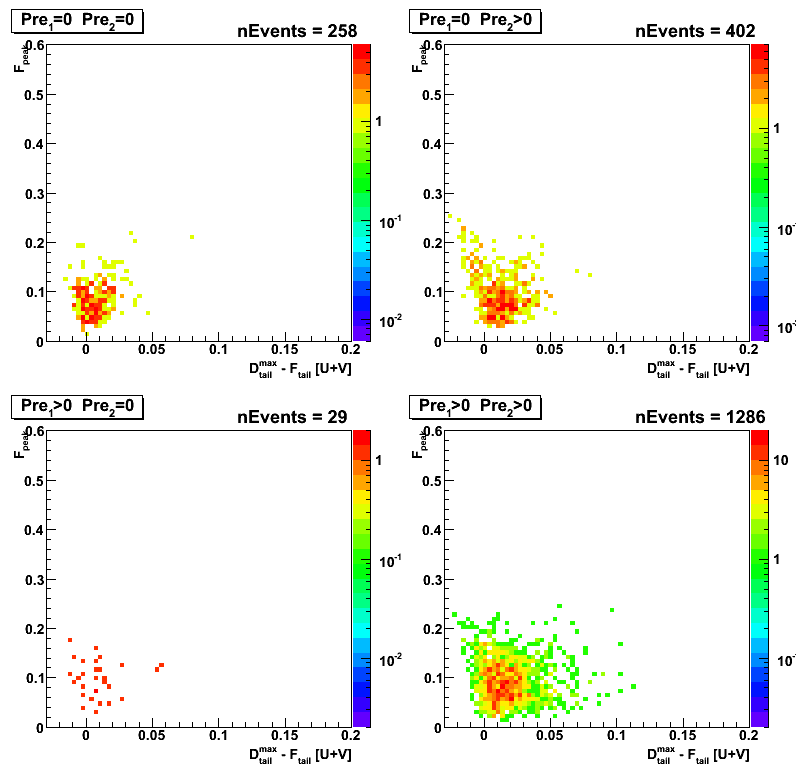
Figure 3: Sided residual for data (pp Longitudinal 2006)
Different analysis cuts vs number of events which passed the cut
- N_events : total number of di-jet events found by the jet-finder for gamma in eta region [1,2]
(Geant record is used to get this number) - cos(phi_gamma - phi_jet) < -0.8 : gamma-jet opposite in phi
- R_{3x3cluster} > 0.9 : Energy in 3x3 cluster of EEMC tower to the total jet energy.
- R_EM^jet < 0.9 : neutral energy fraction cut for on away side jet
- N_ch=0 : no charge tracks associated with a gamma candidate
- N_bTow = 0 : no barrel towers associated with a gamma candidate (gamma in the endcap)
- N_(5-strip clusler)^u > 3 : minimum number of strips in EEMC SMD u-plane cluster around peak
- N_(5-strip cluster)^v > 3 : minimum number of strips in EEMC SMD v-plane cluster around peak
- gamma-algo fail : my algorithm failed to match tower with SMD uv-intersection, etc...
- Tow:SMD match : SMD uv-intersection has a tower which is not in a 3x3 cluser
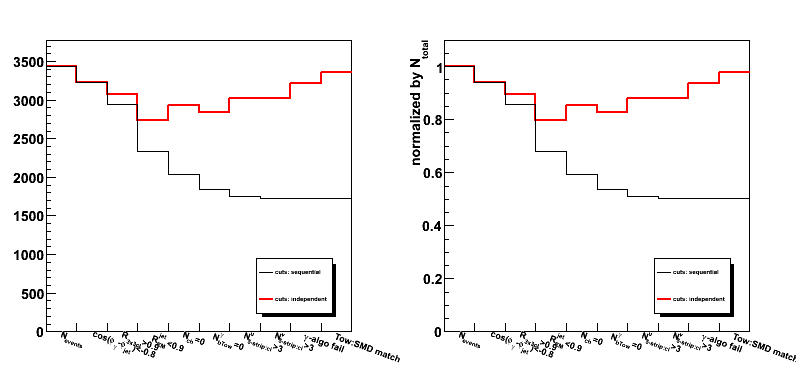
Figure 4: Number of events which passed various cuts (MC data, partonic pt 9-11)
2008.04.17 Sided residual: Data Driven MC vs raw MC (partonic pt=5-35) vs 2006 data
Ilya Selyuzhenkov April 17, 2008
MC data for different pt weigted according to Michael Betancourt web page:
weight = xSection[ptBin] / xSection[max] / nFiles
Figure 1: Sided residual for raw MC (partonic pt 5-35)
(same plot for partonic pt 9-11)
Figure 2: Sided residual for data-driven MC (partonic pt 5-35)
(same plot for partonic pt 9-11)
Figure 3: Sided residual for data (pp Longitudinal 2006)
Figure 4: Sided residual for data (pp Longitudinal 2006)
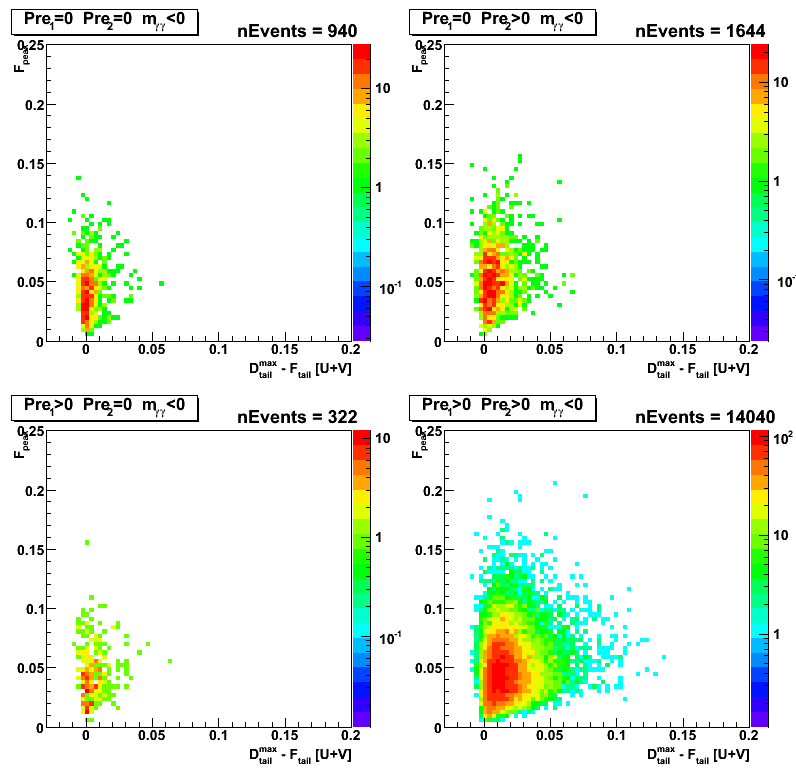
Figure 5: Sided residual for data (pp Longitudinal 2006)
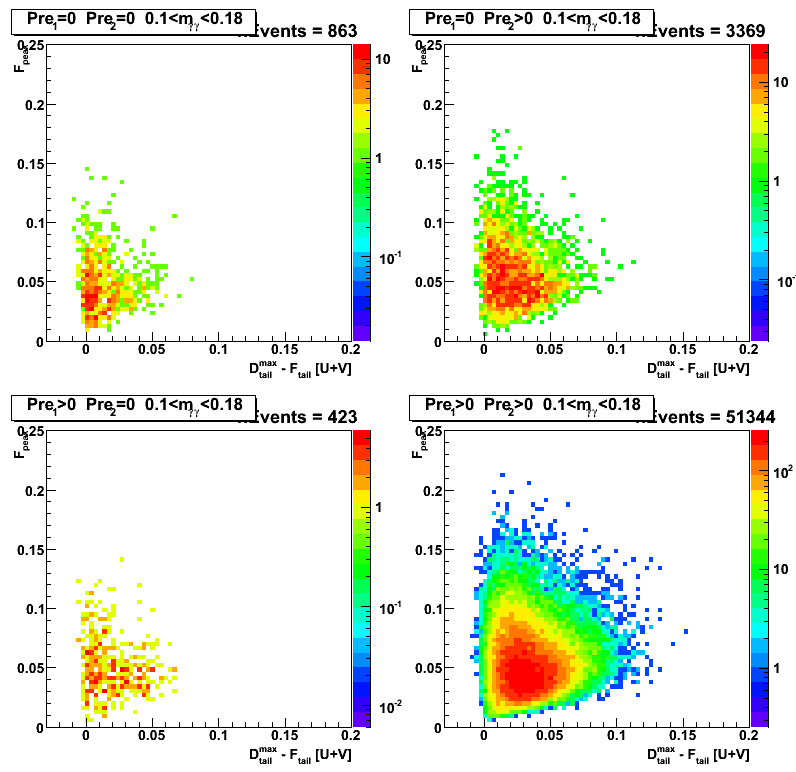
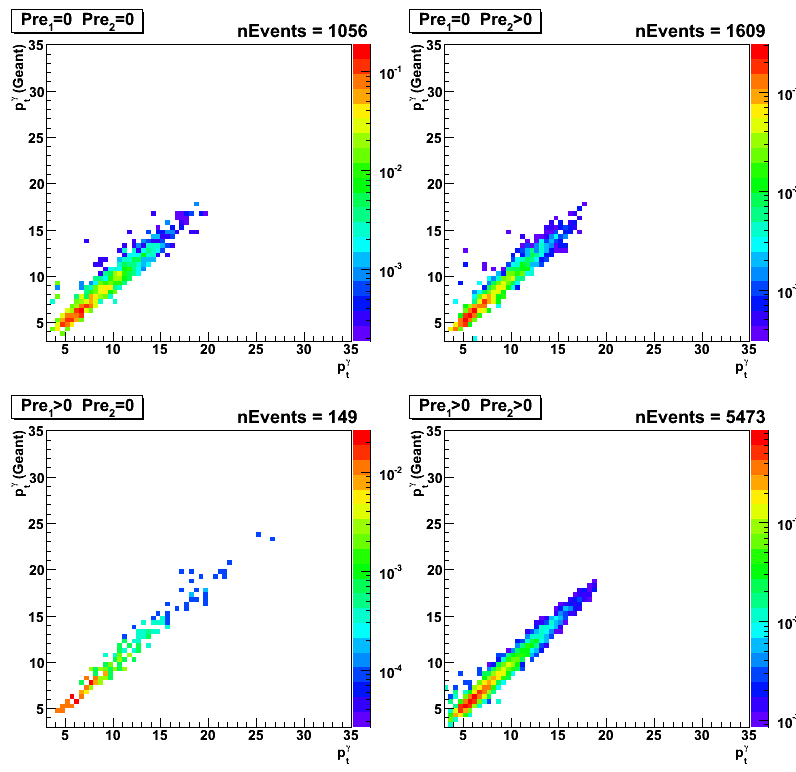
Figure 6: pt(gamma) from geant record vs
pt(gamma) from energy in 3x3 tower cluster and position for uv-intersection wrt vertex
(same on a linear scale)
Figure 7: pt(gamma) from geant record vs
pt(jet) as found by the jet-finder
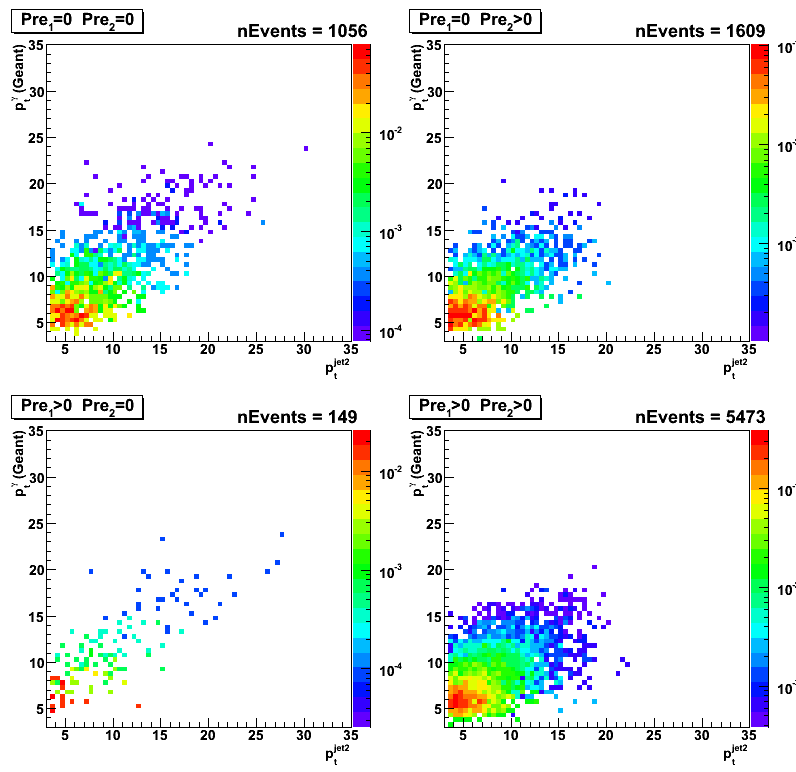
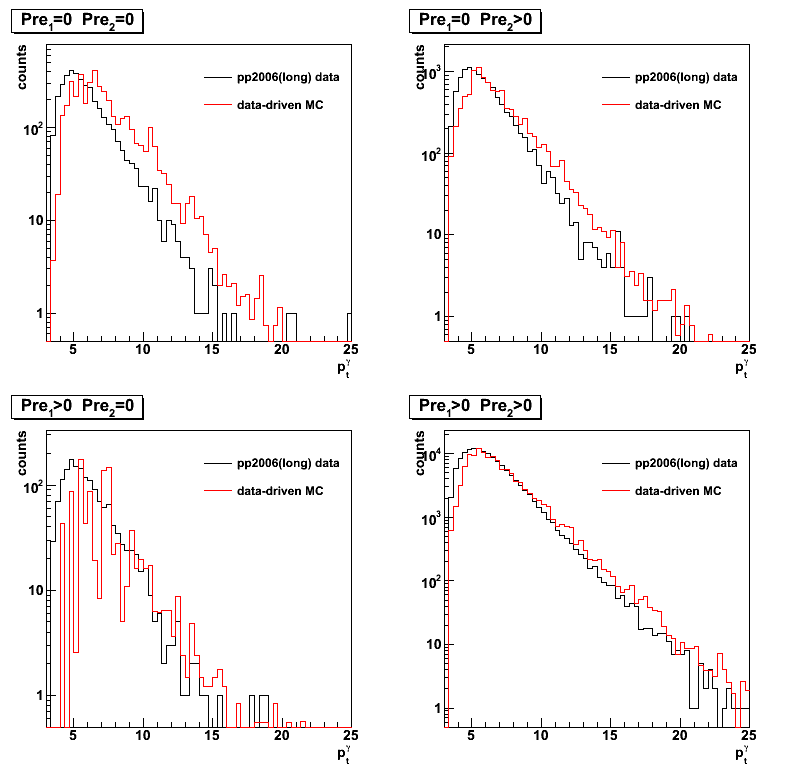
Figure 8: gamma pt distribution:
data-driven MC (red) vs gamma-jet candidates from pp2006 longitudinal run (black).
MC distribution normalized to data at maximum for each preshower condition
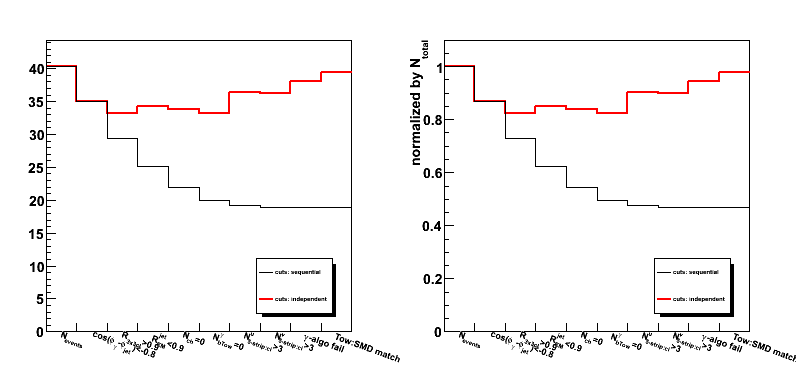
Different analysis cuts vs number of events which passed the cut
- N_events : total number of di-jet events found by the jet-finder for gamma in eta region [1,2]
(Geant record is used to get this number) - cos(phi_gamma - phi_jet) < -0.8 : gamma-jet opposite in phi
- R_{3x3cluster} > 0.9 : Energy in 3x3 cluster of EEMC tower to the total jet energy.
- R_EM^jet < 0.9 : neutral energy fraction cut for on away side jet
- N_ch=0 : no charge tracks associated with a gamma candidate
- N_bTow = 0 : no barrel towers associated with a gamma candidate (gamma in the endcap)
- N_(5-strip clusler)^u > 3 : minimum number of strips in EEMC SMD u-plane cluster around peak
- N_(5-strip cluster)^v > 3 : minimum number of strips in EEMC SMD v-plane cluster around peak
- gamma-algo fail : my algorithm failed to match tower with SMD uv-intersection, etc...
- Tow:SMD match : SMD uv-intersection has a tower which is not in a 3x3 cluser
Figure 9: Number of events which passed various cuts (MC data, partonic pt 5-35)
Red: cuts applied independent
Black: cuts applied sequential from left to right
2008.04.23 Gamma-jet candidates: pp2006 data vs data-driven MC (gamma-jet and bg:jet-jet)
Ilya Selyuzhenkov April 23, 2008
Sided residual: pp2006 data vs data-driven MC (gamma-jet and bg:jet-jet)
MC data for different partonic pt are weigted according to Michael Betancourt web page:
weight = xSection[ptBin] / xSection[max] / nFiles
Figure 1:Sided residual for data-driven gamma-jet MC events (partonic pt 5-35)
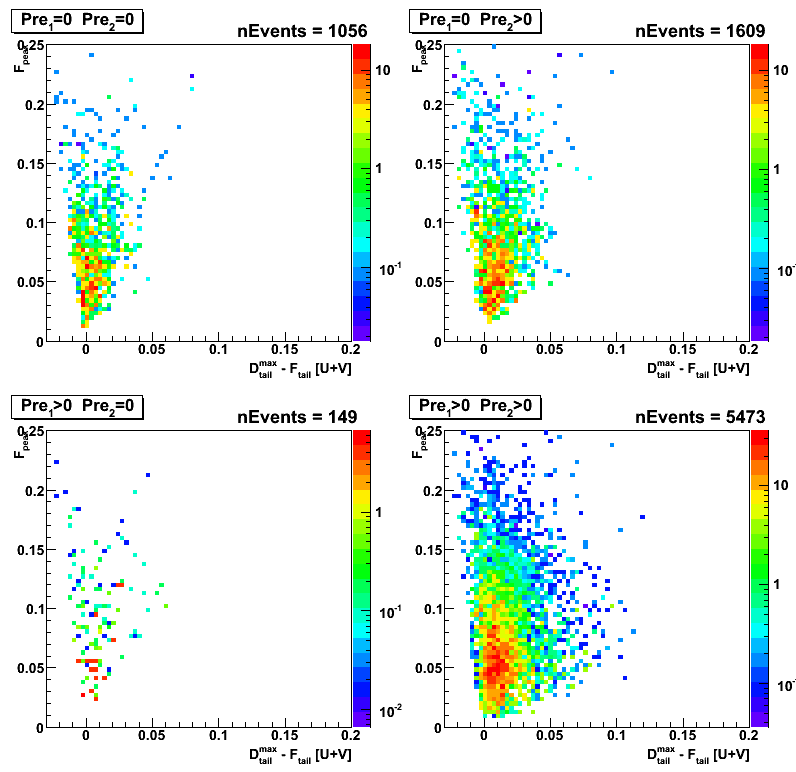
Figure 2:Sided residual for data-driven jet-jet MC events (partonic pt 3-55)
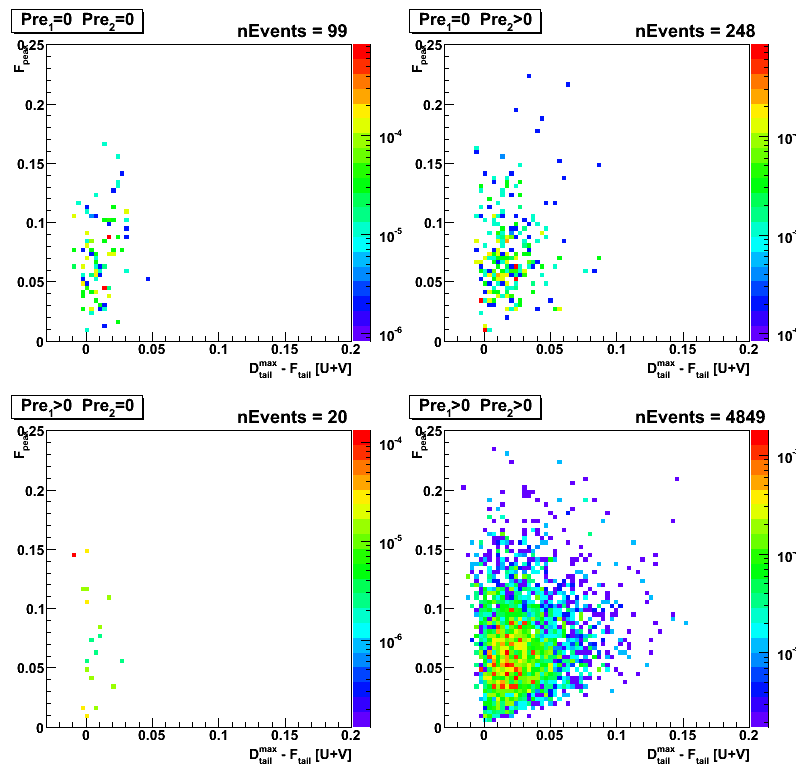
Figure 3:Sided residual for data (pp Longitudinal 2006)
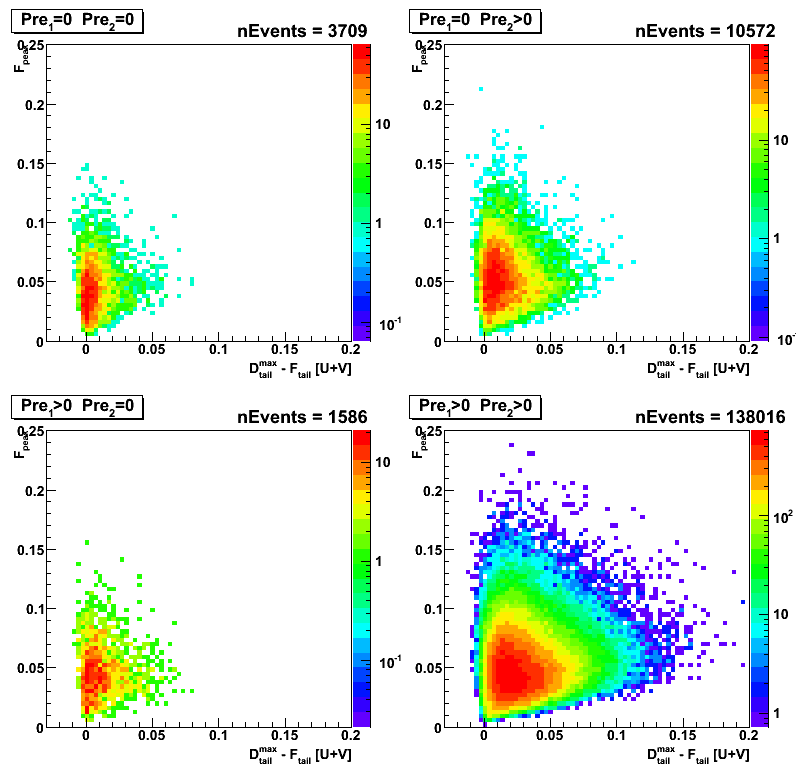
Figure 4:pt(gamma) vs pt(jet) for data-driven gamma-jet MC events (partonic pt 5-35)
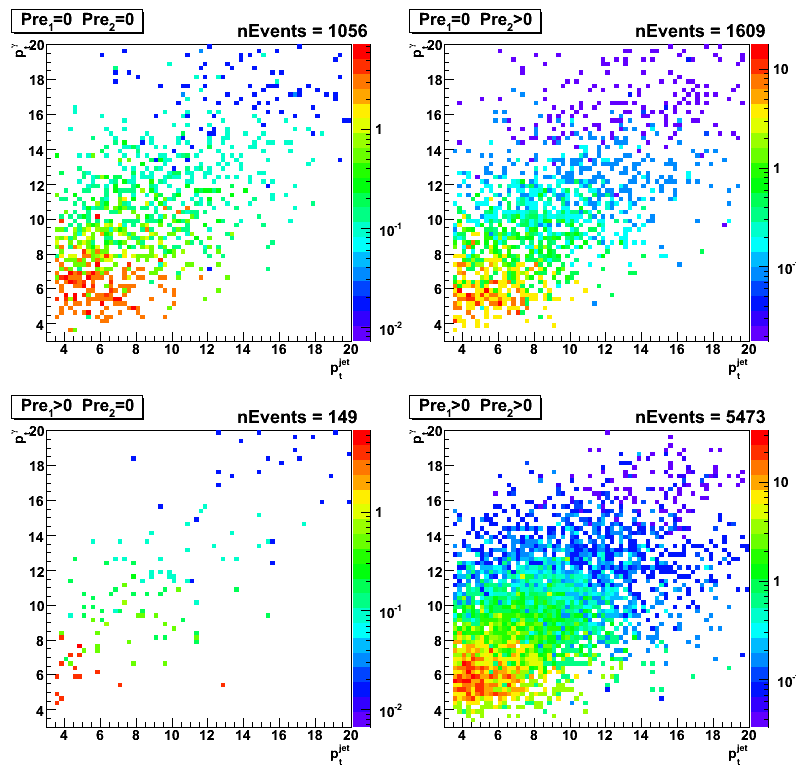
Figure 5:pt(gamma) vs pt(jet) for data-driven jet-jet MC events (partonic pt 3-55)
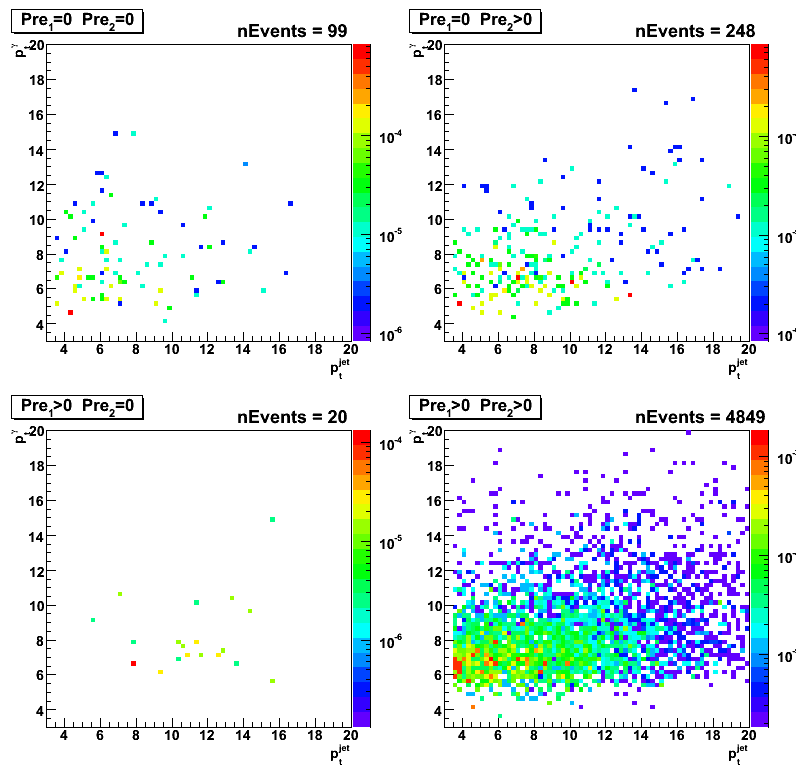
Figure 6:pt(gamma) vs pt(jet) for data (pp Longitudinal 2006)