Run 9 (pp500 and pp200)
Run 9:
The old method was used for the following datasets:
- pp200 RFF low luminosity (day 118)
- pp2pp (FF, end of pp200, days 180-185)
A new 3D method was You do not have access to view this node and used for the following:
- pp500: New Beamline - Dec 8 2009, and preliminary results parts Beamline determination pp500 GeV W triggered events, Beamline determination pp500 GeV W triggered events pt 2, and Old Beamline Constraint Values (Generated Aug 15)
- pp200 RFF
- pp200 FF
The old method was Run 9: pp500 Low Luminosity Fill, but that fill was still at a relatively high luminosity for calibration work (too much pile-up) and the result was not kept, instead using the new method's results.
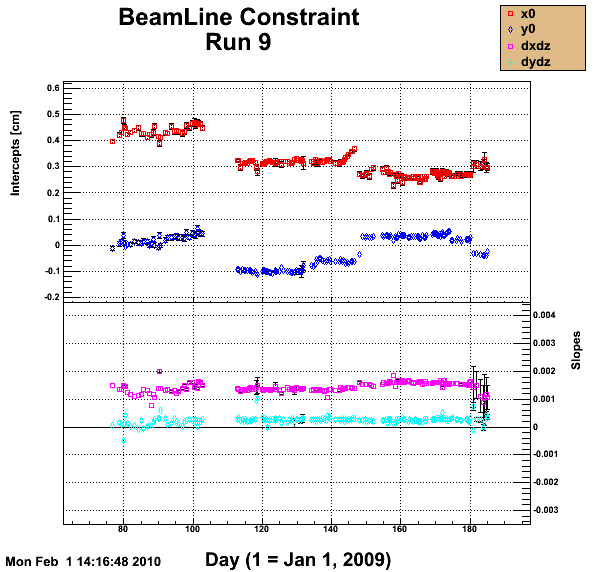
The results as uploaded to the database for Run 9 are plotted here. Major features are the discontinuity between pp500 and pp200 around day 103, the reversal of the magnetic field on day 147, and the switch to pp2pp running around day 180. Also visible are larger errors bars for calibrations using the old method as the new method took advantage of large data productions, improving statistical accuracy.
The query used to obtain files for the pp2pp data is attached.
Run 9: pp500 Low Luminosity Fill
The low luminosity fill was taken using runs 10083130, 133, 139, and 143, with BBC coincidence rates of ~50 kHz, using the BBCMB trigger. Offline QA plots showed evidence for pileup, so I looked for cuts to remove the pileup from the vertex position data (note also that there is some SpaceCharge in this data, which I have not corrected for this exercise, in hopes that any Update on 2006 issues are negligible at this point).
Triggered vertices are usually pretty well centered about z=0 (and the Offline QA plots confirmed that), so the best place to distinguish pileup vertices is at large z (though the vertex seed code stops at +/-100cm). In this particular data, I saw more evidence of pileup in the x positions of the vertices than the y positions. As usual, the Minuit vertex-finder (VFMinuit) was used for the calibration, and I believe its settings remain the same from Run 8.
Here is the mean x position (weighted by 1/errorx) vs. multiplicity (vertical) and rank (horizontal) for 60cm < z < 100cm:
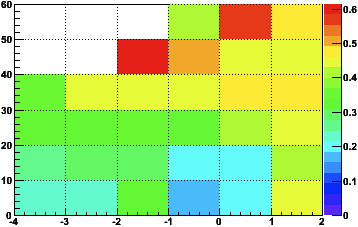
There appears to be a yellow plateau at high rank and multiplicity (with statistical fluctuations at the highest multiplicities), suggesting pileup effects at low rank and multiplicity. Further evidence can be seen by looking at the x positions vs. multiplicity for various z ranges (left: z>80, middle: -5<z<5, right: z<-80):
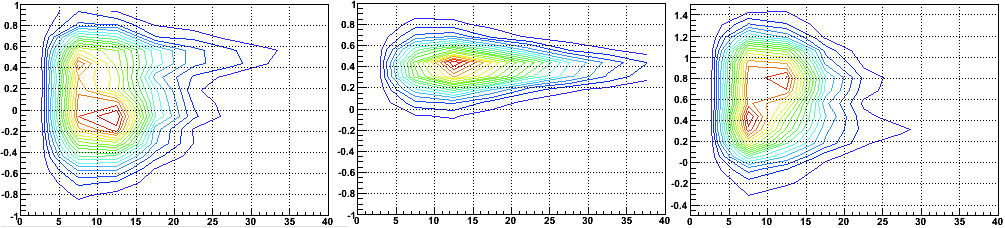
The pileup vertices do not extend as high in multiplicity as triggered vertices, and appear to go from small x (near 0) at large positive z, to x of about 0.8cm at large negative z. This can be seen more clearly in these x vs. z plots for low and high multiplicity (< or > 20, rank<1, histogram maxima are reduced to show low-level contours):
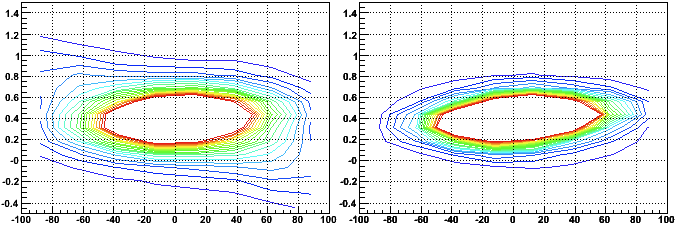
The following cut was chosen to remove the pileup vertices: (rank>1 || (rank>-2&&mult>30))
And the following beamline resulted:
row.x0 = 0.3927906; // cm : x intercept of x vs z line ;
row.dxdz = 0.0009458358; // : slope of x vs z line ;
row.y0 = 0.009295804; // cm : y intercept of y vs z line ;
row.dydz = -3.624923e-05; // : slope of y vs z line ;
row.err_x0 = 0.0003158423; // cm : error on x0 ;
row.err_dxdz = 1.025515e-05; // : error on dxdz ;
row.err_y0 = 0.0003118244; // cm : error on y0 ;
row.err_dydz = 1.011097e-05; // : error on dydz ;
row.chisq_dof = 4.451982; // chi square / dof of fit ;
This is now in the DB.
It may be of interest to note that the pileup vertices do show opposite slopes in both x and y vs. z than the non-pileup. In fact, without the described cut in place, the overall BeamLine fit obtains the opposite slope, obviating the necessity of the cut.
-Gene