Beamline determination pp500 GeV W triggered events pt 2
code is at:
/star/u/rjreed/PPV2009/v4
bfc options to generate log files:
Processing bfc.C(1,150,"VtxSeedCalG pp2009a ITTF BEmcChkStat QAalltrigs btofDat Corr3 OSpaceZ2 OGridLeak3D beamLine -VFMinuit VFPPVnoCTB -dstout evout","/star/data03/daq/2009/Weve/sampler100/st_W_10103033_raw_1180001.daq" ,"st_W_10103033_raw_1180001_1")
Last week - Vx,Vy,Ux,Uy values presented from fit which did Vx,Vy and Ux,Uy seperately and used a truncated log-likelihood where xy and z for each track were considered seperately. There were no uncertainties published.
This week -
I tried a fit of Vx,Ux then Vy,Uy followed by 4 dimensional fit. Regardless of potential used, this fit appeared to simply walk out of bounds. I couldn't even get it to converge on sensible values for MC data set for each pair seperately.... I think this is a dead end.
I tried to fit Simplex-Migrad-Simplex-Migrad for each of the three steps. (Fit Vx,Vy with Ux=0,Uy=0 then fix those values to fit Ux,Uy then use all four values as beginning seed for 4 dimensional fit) This converged more often when used with the proper log-likelihood distribution. Simplex fits always converged. But, it did not always converge upon sensible values. One thing I decided to do was to restrain the fit. This does mean that I have to check to make sure fit values aren't right at the edge of the range, but restraining the fit to |Vx|<2, |Vy|<2,|Ux|<0.2, |Uy|<0.2 seemed to give sensible results for MC sets except for E3 (this one has always been finicky ... I've decided to ignore it because none of the data set fits seem to go wrong in quite the same fashion).
I played around with the potential some more. I tried using a pure gaussian .... No outlier rejection, but we understand how the uncertainties work. But, it didn't really work. The outliers just contributed too much. So, the lorentzian distribution I was using last week would be even worse as it gives slightly more weight to the outliers than a gaussian. So I'm still in search of a better potential, but still using truncated log-likelihood.
| Set | X0 (cm) | Y0 (cm) | Z0 | sig Z | x0 (no tilt) | y0 (no tilt) | ux (fixed xy) | uy (fixed xy) | x0 | y0 | ux | uy | err x | err y |
| E1 | 0.10 | 0.20 | -20 | 50 | 0.10 | 0.20 | 0.00000 | 0.00049 | 0.10 | 0.21 | -0.00004 | 0.00057 | 0.002 | -0.011 |
| E2 | -0.30 | 0.40 | 20 | 50 | -0.31 | 0.39 | -0.00005 | -0.00022 | -0.31 | 0.40 | -0.00003 | -0.00028 | 0.010 | 0.003 |
| E3 | 0.50 | 1.00 | -30 | 0 | 0.51 | 1.01 | 0.00002 | -0.00001 | 1.10 | 0.41 | 0.02000 | -0.02000 | -0.604 | 0.591 |
| E4 | 1.50 | -1.00 | 30 | 0 | 1.43 | -1.00 | 0.00000 | 0.00000 | 1.43 | -1.00 | 0.00000 | 0.00000 | 0.066 | -0.003 |
| E5 | 0.50 | -0.40 | 0 | 0 | 0.50 | -0.38 | -0.01026 | -0.01727 | 0.50 | -0.38 | -0.01022 | -0.01728 | -0.002 | -0.021 |
| E6 | -0.50 | 0.40 | 30 | 0 | -0.57 | 0.48 | 0.00000 | 0.00000 | -0.57 | 0.48 | 0.00000 | 0.00000 | 0.070 | -0.075 |
Table 1. MC set of values with cut-off log-likelihood potential, restrained, fit via the simplex-migrad-simplex-migrad method. Not all sets converged in final Migrad fit
The question still remains, what is the uncertainty? The likelihood curve gives an extremely small value, which I do not believe (>0.001 cm) But, this is what I get when looking at delta Chi^2 = 1 and it matches the returned value on the fit. Now had the distributions been strictly gaussian, the uncertainty would be the sum of d_i^2/sigma_i^2/N^2. But this wouldn't be correct as it weighs all the tracks the same, but tracks with d>dmax shouldn't have the same weight. The result ended up being much larger than I would expect (~0.03-0.07 cm). So, I added the uncertainties of all tracks with dT^2+ery2<dmax^2 and dZ^2/erz^2 < dmax^2. The result looks reasonable.
| Tracks with (dT^2+ery^2<dmax^2 && dZ^2+erz^2<dmax^2) | |||||||||||||||||||
| Set | X0 (cm) | Y0 (cm) | Z0 | sig Z | x0 (no tilt) | y0 (no tilt) | ux (fixed xy) | uy (fixed xy) | x0 | y0 | ux | uy | # t | sum erry2 | sum errz2 | unc xy | unc z | #sx away | #s y away |
| E1 | 0.10 | 0.20 | -20 | 50 | 0.10 | 0.20 | 0.00000 | 0.00049 | 0.10 | 0.21 | -0.00004 | 0.00057 | 536 | 7.06 | 5.84 | 0.013 | 0.011 | 0.124957 | -0.83178 |
| E2 | -0.30 | 0.40 | 20 | 50 | -0.31 | 0.39 | -0.00005 | -0.00022 | -0.31 | 0.40 | -0.00003 | -0.00028 | 551 | 4.89 | 6.07 | 0.009 | 0.011 | 1.118995 | 0.294793 |
| E3 | 0.50 | 1.00 | -30 | 0 | 0.51 | 1.01 | 0.00002 | -0.00001 | 1.10 | 0.41 | 0.02000 | -0.02000 | 613 | 6.09 | 10.13 | 0.010 | 0.017 | -60.8786 | 59.50782 |
| E4 | 1.50 | -1.00 | 30 | 0 | 1.43 | -1.00 | 0.00000 | 0.00000 | 1.43 | -1.00 | 0.00000 | 0.00000 | 504 | 2.79 | 4.48 | 0.006 | 0.009 | 11.85905 | -0.48648 |
| E5 | 0.50 | -0.40 | 0 | 0 | 0.50 | -0.38 | -0.01026 | -0.01727 | 0.50 | -0.38 | -0.01022 | -0.01728 | 712 | 5.73 | 8.60 | 0.008 | 0.012 | -0.24614 | -2.62977 |
| E6 | -0.50 | 0.40 | 30 | 0 | -0.57 | 0.48 | 0.00000 | 0.00000 | -0.57 | 0.48 | 0.00000 | 0.00000 | 641 | 4.61 | 9.83 | 0.007 | 0.015 | 9.76791 | -10.4632 |
Table 2. MC set of values with cut-off log-likelihood potential. Note that sets where ux=uy= 0.00000 appear to be wrong. These sets still need to be looked at in a slightly more rigorous manner.
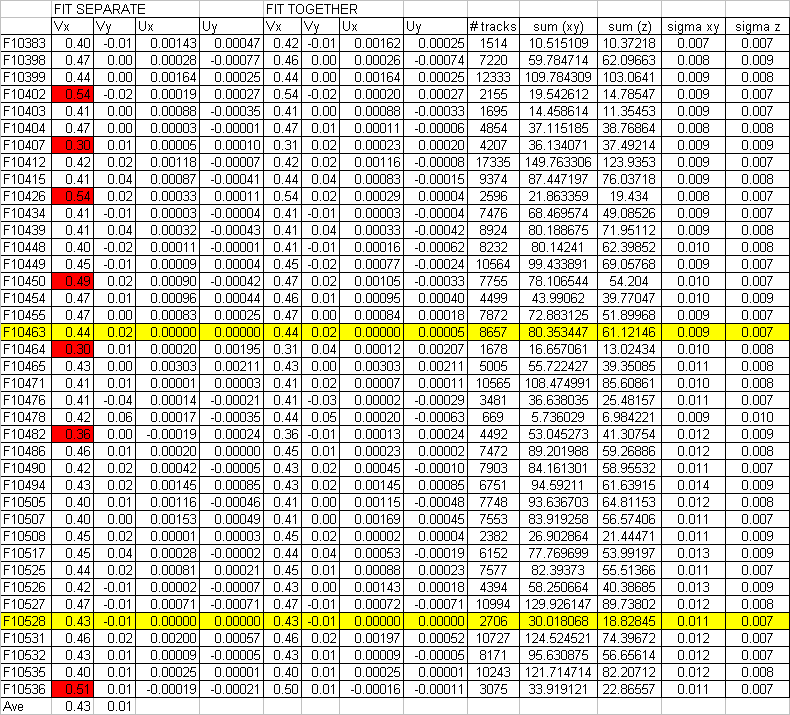
| FIT SEPARATE | FIT TOGETHER | ||||||||||||
| Vx | Vy | Ux | Uy | Vx | Vy | Ux | Uy | # tracks | sum (xy) | sum (z) | sigma xy | sigma z | |
| F10383 | 0.40 | -0.01 | 0.00143 | 0.00047 | 0.42 | -0.01 | 0.00162 | 0.00025 | 1514 | 10.51511 | 10.37218 | 0.007 | 0.007 |
| F10398 | 0.47 | 0.00 | 0.00028 | -0.00077 | 0.46 | 0.00 | 0.00026 | -0.00074 | 7220 | 59.78471 | 62.09663 | 0.008 | 0.009 |
| F10399 | 0.44 | 0.00 | 0.00164 | 0.00025 | 0.44 | 0.00 | 0.00164 | 0.00025 | 12333 | 109.7843 | 103.0641 | 0.009 | 0.008 |
| F10402 | 0.54 | -0.02 | 0.00019 | 0.00027 | 0.54 | -0.02 | 0.00020 | 0.00027 | 2155 | 19.54261 | 14.78547 | 0.009 | 0.007 |
| F10403 | 0.41 | 0.00 | 0.00088 | -0.00035 | 0.41 | 0.00 | 0.00088 | -0.00033 | 1695 | 14.45861 | 11.35453 | 0.009 | 0.007 |
| F10404 | 0.47 | 0.00 | 0.00003 | -0.00001 | 0.47 | 0.01 | 0.00011 | -0.00006 | 4854 | 37.11519 | 38.76864 | 0.008 | 0.008 |
| F10407 | 0.30 | 0.01 | 0.00005 | 0.00010 | 0.31 | 0.02 | 0.00023 | 0.00020 | 4207 | 36.13407 | 37.49214 | 0.009 | 0.009 |
| F10412 | 0.42 | 0.02 | 0.00118 | -0.00007 | 0.42 | 0.02 | 0.00116 | -0.00008 | 17335 | 149.7633 | 123.9353 | 0.009 | 0.007 |
| F10415 | 0.41 | 0.04 | 0.00087 | -0.00041 | 0.44 | 0.04 | 0.00083 | -0.00015 | 9374 | 87.4472 | 76.03718 | 0.009 | 0.008 |
| F10426 | 0.54 | 0.02 | 0.00033 | 0.00011 | 0.54 | 0.02 | 0.00029 | 0.00004 | 2596 | 21.86336 | 19.434 | 0.008 | 0.007 |
| F10434 | 0.41 | -0.01 | 0.00003 | -0.00004 | 0.41 | -0.01 | 0.00003 | -0.00004 | 7476 | 68.46957 | 49.08526 | 0.009 | 0.007 |
| F10439 | 0.41 | 0.04 | 0.00032 | -0.00043 | 0.41 | 0.04 | 0.00033 | -0.00042 | 8924 | 80.18868 | 71.95112 | 0.009 | 0.008 |
| F10448 | 0.40 | -0.02 | 0.00011 | -0.00001 | 0.41 | -0.01 | 0.00016 | -0.00062 | 8232 | 80.14241 | 62.39852 | 0.010 | 0.008 |
| F10449 | 0.45 | -0.01 | 0.00009 | 0.00004 | 0.45 | -0.02 | 0.00077 | -0.00024 | 10564 | 99.43389 | 69.05768 | 0.009 | 0.007 |
| F10450 | 0.49 | 0.02 | 0.00090 | -0.00042 | 0.47 | 0.02 | 0.00105 | -0.00033 | 7755 | 78.10654 | 54.204 | 0.010 | 0.007 |
| F10454 | 0.47 | 0.01 | 0.00096 | 0.00044 | 0.46 | 0.01 | 0.00095 | 0.00040 | 4499 | 43.99062 | 39.77047 | 0.010 | 0.009 |
| F10455 | 0.47 | 0.00 | 0.00083 | 0.00025 | 0.47 | 0.00 | 0.00084 | 0.00018 | 7872 | 72.88313 | 51.89968 | 0.009 | 0.007 |
| F10463 | 0.44 | 0.02 | 0.00000 | 0.00000 | 0.44 | 0.02 | 0.00000 | 0.00005 | 8657 | 80.35345 | 61.12146 | 0.009 | 0.007 |
| F10464 | 0.30 | 0.01 | 0.00020 | 0.00195 | 0.31 | 0.04 | 0.00012 | 0.00207 | 1678 | 16.65706 | 13.02434 | 0.010 | 0.008 |
| F10465 | 0.43 | 0.00 | 0.00303 | 0.00211 | 0.43 | 0.00 | 0.00303 | 0.00211 | 5005 | 55.72243 | 39.35085 | 0.011 | 0.008 |
| F10471 | 0.41 | 0.01 | 0.00001 | 0.00003 | 0.41 | 0.02 | 0.00007 | 0.00011 | 10565 | 108.475 | 85.60861 | 0.010 | 0.008 |
| F10476 | 0.41 | -0.04 | 0.00014 | -0.00021 | 0.41 | -0.03 | 0.00002 | -0.00029 | 3481 | 36.63804 | 25.48157 | 0.011 | 0.007 |
| F10478 | 0.42 | 0.06 | 0.00017 | -0.00035 | 0.44 | 0.05 | 0.00020 | -0.00063 | 669 | 5.736029 | 6.984221 | 0.009 | 0.010 |
| F10482 | 0.36 | 0.00 | -0.00019 | 0.00024 | 0.36 | -0.01 | 0.00013 | 0.00024 | 4492 | 53.04527 | 41.30754 | 0.012 | 0.009 |
| F10486 | 0.46 | 0.01 | 0.00020 | 0.00000 | 0.45 | 0.01 | 0.00023 | 0.00002 | 7472 | 89.20199 | 59.26886 | 0.012 | 0.008 |
| F10490 | 0.42 | 0.02 | 0.00042 | -0.00005 | 0.43 | 0.02 | 0.00045 | -0.00010 | 7903 | 84.1613 | 58.95532 | 0.011 | 0.007 |
| F10494 | 0.43 | 0.02 | 0.00145 | 0.00085 | 0.43 | 0.02 | 0.00145 | 0.00085 | 6751 | 94.59211 | 61.63915 | 0.014 | 0.009 |
| F10505 | 0.40 | 0.01 | 0.00116 | -0.00046 | 0.41 | 0.00 | 0.00115 | -0.00048 | 7748 | 93.6367 | 64.81153 | 0.012 | 0.008 |
| F10507 | 0.40 | 0.00 | 0.00153 | 0.00049 | 0.41 | 0.00 | 0.00169 | 0.00045 | 7553 | 83.91926 | 56.57406 | 0.011 | 0.007 |
| F10508 | 0.45 | 0.02 | 0.00001 | 0.00003 | 0.45 | 0.02 | 0.00002 | 0.00004 | 2382 | 26.90286 | 21.44471 | 0.011 | 0.009 |
| F10517 | 0.45 | 0.04 | 0.00028 | -0.00002 | 0.44 | 0.04 | 0.00053 | -0.00019 | 6152 | 77.7697 | 53.99197 | 0.013 | 0.009 |
| F10525 | 0.44 | 0.02 | 0.00081 | 0.00021 | 0.45 | 0.01 | 0.00088 | 0.00023 | 7577 | 82.39373 | 55.51366 | 0.011 | 0.007 |
| F10526 | 0.42 | -0.01 | 0.00002 | -0.00007 | 0.43 | 0.00 | 0.00143 | 0.00018 | 4394 | 58.25066 | 40.38685 | 0.013 | 0.009 |
| F10527 | 0.47 | -0.01 | 0.00071 | -0.00071 | 0.47 | -0.01 | 0.00072 | -0.00071 | 10994 | 129.9261 | 89.73802 | 0.012 | 0.008 |
| F10528 | 0.43 | -0.01 | 0.00000 | 0.00000 | 0.43 | -0.01 | 0.00000 | 0.00000 | 2706 | 30.01807 | 18.82845 | 0.011 | 0.007 |
| F10531 | 0.46 | 0.02 | 0.00200 | 0.00057 | 0.46 | 0.02 | 0.00197 | 0.00052 | 10727 | 124.5245 | 74.39672 | 0.012 | 0.007 |
| F10532 | 0.43 | 0.01 | 0.00009 | -0.00005 | 0.43 | 0.01 | 0.00009 | -0.00005 | 8171 | 95.63088 | 56.65614 | 0.012 | 0.007 |
| F10535 | 0.40 | 0.01 | 0.00025 | 0.00001 | 0.40 | 0.01 | 0.00025 | 0.00001 | 10243 | 121.7147 | 82.20712 | 0.012 | 0.008 |
| F10536 | 0.51 | 0.01 | -0.00019 | -0.00021 | 0.50 | 0.01 | -0.00016 | -0.00011 | 3075 | 33.91912 | 22.86557 | 0.011 | 0.007 |
| Ave | 0.43 | 0.01 |
|
||||||||||
Table 3: data. Values in red are quite a bit away from the average, I just want to check them a little more closely. Files in yellow have no tilt and given what I saw above in MC the data I think these files will also need a little bit of work.
Last thing is how to get from unc in x and z to uncertainty in Ux and Uz.
- rjreed's blog
- Login or register to post comments