2009.08.24 Test of corrected EEMC geometry
Test of corrected EEMC geometry (bug 1618)
Monte-Carlo setup:
- One particle per event (photons, electrons, and pions)
- Full STAR 2006 geometry.
In Kumac file: detp geom y2006g; gexec $STAR_LIB/geometry.so - Flat in eta (1.08-2.0), phi (0,2pi), and pt (3-30 GeV)
- Using A2Emaker to get reconstructed Tower/SMD energy (no EEMC SlowSimulator in chain)
what assumes fixed sampling fraction of 0.05 (5%)
Some definitions:
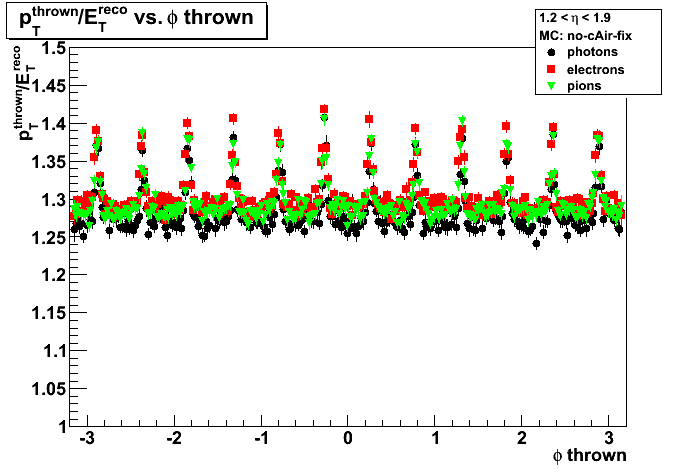
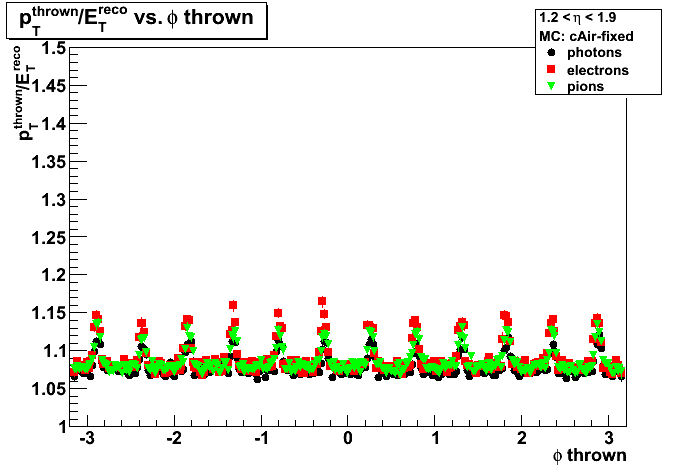
- Et correction factor : average p_T^thrown / E_T^{reco}.
E_T^{reco} is the total energy in the Endcap Calorimeter (from A2Emaker) - Sampling fraction: average 0.05 * Energy^{reco} / Energy^thrown.
- SMD energy: average energy in all strips fired (u-plane used for this post)
- Number of SMD strips fired: average total number of strips fired (u-plane used for this post)
Notations used in the plots:
- Left plots: no cAir fix
- Right plots: cAir-fixed
- Photons: black
- Electrons: red
- Pions: green
Et correction
Note: compare "Left" plots with Brians old results
Figure 1a: Et correction factor vs. pt thrown
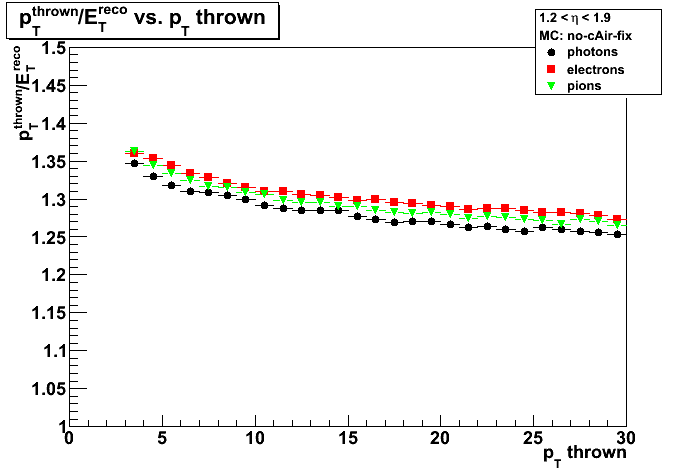
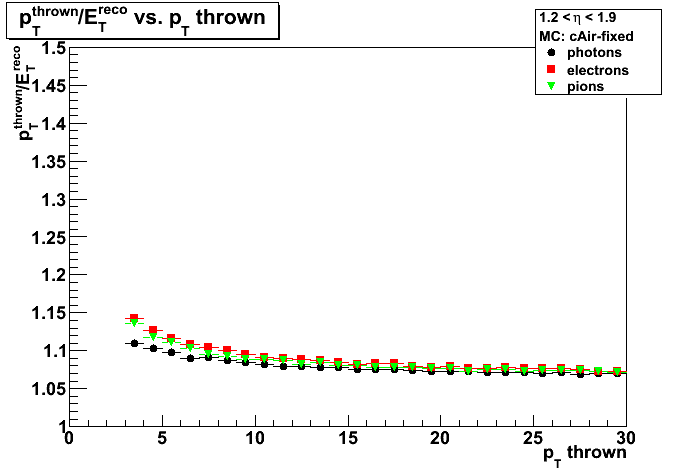
Figure 1b: Et correction factor vs. eta thrown


Figure 1c: Et correction factor vs. phi thrown
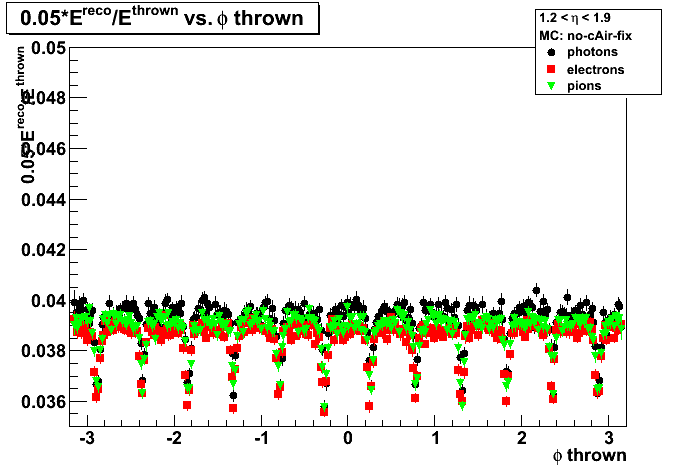
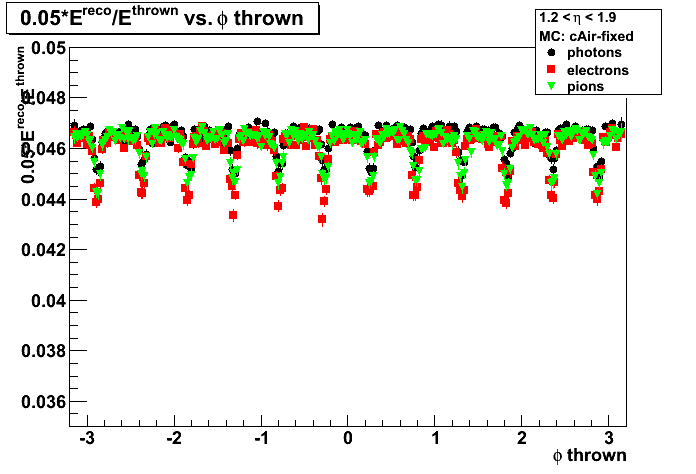
Sampling fraction
Note: compare "Right" plots with Jason results with EEMC only geometry
Figure 2a: Sampling fraction vs. pt thrown
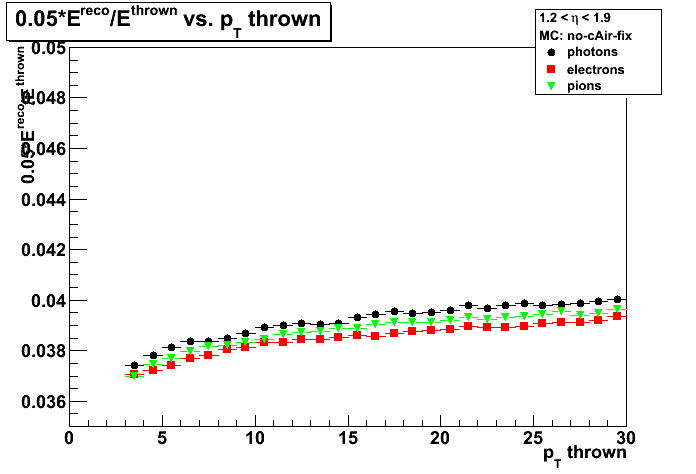
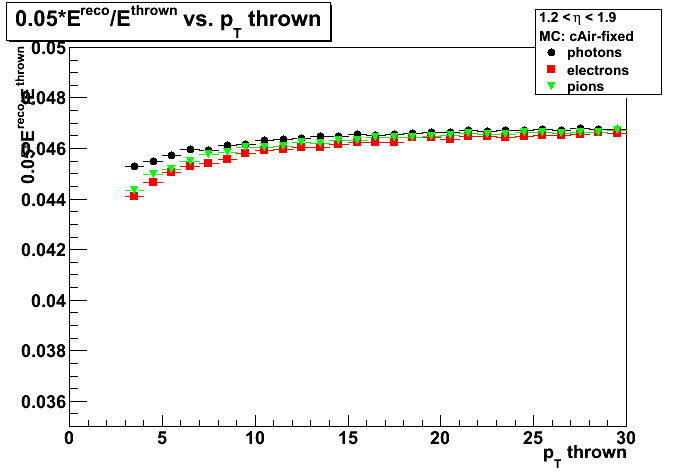
Figure 2b: Sampling fraction vs. energy thrown
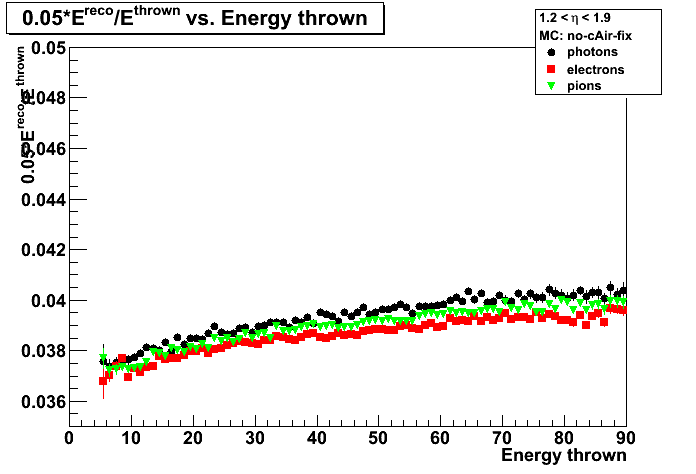
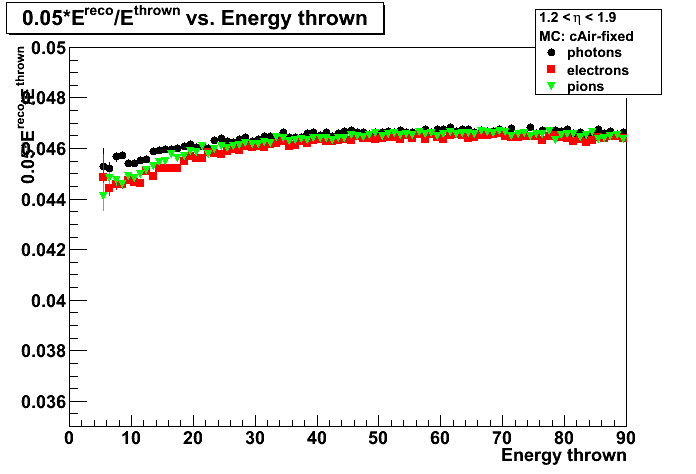
Figure 2c: Sampling fraction vs. eta thrown

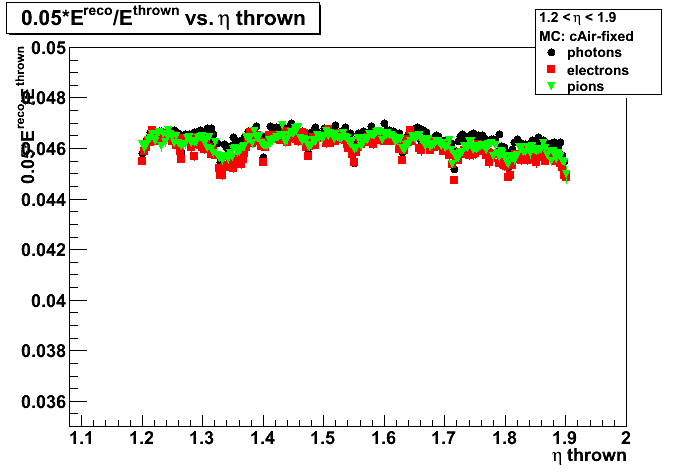
Figure 2d: Sampling fraction vs. phi thrown
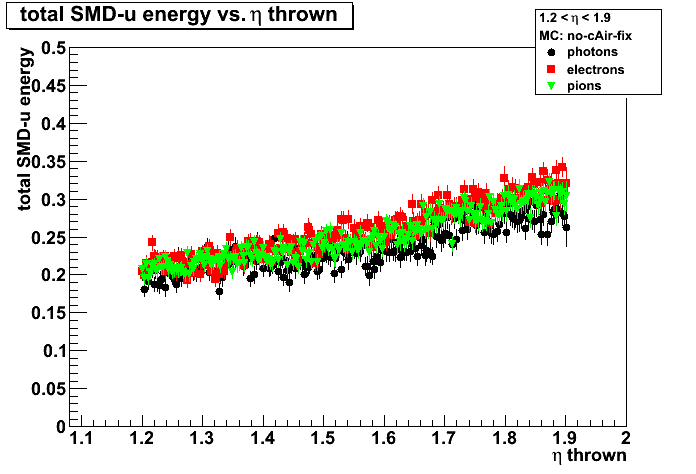
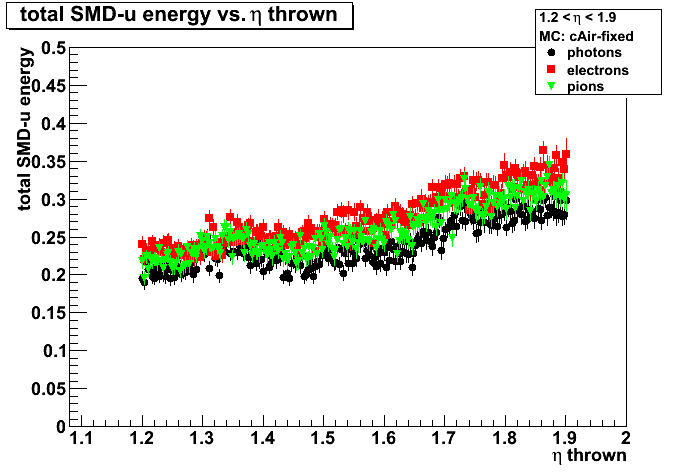
SMD energy
Figure 3a: SMD energy vs. energy thrown


Figure 3b: SMD energy vs. eta thrown
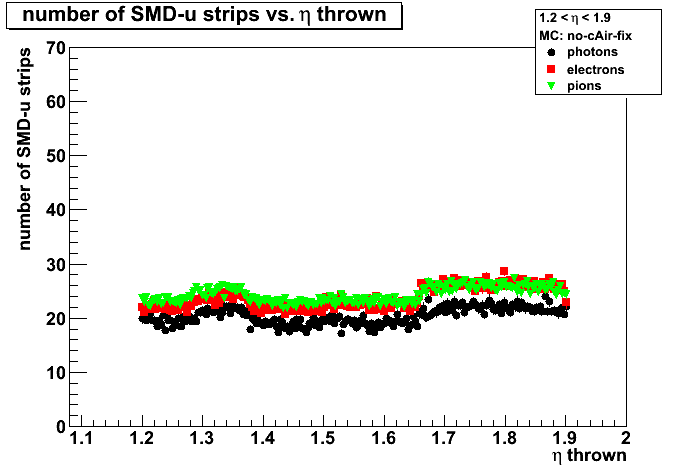
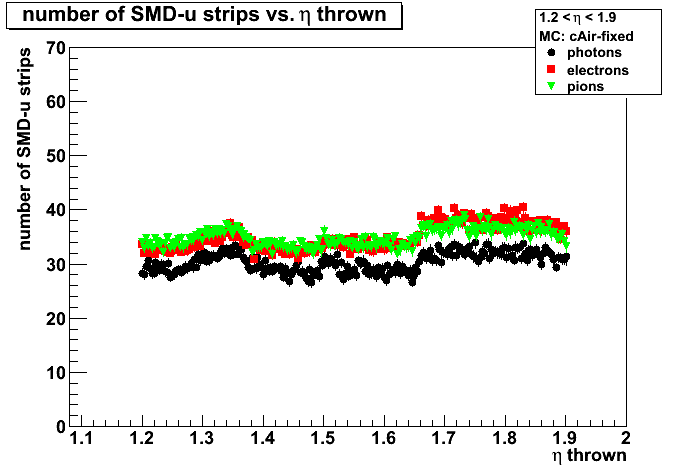
Number of SMD strips fired
Figure 4a: Number of SMD strips fired vs. energy thrown

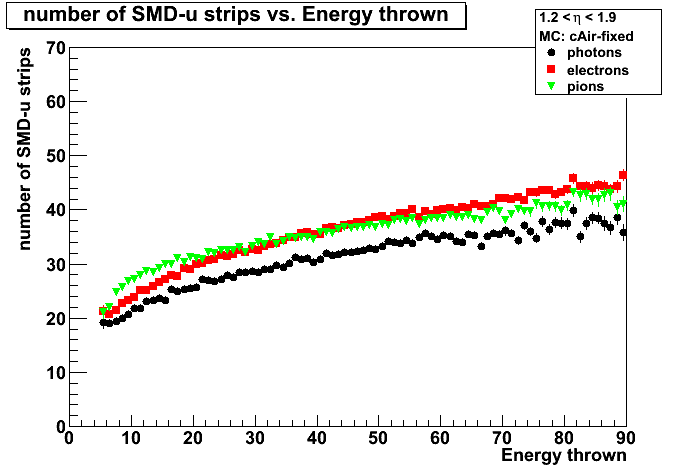
Figure 4b: Number of SMD strips fired vs. eta thrown