Abstract: The EEMC geometry (ecalgeo.g) has been modified to
remove a bug which resulted in approximately 1 radiation length of lead being inserted at the shower-maximum depth. In this blog entry, the response of the modified geometry to various particles is determined over a range in energy from 0.5 to 200 GeV. For photons we find that the linearity of the simulated EEMC sampling fraction is good to better than 1% over the range of energies studied. Electrons above 2 GeV and neutral pions above 7 GeV exhibit similar linearities.
1.0 Monte Carlo Geometry and Analysis
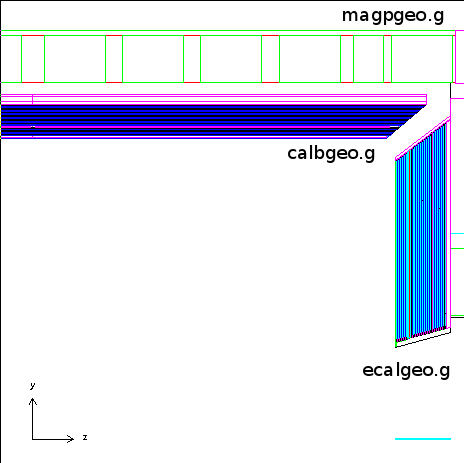
The MC is configured with low EM cuts, only the endcap, magnet, and barrel are created. (No material in front of the EEMC).
detp geom y2006g LOW_EM
make geometry/cavegeo
make geometry/calbgeo
make geometry/magpgeo
make geometry/ecalgeo
For each event, the energy deposited in the endcap scintillator (corrected by Birk's law) is filled into a histogram. All scintillator tiles within the endcap are summed toghether to obtain the total energy deposit. The sampling fraction is calculated as the total energy deposited within the 24 scintillator layers divided by the incident energy of the particle. No corrections for brightness or thickness of layers and/or number of readout fibers is performed.
2.0 Response to particles which primarily interact electromagnetically
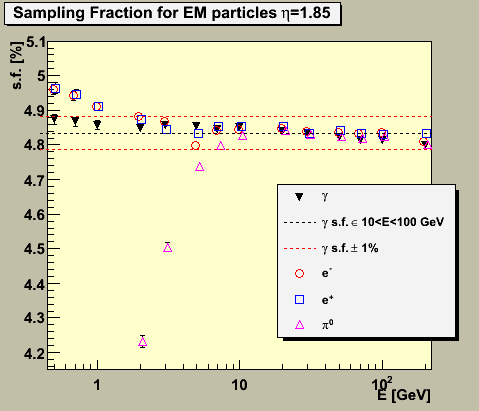
Photons, electrons, positrons and neutral pions are thrown with kinetic energies ranging between 0.5 and 200 GeV at pseudorapidity of about 1.85 (the center of etabin 2). Figure 2.1 below shows the sampling fraction for each of these particles. A fit to the photon's sampling fraction over the range 10 to 100 GeV is shown (dotted black line) along with its +/- 1% envelope. The sampling fraction for photons is flat over this range. The sampling fraction for other EM particles is similarly flat above a given energy... about 2 GeV for electrons and positrons, about 7 GeV for neutral pions.
Figure 2.1 -- Sampling fraction for photons, electrons, positrons and π0-->γγ. Photons are shown as the black triangles, electrons and positrons as the open circle (blue) and square (red), and neutral pions as the magenta open triangles. The black line indicates the average s.f. of the photons fit over the range 10 < E < 100 GeV. The red lines indicate +/- 1% variations around this value.
3.0 Response to particles which primarily interact hadronically (plus muons)
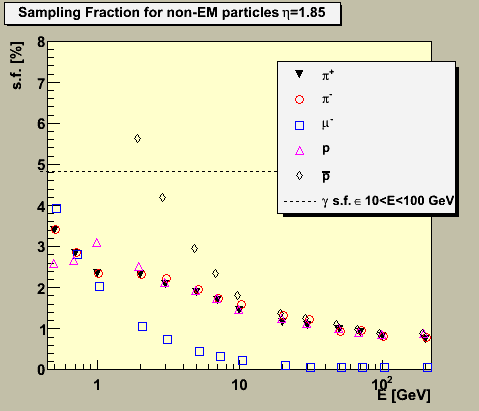
Charged pions, protons, antiprotons and muons are thrown at the fixed EEMC geometry with kinetic energies ranging between 0.5 and 200 GeV at pseudorapidity of about 1.85 (the center of etabin 2). Figure 3.1 below shows the sampling fraction calculated for each of these particles vs. the kinetic energy of the particle(*). The fit to the photon's sampling fraction over the range 10 to 100 GeV is shown (dotted black line) for comparison.
Figure 3.1 -- Sampling fraction for charged pions, muons, protons and antiprotons. Solid black triangles indicate the p+, open circles the p-. The blue open boxes indicate the muons. The magenta open triangles the protons, and the black open diamonds the anti-protons.
(*) n.b. The geant manual would claim that I am actually using the total energy here. I don't believe the manual, because geant still gives a result for protons when E<1 GeV. This distinction really only matters for low energy protons and pbars. At E=3 GeV, kinetic and total energy differ by <10%.
4.0 Sampling fraction in each etabin
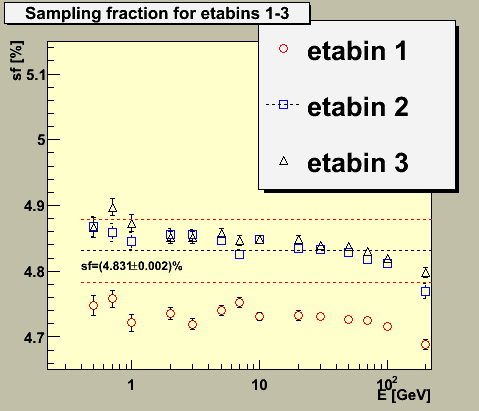
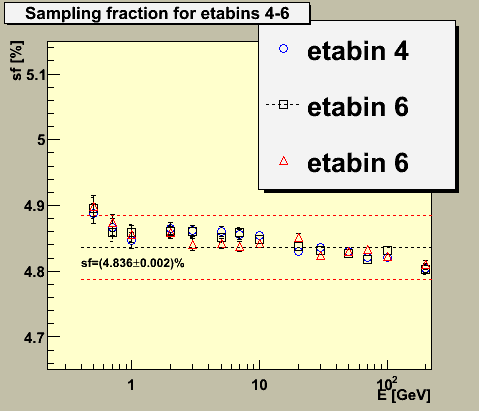
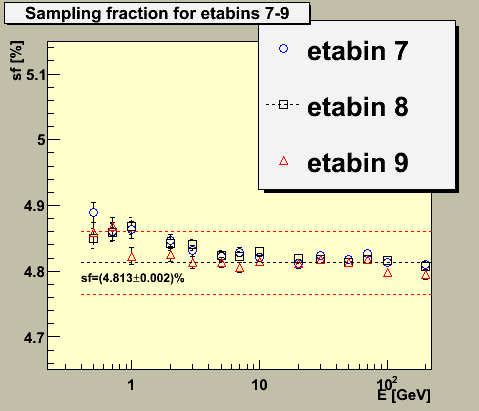
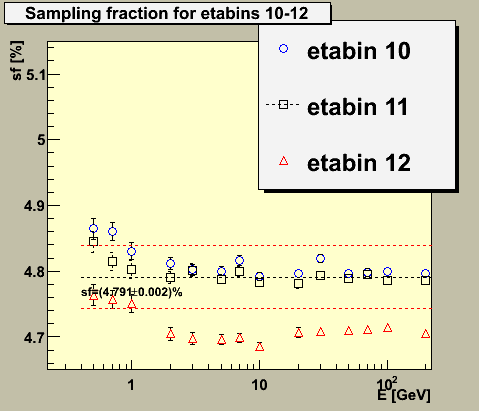
The sampling fraction for gammas in each pseudorapidity bin is shown in figure 4.1. Each plot shows the sampling fraction vs incident energy for a group of three adjacent eta bins. The dashed black line corresponds to the sampling fraction averaged over 10 < E < 100 GeV for the center eta bin in the group. The dashed red lines are a +/- 1% envelope centered on that sampling fraction. The sampling fraction averaged over this region varies by < 1% for etabins 2 - 11. Edge effects are apparent in eta bins 1 and 12, as one would expect.
Figure 4.1 -- Sampling fraction in 4 groups of etabins, covering the full range of the endcap. For each eta bin, photons where incident on the center of a tower. Once again, the energy deposited in all megatiles was summed toghether to compute the sampling fraction.
