07 Jul
July 2009 posts
2009.07.21 EEMC tower response in Monte-Carlo
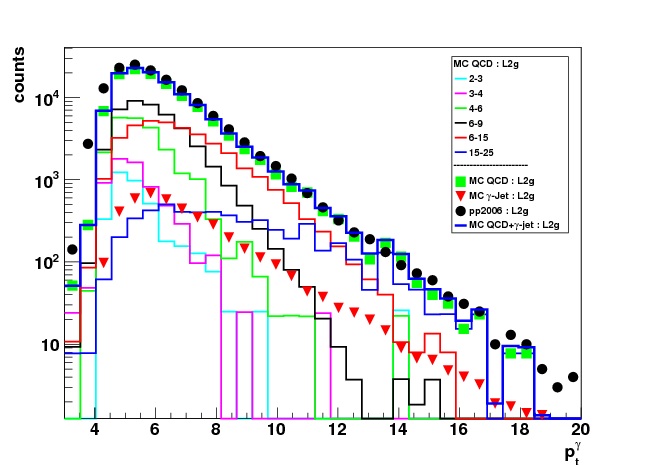
Data set and cuts:
- gamma-jet filtered Monte-Carlo
- Di-jet events from the jet finder (jets threshold: 3.5 GeV)
- parton pt bin 3-4 GeV (see pt_gamma distributions for various parton pt bins)
- Thrown photon pseudo-rapidity: eta in [1-2] range
- Requires to reconstruct photon candidate in the EEMC
Figure 1: Average ratio: pt_true / (pt_reco/1.3) vs. pt_reco (GeV/c)
- Introduce 1.3 factor here to remove the effect of the fudge factor in slow simulator
- Since a limited partonic pt range (3-4 GeV) is used for this study,
there is an "artificial" increase of the plotted ratio in pt_gamma > 6 GeV range - Fig. 1 reflects similar features (over a limited pt range) as those found by Hal
in his single photon study (see slide 6 of SimulationStudies.ppt presentation)
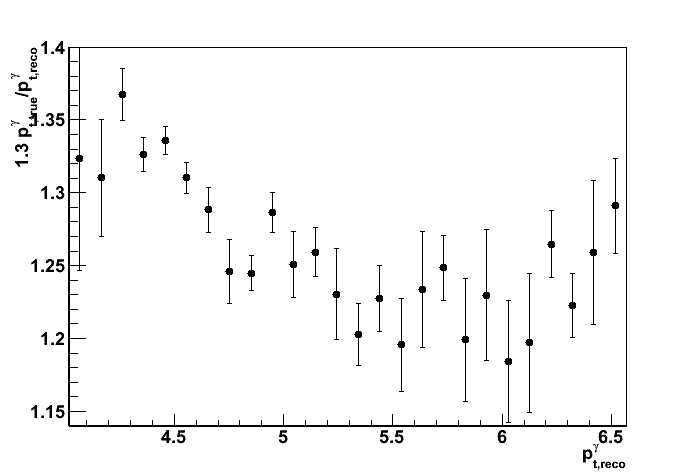
Figure 2:
Average momentum difference: pt_true - (pt_reco/1.3) vs. pt_reco (GeV/c)
- Fig. 2 shows that on average in GEANT Monte-Carlo we miss ~1GeV independent on the photon pt.
EEMC detector response can be still linear even if the ratio in Fig. 1 is not flat. - Usage of fixed 1.3 (or others, like 1.25) fudge factors are not justified.
- It seems that using pt-dependent fudge factor (like it is done in this Jason's study)
is also unjustified, since the same effects (flat ratio of pt_reco/pt_true ~ 1)
can be reached by subtracting 1 GeV from the cluster energy (See Fig. 3).
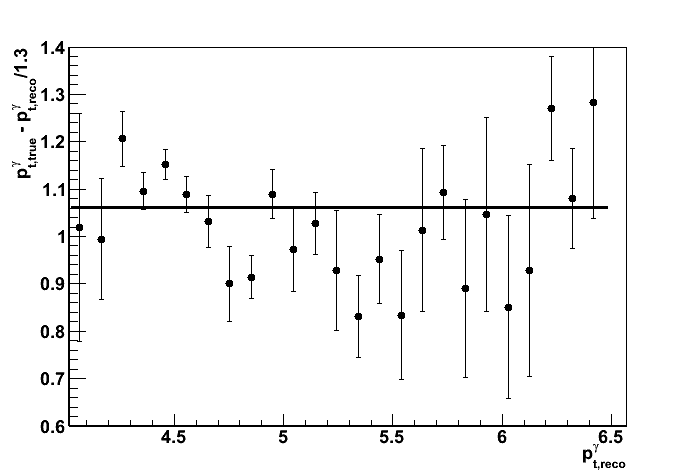
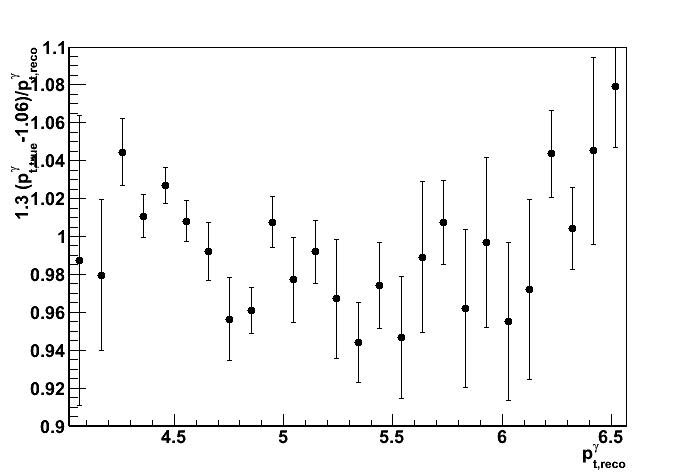
Figure 3: Average ratio: (pt_true -1.06) (pt_reco/1.3) vs. pt_reco (GeV/c)
Similar to Fig. 1, but with the true photon pt reduced by 1.06 GeV
Resulting true/reco pt ratio is flat in 4-6 GeV range.
Before further pursuing our efforts in tuning the tower energy response in the Monte-Carlo,
needs to address the observed energy loss difference in the fisrt layer of the BEMC/EEMC detector.
See Jason's blog post from 2009.07.16 for more details:
Comparison muon energy deposit in the 1st BEMC/EEMC layers