- jwebb's home page
- Posts
- 2019
- 2018
- 2017
- 2016
- 2015
- 2014
- 2013
- November (1)
- October (1)
- September (1)
- July (1)
- June (1)
- April (1)
- March (3)
- February (1)
- January (1)
- 2012
- 2011
- December (2)
- September (3)
- August (5)
- July (6)
- June (6)
- May (1)
- April (5)
- March (5)
- February (2)
- January (2)
- 2010
- December (3)
- October (3)
- September (2)
- August (2)
- June (2)
- May (4)
- April (4)
- March (2)
- February (4)
- January (10)
- 2009
- 2008
- 2007
- 2006
- July (1)
- My blog
- Post new blog entry
- All blogs
Data / MC comparisons for isolation cut, take 2
Abstract: We apply an energy-dependent correction to the MC energy deposit in the Monte Carlo, in order to "fix" the sampling fraction problem. Data / MC comparisons are made.
1.0 pT-dependent Fudge Factor
Prompt photon events are thrown in the MC. In the slow simulator we apply a fudge factor which depends on the energy deposited. (Actually, the ADC from the fast simulaotr). The fudge factor has the form...
F = 1.184 + e^(-1.819 - 0.134 * fastADC * 60.0/4096.0 )
This is derived from a fit to the "fudge factor" vs pT which Hal and Keith looked at recently.
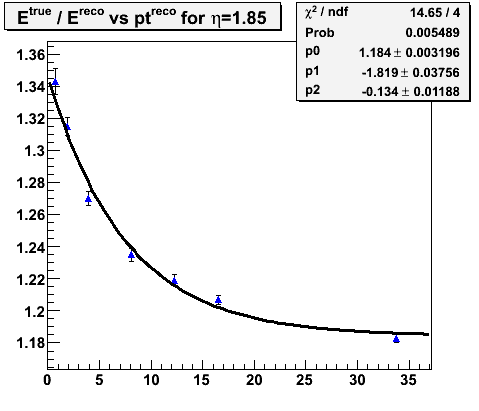
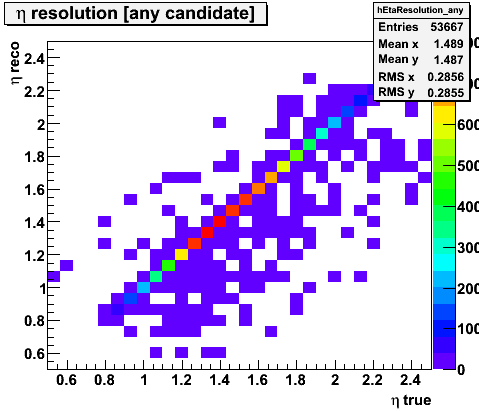
Figure 1 below compares the reconstructed pT of the photon to the thrown pT of the photon. The match is good but not perfect. Some additional adjustments need to be made to the fudge factor. Figure 2 shows the matching between reconstructed and thrown rapidity and phi.
Figure 1 -- Reconstructed pT vs true pT of the thrown prompt photon.
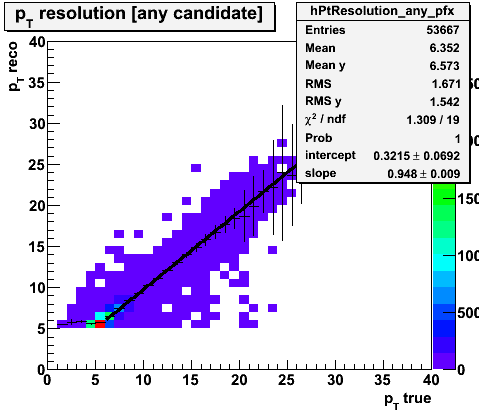
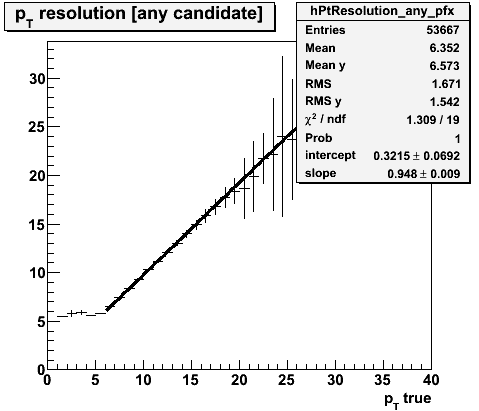
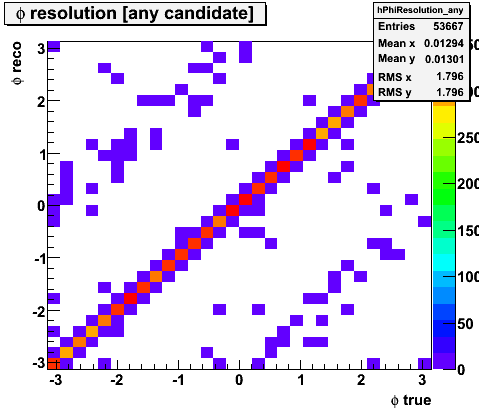
Figure 2 -- Reconstructed eta (phi) vs true eta (phi) of the thrown prompt photon.
2.0 Data / MC for isolation Cut
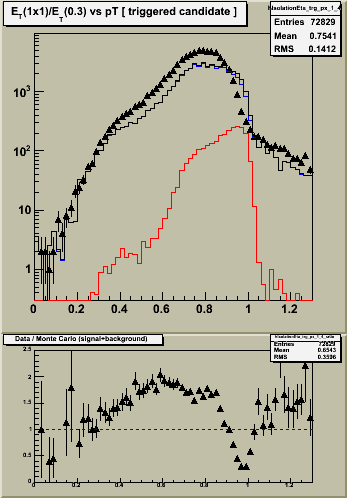
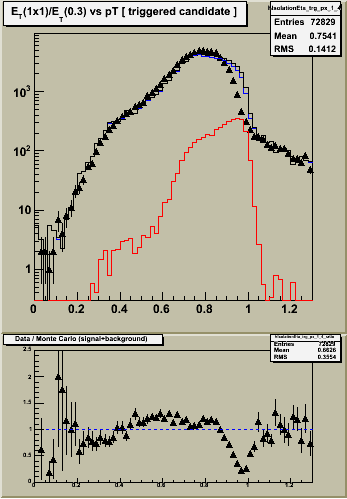
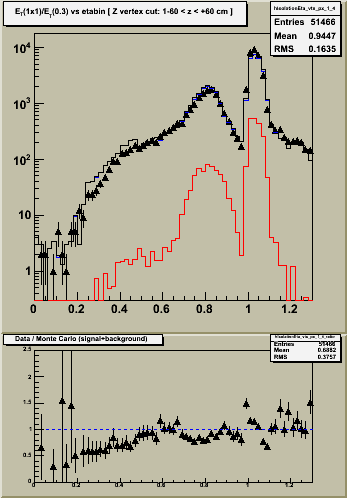
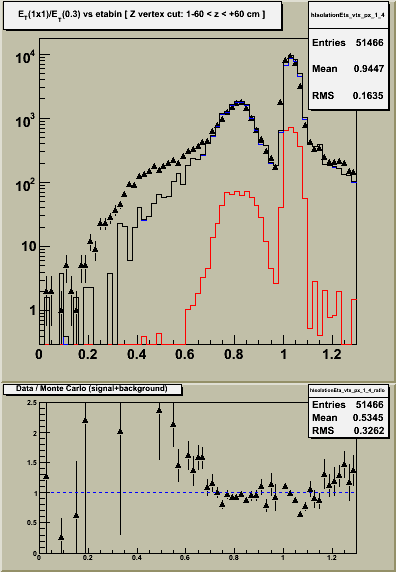
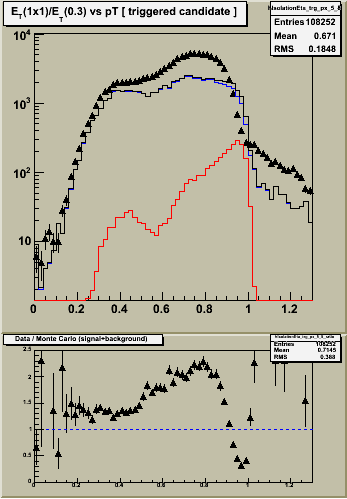
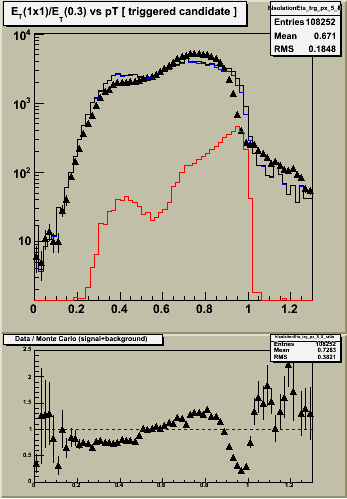
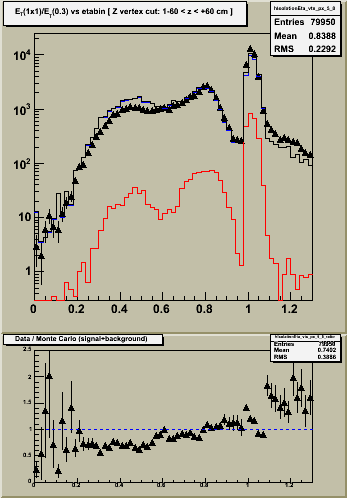
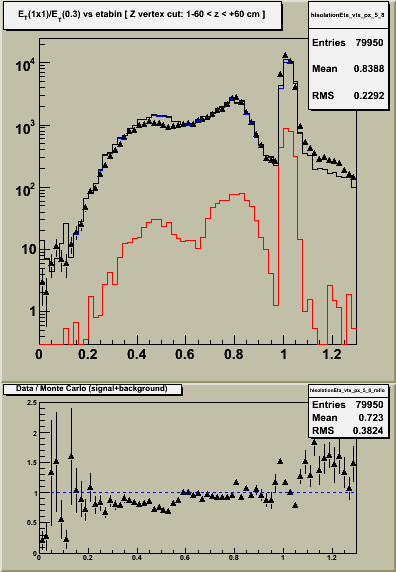
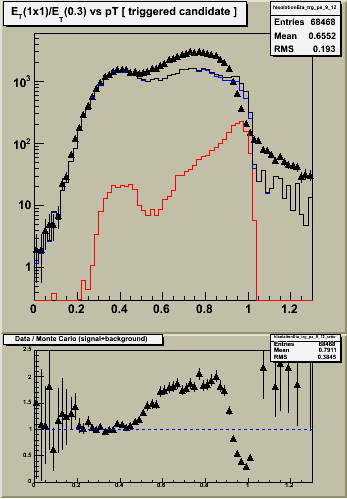
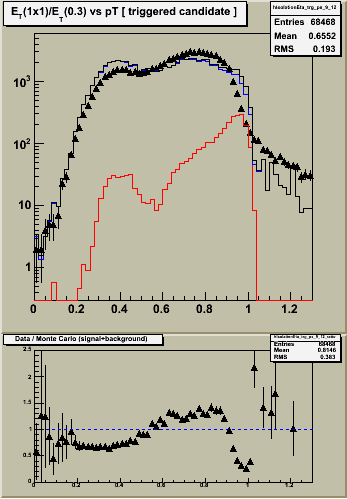
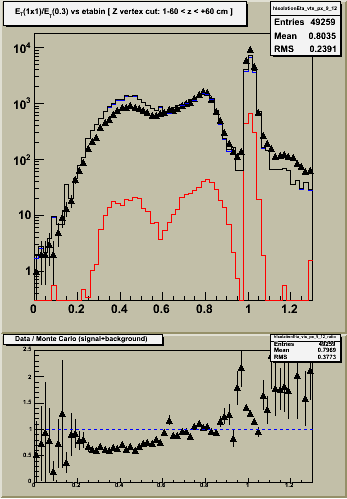
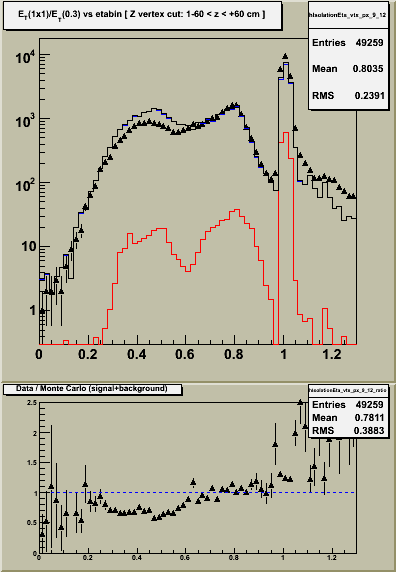
In the figures below, I show the data / MC for the isolation ratio RI. The quantity on the x-axis is RI, defined as the ET of the gamma candidate divided by the sum of tower and track pT's within a radius of 0.3. The ET of the gamma is computed from the energy in a single tower, and a correction based on the position of the photon within the tower (similar to what Ahmed does in the barrel).
Three different "sets" are shown. Between each set I make some changes in the way the MC is reconstructed and/or apply quality cuts to the towers and tracks which are used to form the isolation cut and other observables. Set A uses the MIT Monte Carlo sample and the Gamma Maker "out of the box"... i.e. with no modifications at all. In Set B, I apply a pT dependent "fudge factor" to the energy recorded in each EEMC tower, as described above. In Set C, I add a quality cut to the tracks and towers which are used to form the observable distributions. Within each set, the RI distribution is plotted in the inner, middle and outer eta rings of the EEMC. Also, there are PDF files available for sets B and C with many more distributions (and some notes about what I think about them).
|
Set A
Configuration:
Default MC
Default Gamma Maker cuts
|
Set B
Configuration:
MC with pT dependent fudge factors
Default Gamma Maker cuts
|
Set C
Configuration:
MC with pT dependent fudge factors
ET and pT > 1.0 GeV for towers/tracks to be included in sums.
|
Set D
Configuration:
Set C + pT,eta dependent fudge factors and 2 MeV threshold on pre/post
|
Set E
Configuration:
Set D, but Alice's energy function divided by 1.15.
|
| Detailed data/MC comparisons |
Detailed data / MC comparisons | Detailed data / MC comparisons | Detailed data/ MC comparisons | |
|
Figure 3a -- Data / MC for the isolation ratio Ri described in the text, for eta bins 1-4. The energy of each tower in the MC sample is scaled by a fudge factor of 1.32.
|
Figure 3b -- Data / MC for the isolation ratio Ri described in the text, for eta bins 1-4. The energy of each tower in the MC sample is scaled by a pT-dependent fudge factor.
|
Figure 3c -- Data / MC for the isolation ratio Ri described in the text, for eta bins 1-4. The energy of each tower in the MC sample is scaled by a pT-dependent fudge factor.
|
Figure 3d -- Data / MC for the isolation ratio Ri described in the text, for eta bins 1-4. The energy of each tower in the MC sample is scaled by a pT and eta-dependent fudge factor. 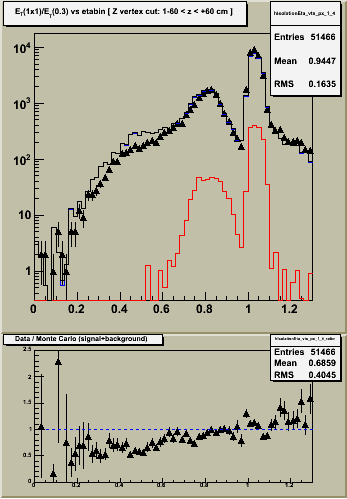 |
Figure 3e --Data / MC for the isolation ratio Ri described in the text, for eta bins 1-4. The energy of each tower in the MC sample is scaled by a pT and eta-dependent fudge factor.
|
|
Figure 4a -- Data / MC for the isolation ratio Ri described in the text, for eta bins 5-8. The energy of each tower in the MC sample is scaled by a fudge factor of 1.32.
|
Figure 4b -- Data / MC for the isolation ratio Ri described in the text, for eta bins 5-8. The energy of each tower in the MC sample is scaled by a pT-dependent fudge factor
|
Figure 4c -- Data / MC for the isolation ratio Ri described in the text, for eta bins 5-8. The energy of each tower in the MC sample is scaled by a pT-dependent fudge factor
|
Figure 4d -- Data / MC for the isolation ratio Ri described in the text, for eta bins 5-8. The energy of each tower in the MC sample is scaled by a pT and eta-dependent fudge factor 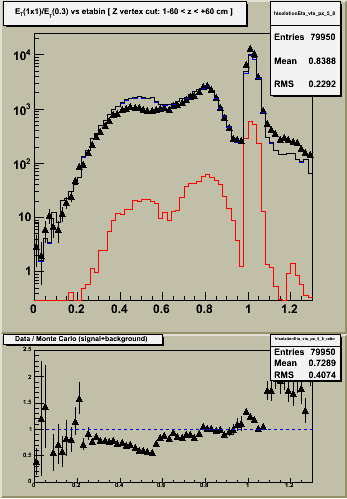 |
Figure 4e -- Data / MC for the isolation ratio Ri described in the text, for eta bins 5-8. The energy of each tower in the MC sample is scaled by a pT and eta-dependent fudge factor
|
|
Figure 5a -- Data / MC for the isolation ratio Ri described in the text, for eta bins 9-12. The energy of each tower in the MC sample is scaled by a fudge factor of 1.32.
|
Figure 5b -- Data / MC for the isolation ratio Ri described in the text, for eta bins 9-12. The energy of each tower in the MC sample is scaled by a pT-dependent fudge factor
|
Figure 5c -- Data / MC for the isolation ratio Ri described in the text, for eta bins 9-12. The energy of each tower in the MC sample is scaled by a pT-dependent fudge factor
|
Figure 5d -- Data / MC for the isolation ratio Ri described in the text, for eta bins 9-12. The energy of each tower in the MC sample is scaled by a pT and-dependent fudge factor. 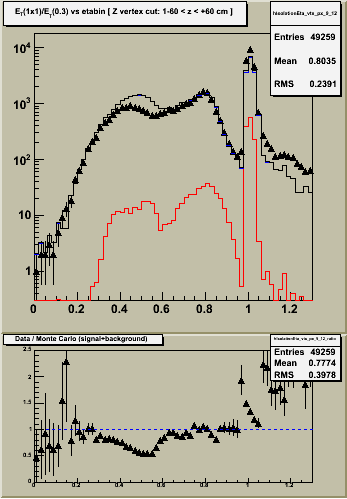 |
Figure 5e -- Data / MC for the isolation ratio Ri described in the text, for eta bins 9-12. The energy of each tower in the MC sample is scaled by a pT and-dependent fudge factor.
|
3.0 Detailed Data / MC Comparisons
A detailed set of data / MC comparisons for the Monte Carlo with pT dependent fudge factors is attached as a PDF file.
Groups:
- jwebb's blog
- Login or register to post comments