Run 6 BTOW Calibration
Introduction
This is not the final calibration for the 2006 data, but it's a big improvement over what's currently in the DB. It uses MIPs to set relative gains for the towers in an eta ring, and then the absolute scale is set by electron E/p.
Isolation Cut Failures
This is a problem that we encountered in 2005, where several pairs of towers had good-looking spectra until the isolation cut was applied, and then quickly lost all their counts. Well, all of the towers that I had tagged with this problem in 2005 still have it in 2006, with one exception. Towers 1897 and 1898 seem to have miraculously recovered, and now towers 1877 and 1878 appear to have isolation failures. Perhaps this is a clue to the source of the isolation failures?
Dataset:
everything I could find on nov07:
<input URL="catalog:star.bnl.gov?production=P06ie,sanity=1,tpc=1,emc=1,trgsetupname= ppProduction||ppProductionTrans||ppProductionLong||pp2006MinBias||ppProductionJPsi||ppProduction62||ppProductionMB62, filename~st_physics,filetype=daq_reco_mudst" nFiles="all" />
Cuts:
Same as 2005. All MIP fits are basic Gaussians over the range 5..250 ADC-PED. Electron fits are Gaussian + linear in a very crude attempt to estimate hadronic background.
Working Directory:
/star/u/kocolosk/emc/offline_tower_calibration/2006/nov07/
Plots:
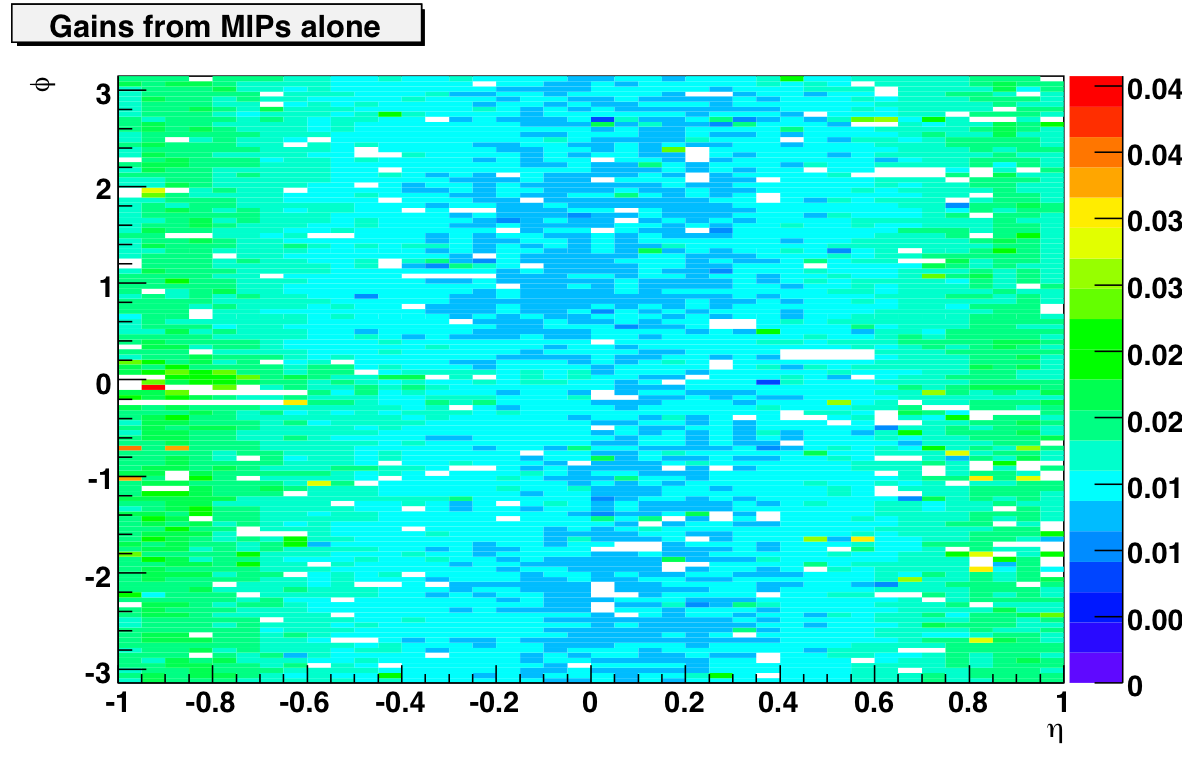
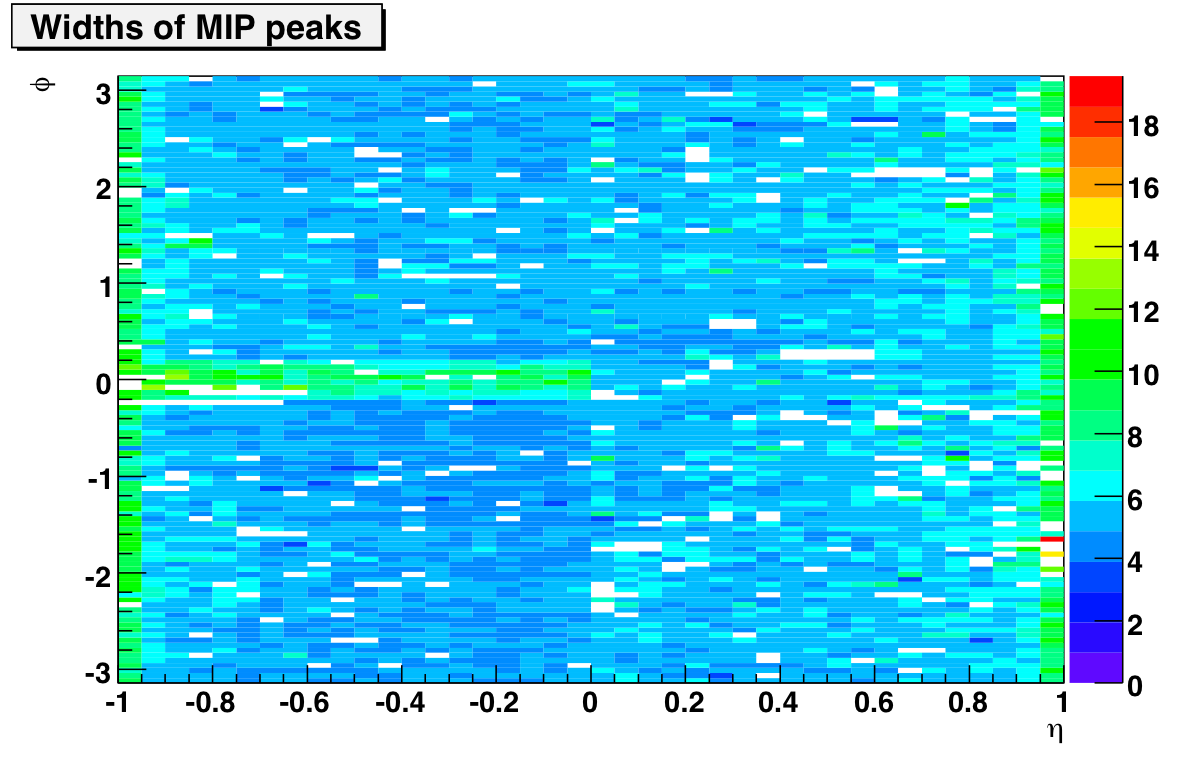
The gains look pretty balanced on the east side and west side. Note that I didn't multiply by sin(theta), so we expect an eta-dependence here. The widths plot is interesting because it picks out one very badly behaved crate on the east side at phi=0. I believe it is 0x0C, EC24E (towers 4020-4180). The tower fits are attached below if you're interested. Bad towers are marked in red.
Electron Normalization:
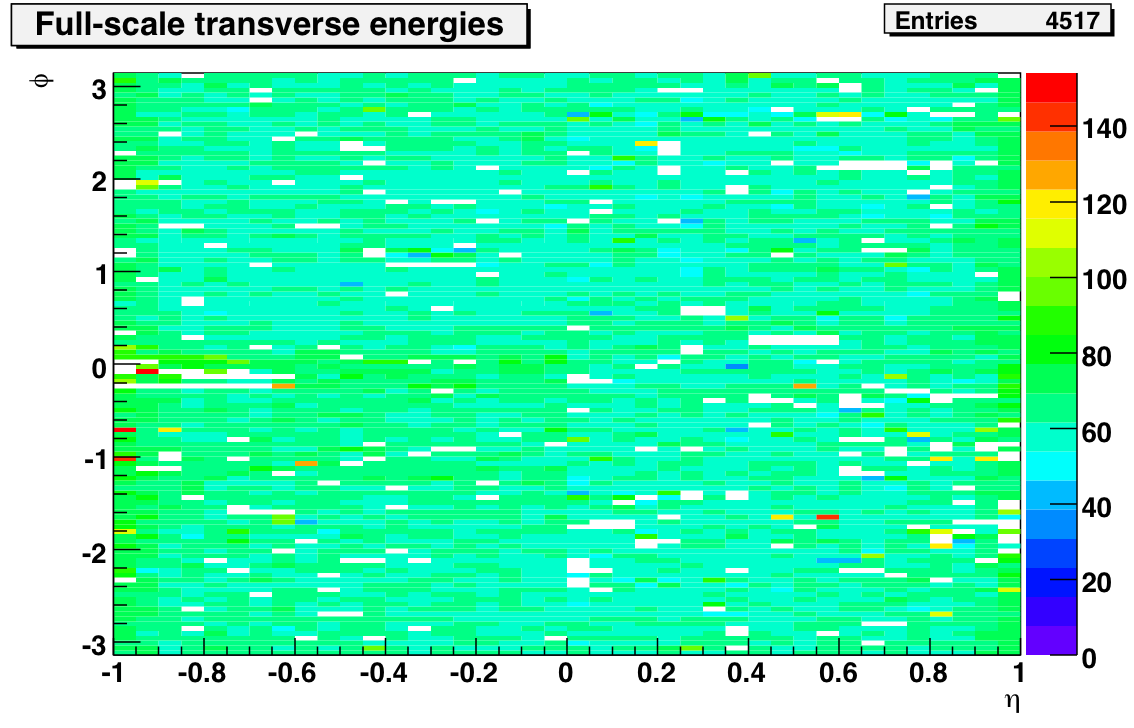
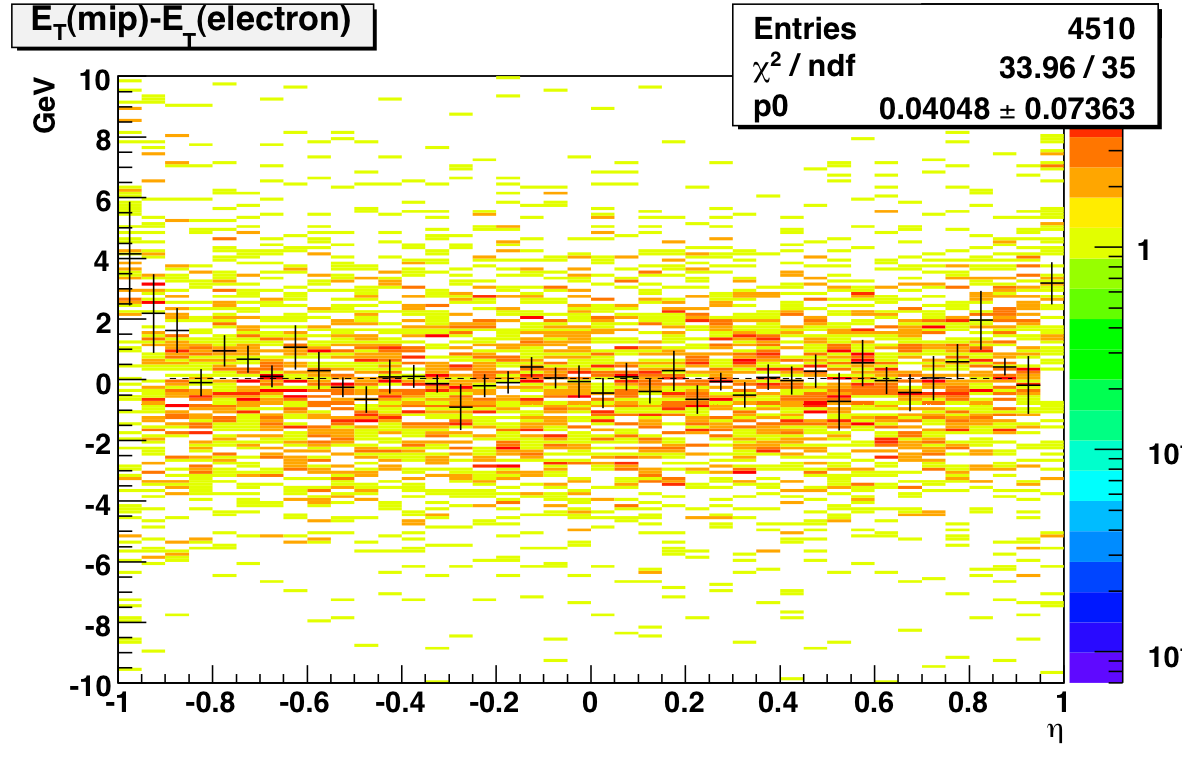
E/p plots for all 40 eta-rings (first 20 on west side, 21-40 on east side) are attached below. In general, the electrons indicate a 9-10% increase in the MIP gains is appropriate. In the last two eta rings on each side, that number jumps to 20% and 40%. This is more or less consistent with the scale factors found in the 2003 calibration (the last time we used a full-scale energy of 60 GeV. If I scale the MIP gains and plot the full-scale E_T I get the plot on the left. Fitting the eta dependence with a pol0 over the middle 36 eta rings results in a ~62 GeV scale and a nasty chi2.
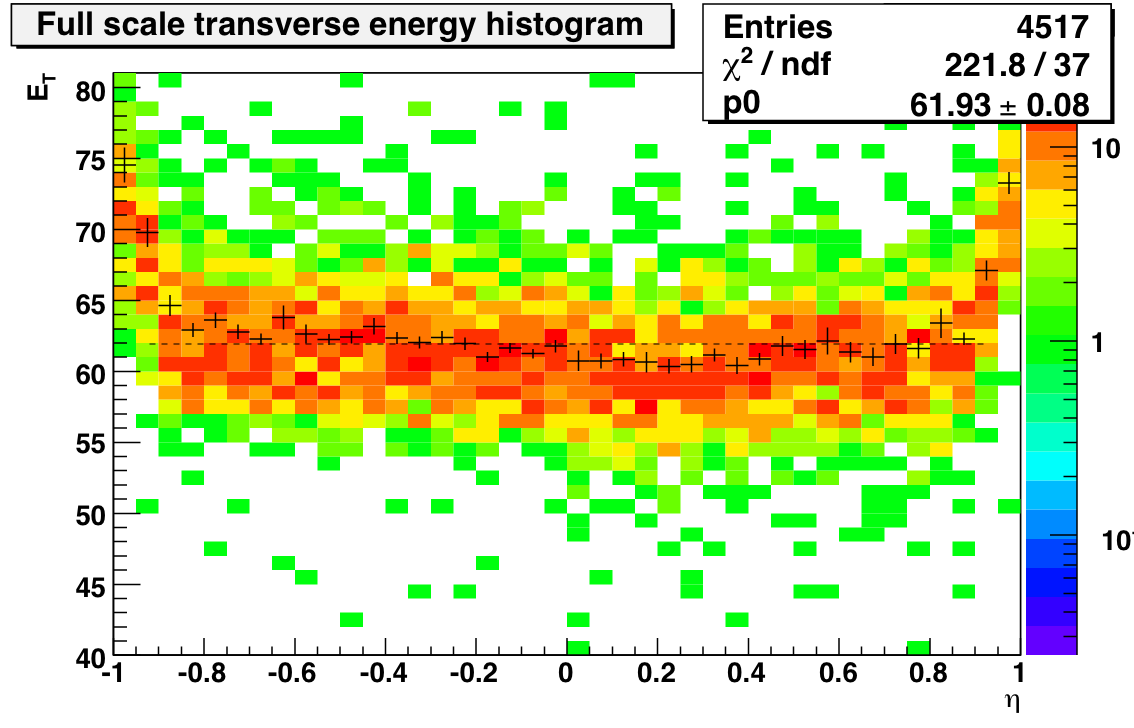
So after scaling with the electrons it looks like we are actually a couple of GeV high on the absolute scale. I'll see if this holds up once I've made the background treatment a little more sophisticated there. I also have to figure out what went wrong with the electrons out at the edges. I didn't E/p would be that sensitive to the extra material out there, but for some reason the normalization factors out there are far too large. Next step will be to comapre this calibration to one using electrons exclusively.
Calibration Uncertainty:
Here are some links that address different parts of the calibration uncertainty that are not linked from this page:
drupal.star.bnl.gov/STAR/subsys/bemc/calibrations/run6/btow/calibration-uncertainty-calculation
drupal.star.bnl.gov/STAR/blog-entry/mattheww/2009/apr/09/2006-calibration-uncertainty
drupal.star.bnl.gov/STAR/blog-entry/mattheww/2009/apr/27/crate-systematic-2006
Online Work
Steve's caiibrations page contains most of the details:http://www.star.bnl.gov/protected/spin/trent/calibration/calibration.html
Some files of slopes, etc. that I produced are currently stored at
http://web.mit.edu/kocolosk/www/slopes/
MIP check on 2006 Slope Calibration
~300k events processed using fastOffline:
Run 7079034 ~189K
Run 7079035 ~115K
Number of events with nonzero primary tracks = 109k / 309k = 35%
Still a few problems with pedestal widths in the database, although now they appear to be restricted to id > 4200. If I don't cut on adc>2*rms, the software id distribution of MIPs looks pretty isotropic:
The distribution of primary tracks also looks a lot better:
I was able to calculate MIP gains for each of the 40 eta-rings. The plot at the top fits a line to the full-scale transverse energies extracted from the gains (excluding the outer two eta-rings on each side). For the error calculations I used the error on the extraction of the mean of the MIP ADC peak and propagated this through the calculation. This is not exactly correct, but it's a pretty close approximation. In a couple of cases the error was exceedingly small (10^-5 ADC counts), so I forced it to an error of 1 GeV (the fit failed if I didn't).
As you can see in the text file, an error of 1 ADC in the MIP peak leads to an error of 3 GeV in the full-scale transverse energy. Therefore I would say that pedestal fluctuations (1-2 ADCs) give an additional error of 5 GeV to my calculations, which means that the majority of these eta-rings are consistent with a 60 GeV full-scale.
Conclusions:
- A straight-line fit yields 56 GeV as the average full-scale transverse energy of the towers
- We have enough stats; errors are dominated by pedestal fluctuations leading to a 5 GeV uncertainty
- Tower response is flat in E_t across eta-rings (excluding last two rings where MIPs fail)
- Good job Stephen and Oleg!
The First Attempt
Note: The first attempt at this analysis was plagued by poor TPC tracking and also problems with corrupted BTOW pedestal widths in the database. I'm including the content of the original page here just to document those problems.
250k events processed using fastOffline:
Run 7069023 100K
Run 7069024 100K
Run 7069025 50K
Number of events with nGlobalTracks > 0 = 30166 (12%)
On the left you see the software id distribution of slope candidates (adc-ped>3*rms, no tracking cuts). There's a sharp cutoff at id==1800. But before you go blaming the BEMC for the missing MIPs, the plot on the right shows eta-phi distribution of global tracks without any EMC coincidence. The hot region in red corresponds to 0<id<1800:
As it turns out, the missing slope candidates are likely due to wide pedestals. The pedestal values look fine, but if I plot pedrms for id<1800 and id>1800 using the slope candidates that did survive:
Is it possible that the TPC track distribution is connected to this problem?
2006 Gain uniformity
Using the gains we calculated for 2006 tower by tower from the MIPs and then corrected with the electron eta rings, I calculated how it differed from the ideal gain assuming containment of an EM shower with 60 GeV ET. After removing bad towers, we can fit the distribution of this ratio to a gaussian and we find there is approximately a 6% variation in the gains.


Calibration Uncertainty Calculation
Summary:
The uncertainty on the 2006 BTOW Calibration is 1.6%. This value is the combination of a 1.3% overall uncertainty and a 0.9% uncertainty caused by variations in the different crates. This uncertainty should be treated as a measure of the bias in the 2006 Calibration.
Plan:
Attached is a document how the calibration uncertainty for 2006 will be calculated:
- Eliminate dependence on simulations through tighter fiducial volume cuts
- Reduce trigger bias by explicitly avoiding electrons matched to trigger HTs or TPs
- Validate modeling of E/p backgrounds. Confirm that the fit is unbiased by checking
consistency of low-background and high-background samples. - Confirm that crate timing does not systematically bias the energy reconstruction.
The uncertainty on the calibration will be assigned as the maximum between |E/p −1.0| and the uncertainty on the peak position.
Method:
We did some initial studies to determine the magnitude of each of these effects, and then we generated calibration trees covering the entire 200 GeV pp run from 2006. The code used to generate these trees is available in StRoot/StEmcPool/StEmcOfflineCalibrationMaker.
We made the following cuts on the tracks to select good electrons and an unbiased sample.
List 1:
- 3.5 < dEdx < 4.5
- abs(vertexZ) < 30
- 1.5 < p < 15 GeV
- dR (from tower center to track projection) < 0.004 (in units of deta,dphi)
- tower_id == tower_id_exit of projection
- Energy of highest neighbor < 0.5 * track energy
After making these cuts, we fit the remaining sample to a gaussian plus a first order polynomial, based on a study of how to fit the background best.
Figure 1 uses an isolation cut to find a background rich sample to fit:

Figure 2 shows the stability of the E/p location (on the y-axis) between our fit and just a gaussian for different windows in dEdx (x-axis)
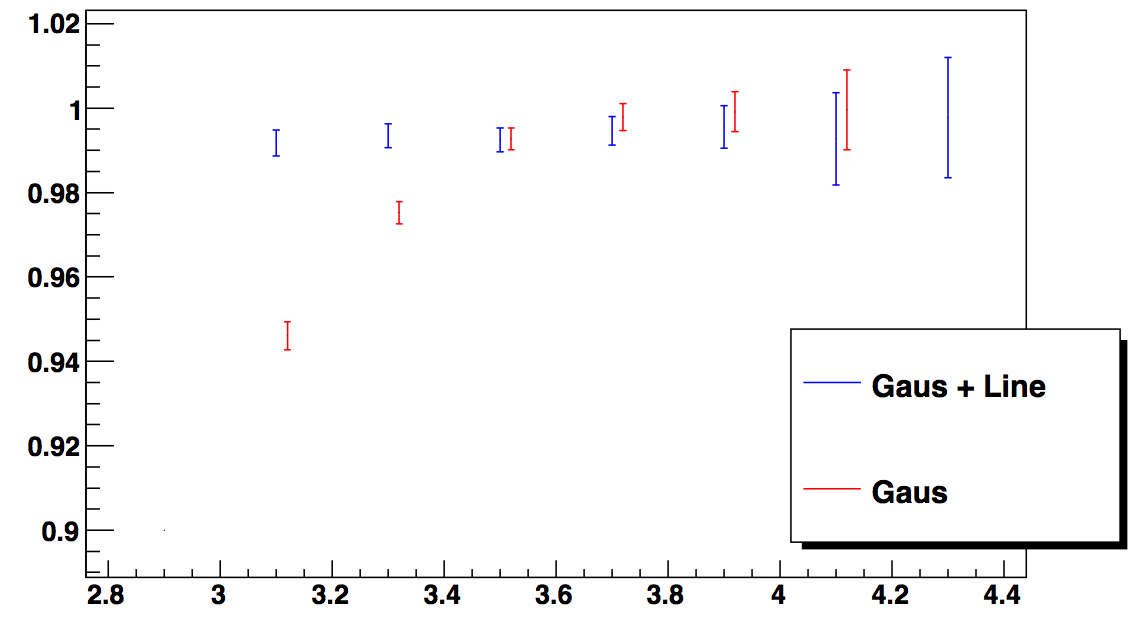
Figure 3 shows the E/p location (y-axis) for different annuli in dR (x-axis/1000), which motivated our dR cut to stay in a flat region:
.png)
After making all of these cuts, we fit E/p to the entire sample of all our electrons. We then add different cuts based on the trigger information to see how that might affect the bias. We looked at four scenarios:
List 2:
- All electrons after stringent cuts
- Electrons from events that were NOT HT/HTTP triggered
- Electrons from events that were only HT/HTTP triggered
- Electrons from HT/HTTP events with trigger turnon tracks (4.5 < p < 6.5 GeV) removed
From these scenarios we chose the largest deviation from E/p = 1.0 as the overall uncertainty on the calibration. This happens to be scenario 3, working out to 1.3%.
Figure 4: E/p for different scenarios
.png)
We also observed a possible crate systematic by fitting E/p for each crate separately.
Figure 5 E/p for each crate:
.png)
According to the chi^2, there is a non statistical fluctuation. To figure out how much that is, we compared the RMS of these points to that when the data is randomly put into 30 partitions. It turns out that all of it is due to that one outlier, crate 12. Since crate 12 contributes 1/15 to each eta ring that it touches, the deviation of this point from the fit causes an uncertainty of 0.9%. This additional uncertainty increases the total uncertainty to 1.6%.
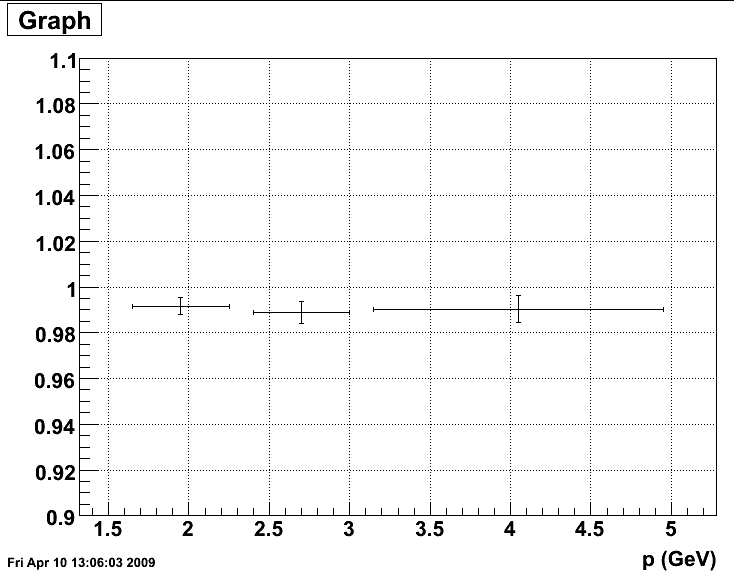
Side Note - Linearity:
After removing HT/HTTP events, we took a look at this plot of p (y-axis) vs E/p (x-axis). By eye, it looks pretty flat, which we verified by splitting into p bins.
Figure 6 p vs E/p
.png)
Figure 7 E/p vs p
Eta Dependence:
There was some question about whether there was eta dependence. This was investigated and found to be inconsequential: http://drupal.star.bnl.gov/STAR/node/14147/
Figure 8: Divided the sample into 3 separate time periods. Period 1 goes is before run 7110000. Period 2 is between runs 7110000 and 7130000. Period 3 is after run 7130000. The deviations are below 1.6%.
.png)
Figure 9: Agreement between east and west barrel:
.png)
Figure 10: ZDC Rate vs. energy/p
.png)
Figure 11: E/p fits for three different regions in ZDC rate: 0 - 8000, 8000-10000, 10000-20000 Hz.
.png)
Comparison of Electron and MIP Calibrations
This page compares the new tower calibration performed using only electron E/p to the calibration using last year's algorithm. The two calibrations are found to be consistent within 120 MeV in E_T.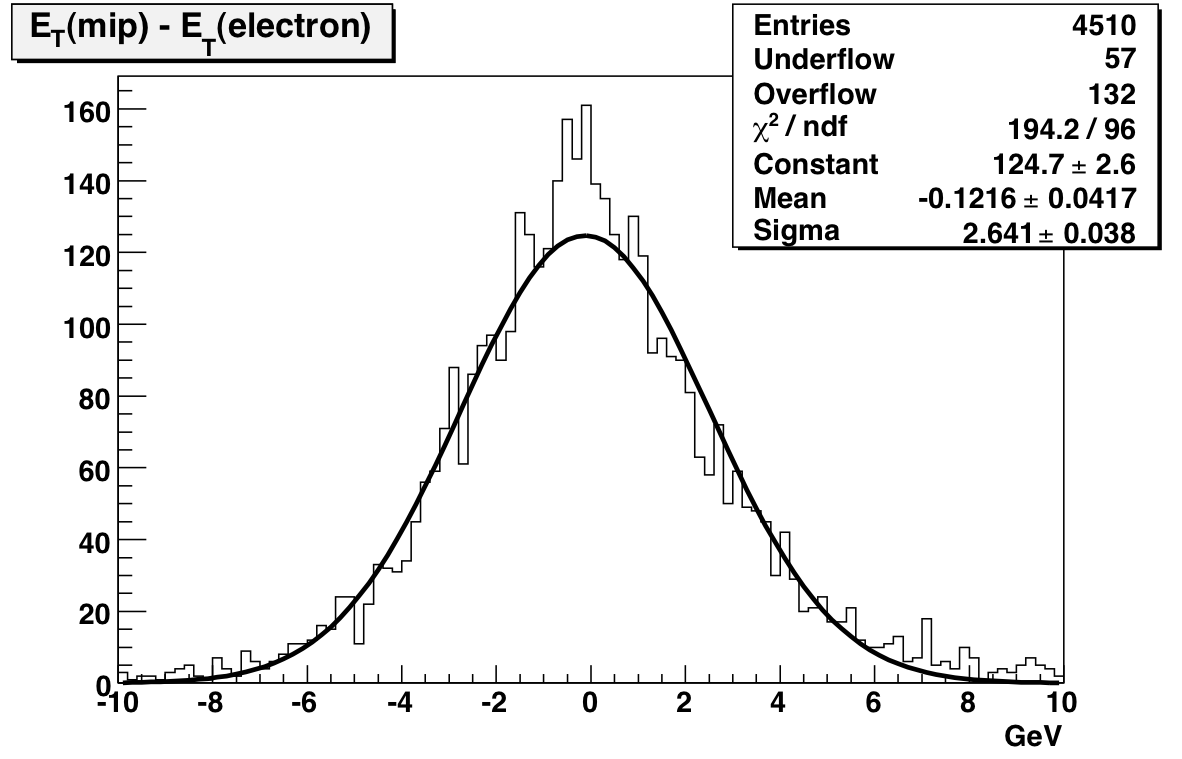
I've also attached the tower-by-tower plots of electron E/p so you can see the results for yourself. I'll write up a more complete description of the calibration algorithm shortly.
Comparison of Online and Offline Calibrations
Introduction:
This page compares the online and first offline calibrations. The online calibration table was generated during data-taking using a single long run processed through fastOffline production and uploaded on March 30th. It uses slopes to set the relative gains in an eta-ring and then normalizes the eta-rings using MIPs. The first offline calibration uses a significant fraction of the produced transverse and late longitudinal runs. It sets the relative gains using MIP peaks and then uses electron E/p to set the absolute scale. It was uploaded on December 7th.Body Counts:
138 additonal towers are masked in this first offline calibration, leaving 4517 good towers. 1 tower (2916) was masked before but is now listed as OK. To be honest, I have no idea why it was masked in the online calib; its slope looks fine to me.Plots:
The electron E/p scaling in the offline calibration increased the gains by an approximately uniform 10 percent (more at the edges). This effect is seen in the following plot of offline E_T - online E_T, integrated over all towers that were good in both calibrations: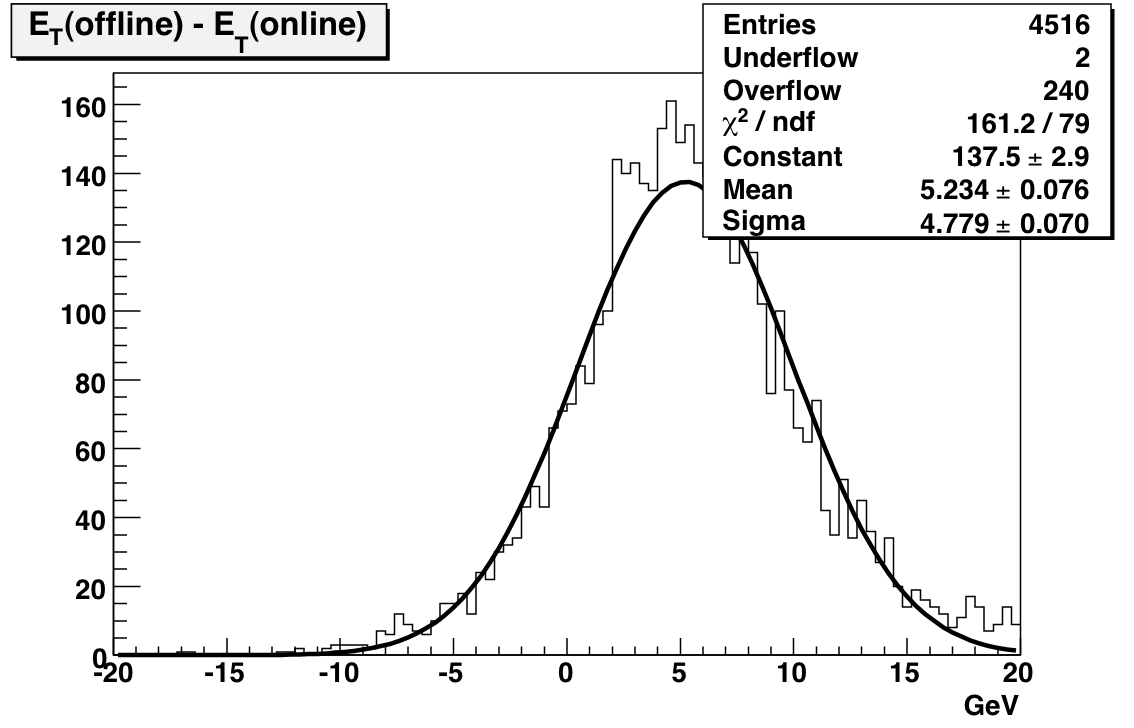
Now, the interesting thing is the relative changes of offline-online for the east side and the west side. If I only plot the location of towers whose gains increased by more than 20% I get
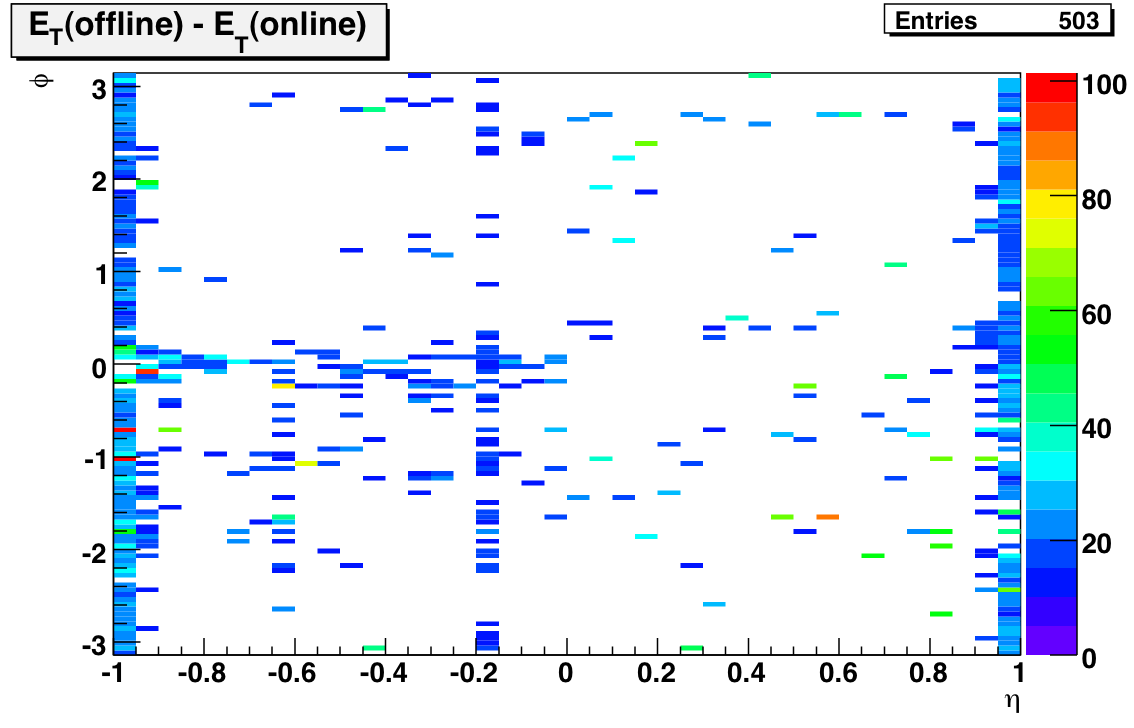
There were only 12 towers whose gains decreased by 20%; all of them were on the west side. Finally here's a plot of the E_T change of the remaining towers:
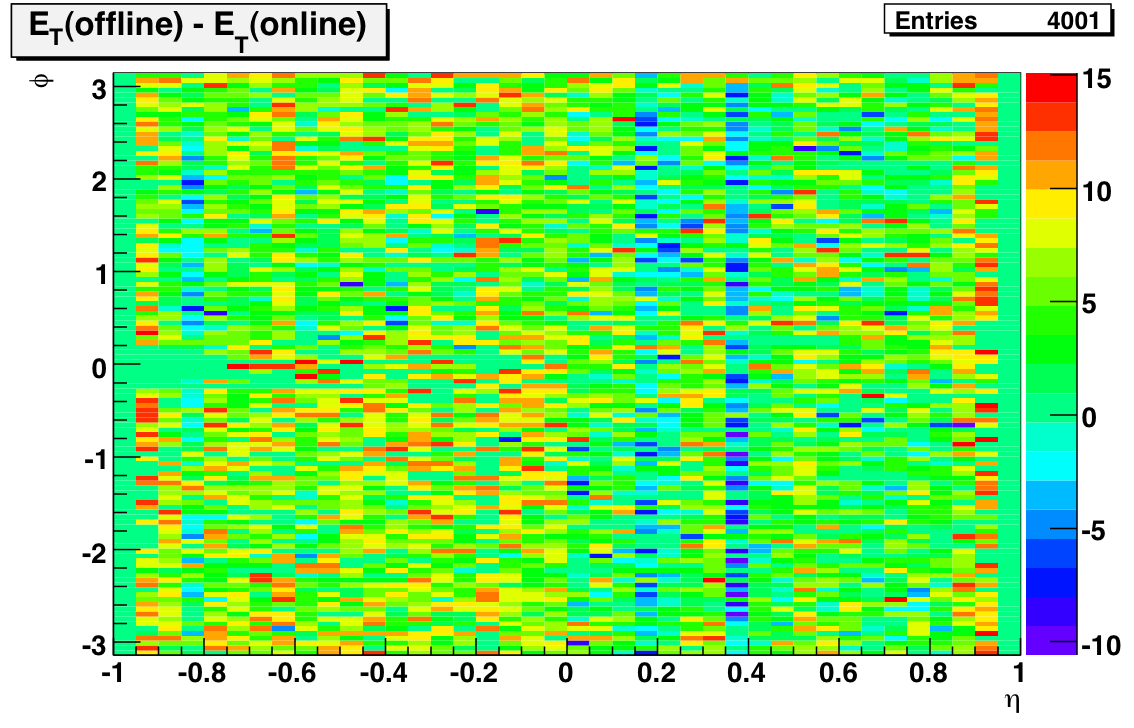
I think the message here is clear: the gains on the east side have increased more than the gains on the west side! It's possible that the use of the online calibration in previous Run 6 jet studies is at least partially responsible for the obsereved east-west jet asymmetry.
To get quantitative about this effect we have to go to 1D. I've attached a PDF of eta-ring by eta-ring histograms like the first one on this page. The first two pages are the east side; the next two are the west side. I've found it easiest to analyze if you set your Reader to view two pages at a time; then you'll be comparing towers with the same absolute value of pseudorapidity when you flip. The conclusion is pretty clear: at midrapidity the difference in offline - online E_T floats around 5 - 8 GeV on the east side, but it's only about 2 - 5 GeV on the west side.
Gain Stability Check
I've updated my codes to do a more systematic investigation of the stability of the gains. Instead of trying to get sufficient tower-by-tower statistics for different time periods, I'm looking at MIP peaks for single runs integrated over all towers. Here's the plot: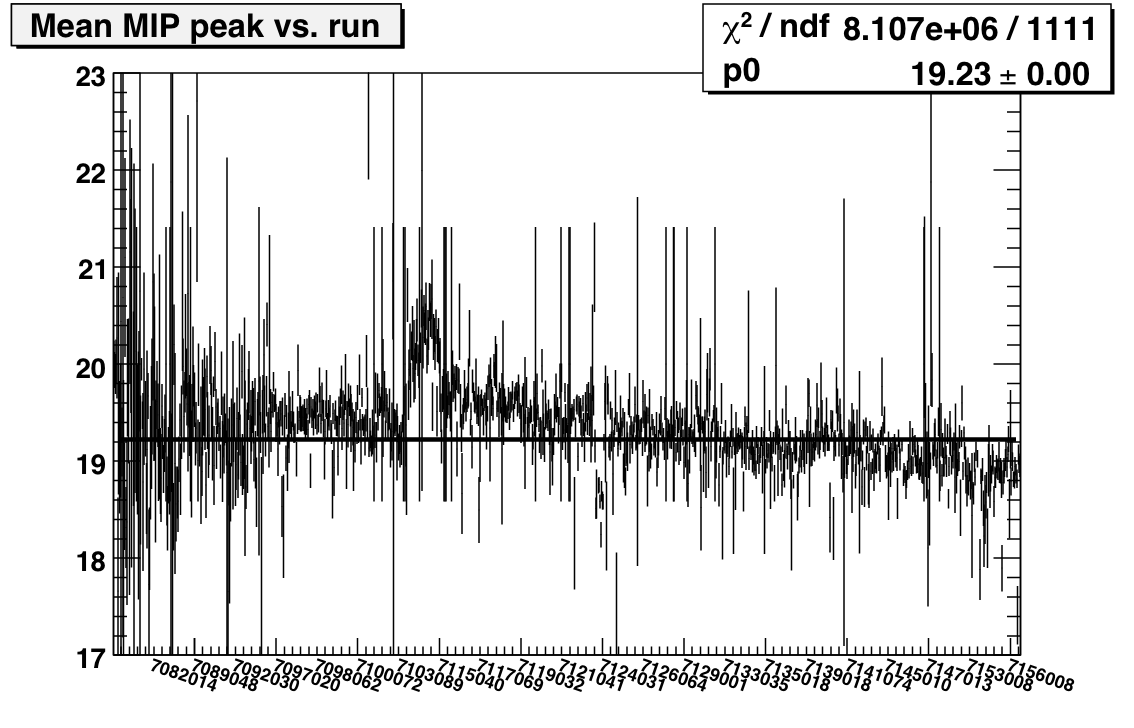
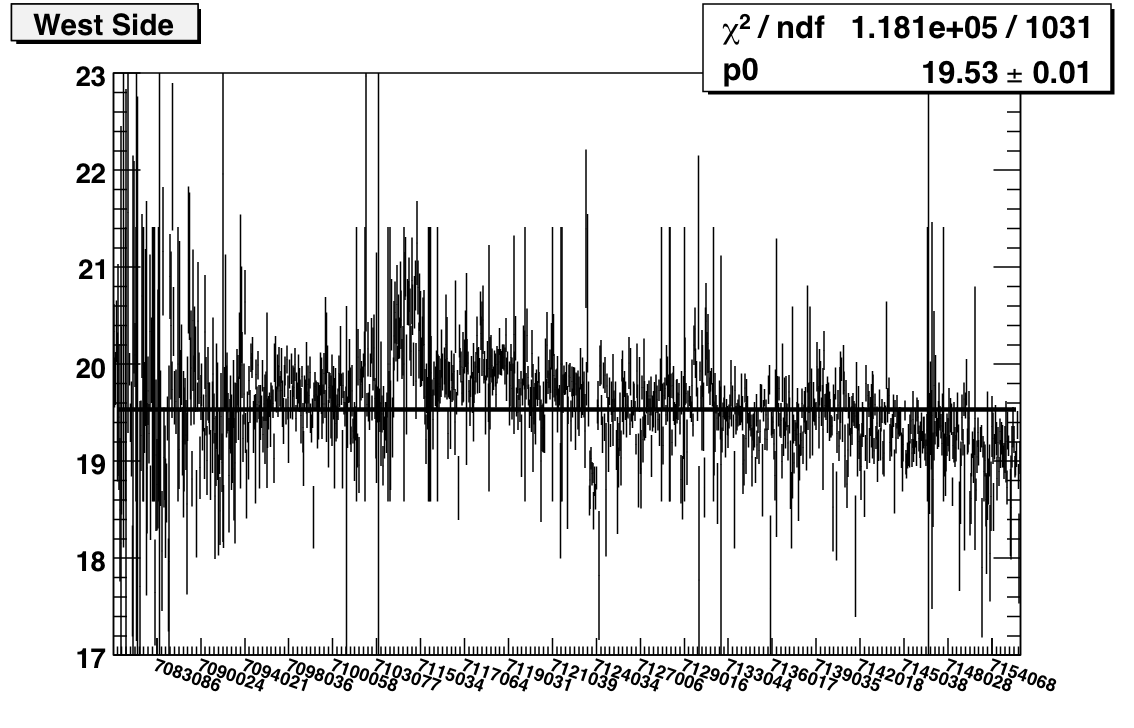
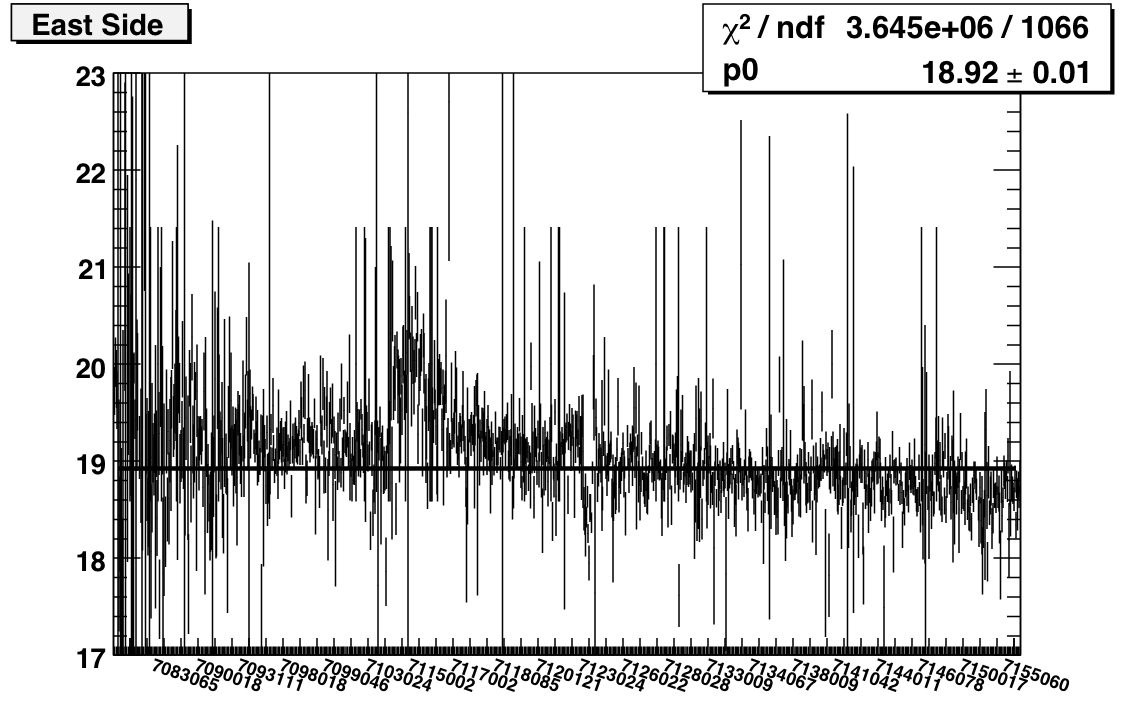
Features of note include the bump covering the first couple of days after the shutdown, the bunch of runs on day 123/4 with very low average peaks, and the general decreasing slope (consistent with towers losing high voltage). I also ran this plot for west and east separately:
I'm running jobs now to do electron selection instead of MIPs. I think that I can probably still do this as a function of run, but certainly I'll have sufficient stats to plot vs. fill if necessary.
Goal: Compare the tower slopes and MIP peaks from the following three periods to check for stability.
- Day < 104 (97-99)
- 104 < Day < 134 (114-119)
- Day > 134 (134-139)
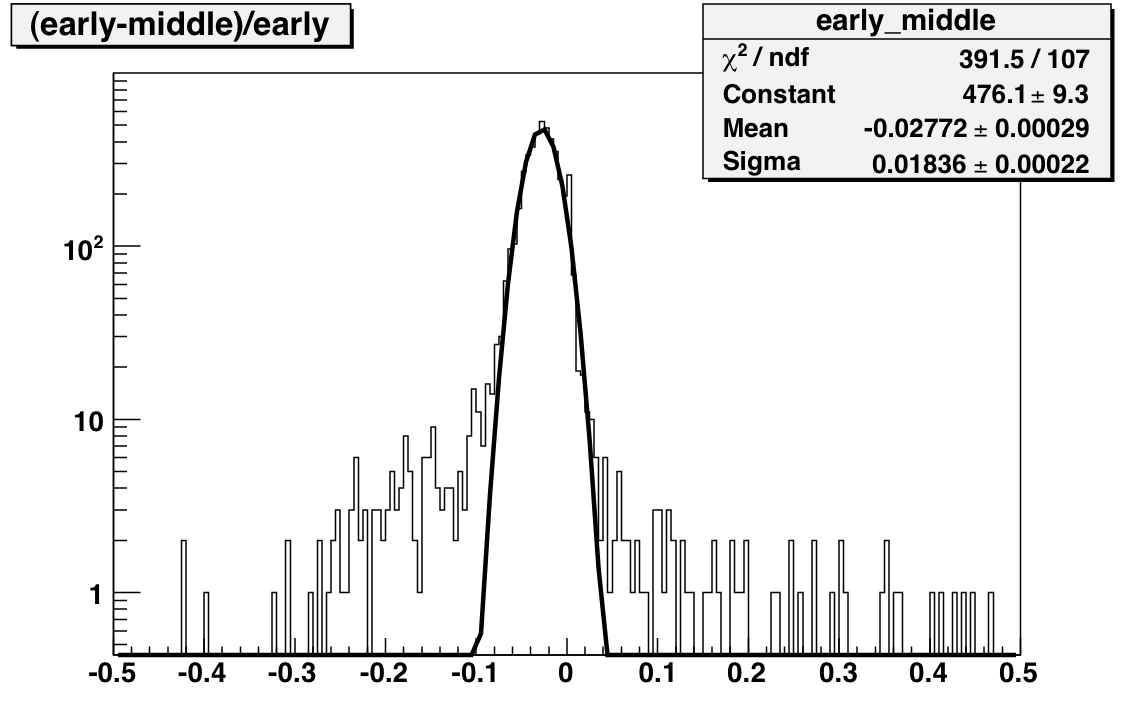
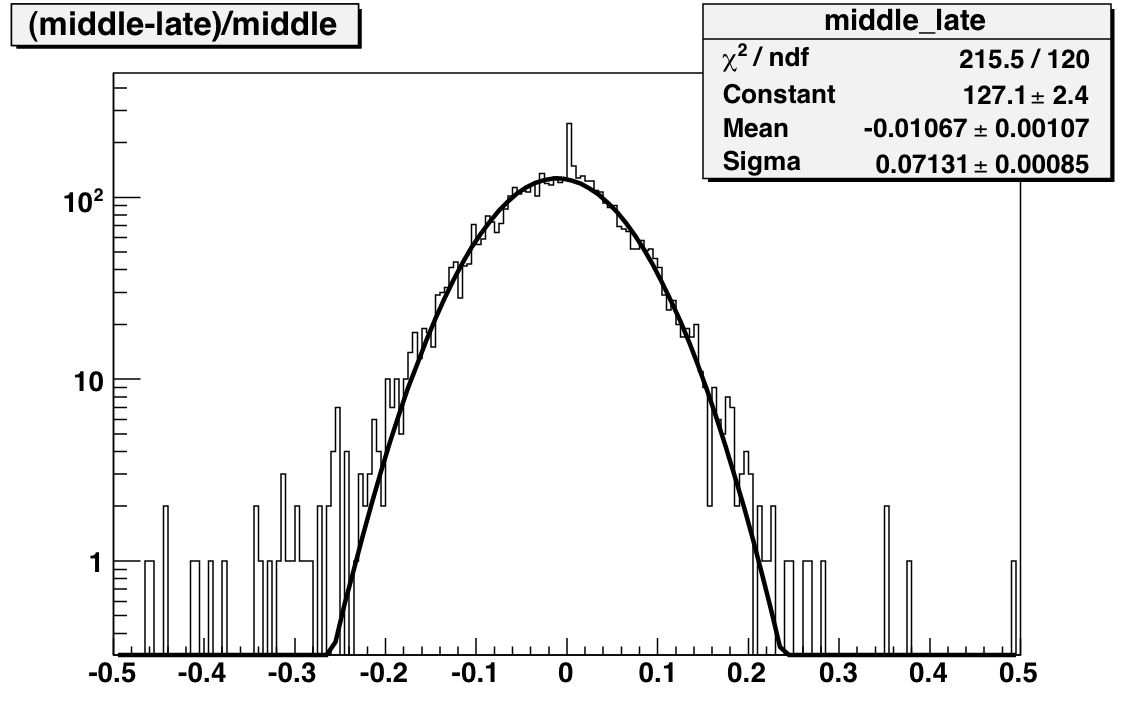
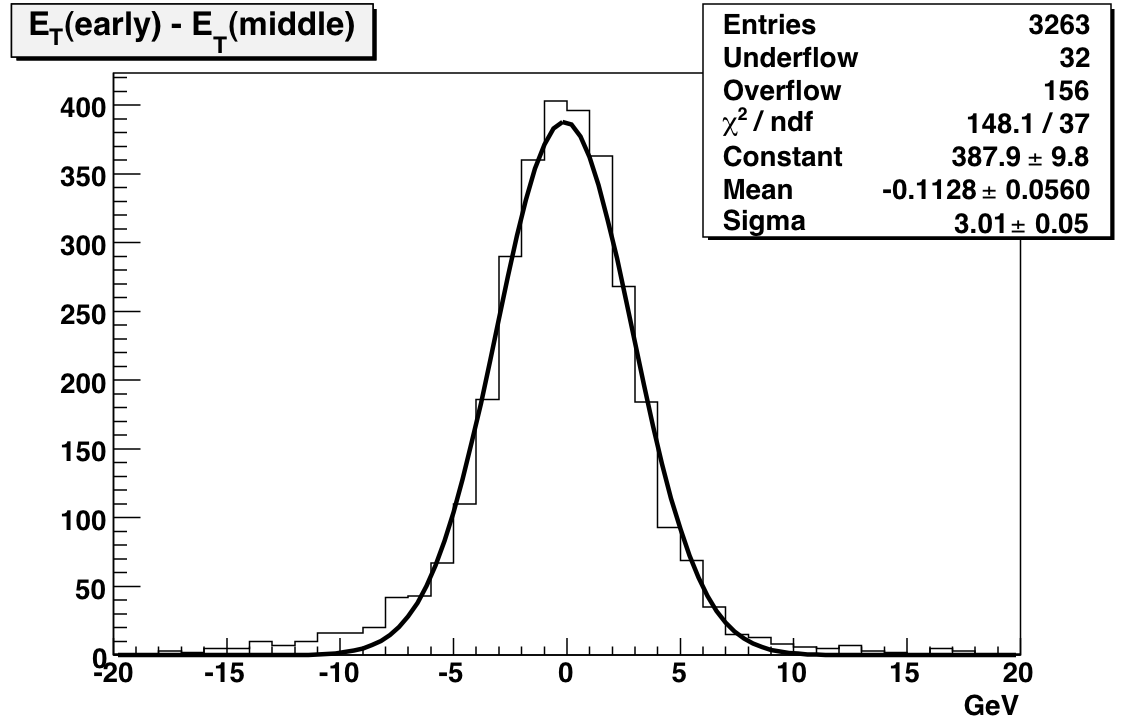
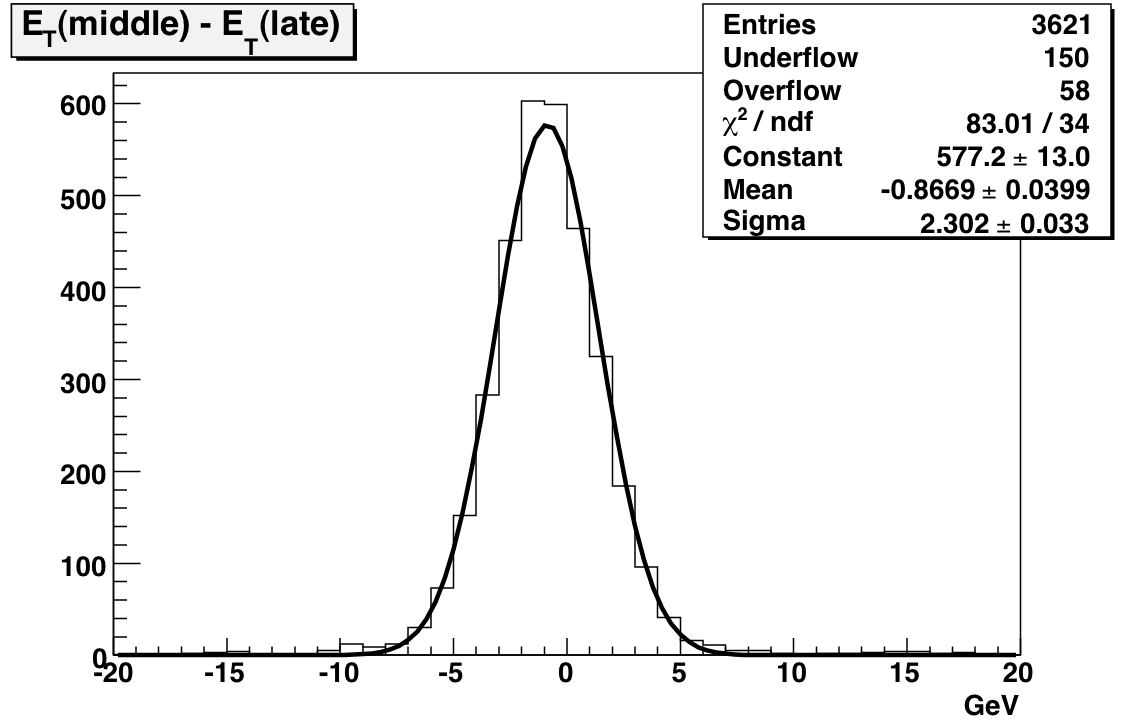
The next set of plots compare gains extracted from MIP peak positions where the MIP peaks are generated using subsets of the Run. Comparing before and after the shutdown yields a mean difference of 110 MeV with a width of 3 GeV. This difference is significantly less than 1 percent. The comparison between middle and late (essentially a comparison between transverse and late longitudinal running) indicates a 1.5 percent drop in the gains with a 2.3 GeV sigma.