SPIN 2006 Preliminary Result
Event Selection Criteria
- run belongs to golden run list, version c
- BBC timebin belongs to {7,8,9}
- spinDB QA requires: isValid(), isPolDirLong(), !isPolDirTrans(), !isMaskedUsingBX48(x48), offsetBX48minusBX7(x48, x7)==0
- ignore additional vertices
- trigger = MB || JP1 || JP2
- |eta| < 1.
- |global DCA| < 1.
- nFitPoints > 25
- flag > 0
- nSigmaPion is in the range [-1,2]
- Random Patterns
- First Look at Charged Pion Trigger Bias (needs to be updated with more deltaG scenarios, should take ~1 day)
- 2005 Charged Pion Data / Simulation Comparison
- Asymmetries for near-side and away-side pions
- Background from PID Contamination
- Data - Monte Carlo Comparison, Take 2
The following are links to previous studies, some of which are outdated at this point:
Single-Spin Asymmetries by BBC timebin
BBC Vertex
Kasia's estimate of beam background effect on relative luminosities
Kasia's estimate of systematic error due to non-longitudinal porlarization
Asymmetries for near-side and away-side pions
Summary:
I associated charged pions from JP2 events with the jets that were found in these events. If a jet satisfied a set of cuts (including the geometric cut to exclude non-trigger jets), I calculated a deltaR from this jet for each pion in my sample. Then I split up my sample into near-side and away-side pions and calculate an asymmetry for both samples.
Jet cuts:
- R_T < 0.95
- JP2 hardware, software, and geometric triggers satisfied
Note: all plots are pi- on the left and pi+ on the right
This first set of plots shows eta(pion)-eta(jet) on the x axis and phi(pion)-phi(jet) on the y axis. You can see the intense circle around (0,0) from pions inside the jet cone radius as well as the regions around the top and bottom of the plots from the away-side jet:


Next I calculate deltaR = sqrt(deta*deta + dphi*dphi) for both samples. Again you can see the sharp cutoff at deltaR=0.4 from the jetfinder:

 Asymmetries
My original asymmetries for JP2 without requiring a jet in the event:


After requiring a jet in the event I get


Now look at the asymmetry for near-side pions, defined by a cone of deltaR<0.4:


And similarly the asymmetries for away-side pions, defined by deltaR>1.5:


Conclusions: No showstoppers. The statistics for away-side pions are only about a factor of 2 worse than the stats for near-side (I can post the exact numbers later). The asymmetries are basically in agreement with each other, although the first bin for pi+ and the second bin for pi- do show 1 sigma differences between near-side and away-side.
Background from PID Contamination
Summary:The goal of this analysis is to estimate the contribution to A_LL from particles that aren't charged pions but nevertheless make it into my analysis sample. So far I have calculated A_LL using a different dE/dx window that should pick out mostly protons and kaons, and I've estimated the fraction of particles inside my dE/dx window that are not pions by using a multi-Gaussian fit in each pt bin. I've assumed that this fraction is not spin-dependent.
Points to remember:
- my analysis cuts on -1 < nSigmaPion < 2
pi- is on the left, pi+ on the right. Each row is a pt bin corresponding to the binning of my asymmetry measurement. The red Gaussian corresponds to pions, green is protons and kaons, blue is electrons. So far I've let all nine parameters float. I tried fixing the mean and width of the pion Gaussian at 0. and 1., respectively, but that made for a worse overall fit. So far, the fit results for the first two bins seem OK.
2 < pt < 4:
 4 < pt < 6:
 6 < pt < 8:
 8 < pt < 10:

I extracted the the integral of each curve from -1..2 and got the following fractional contributions to the total integral in this band:
| pi- bin | pion | p/K | electron |
| 2-4 | 0.91 | 0.09 | 0.01 |
| 4-6 | 0.92 | 0.05 | 0.03 |
| 6-8 | 0.78 | 0.07 | 0.15 |
| 8-10 | 0.53 | 0.46 | 0.01 |
| pi+ bin | pion | p/K | electron |
| 2-4 | 0.90 | 0.09 | 0.01 |
| 4-6 | 0.91 | 0.06 | 0.03 |
| 6-8 | 0.68 | 0.06 | 0.26 |
| 8-10 | 0.88 | 0.05 | 0.08 |
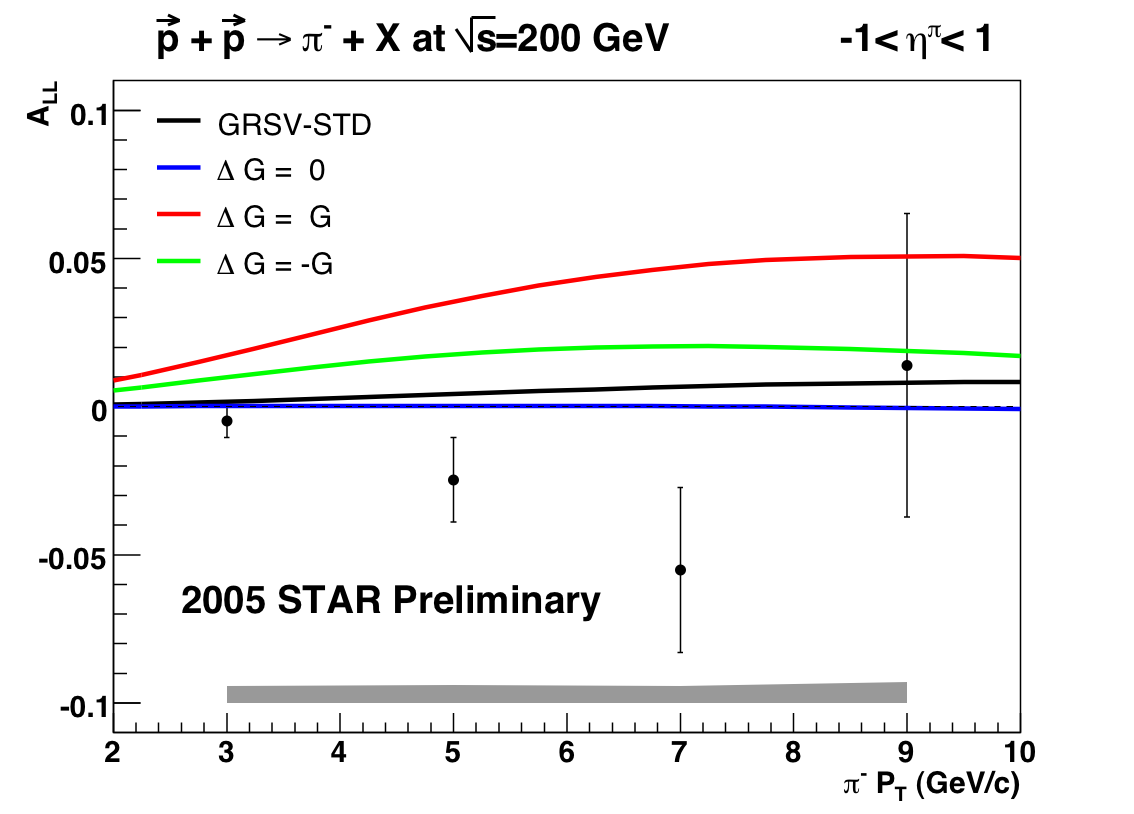
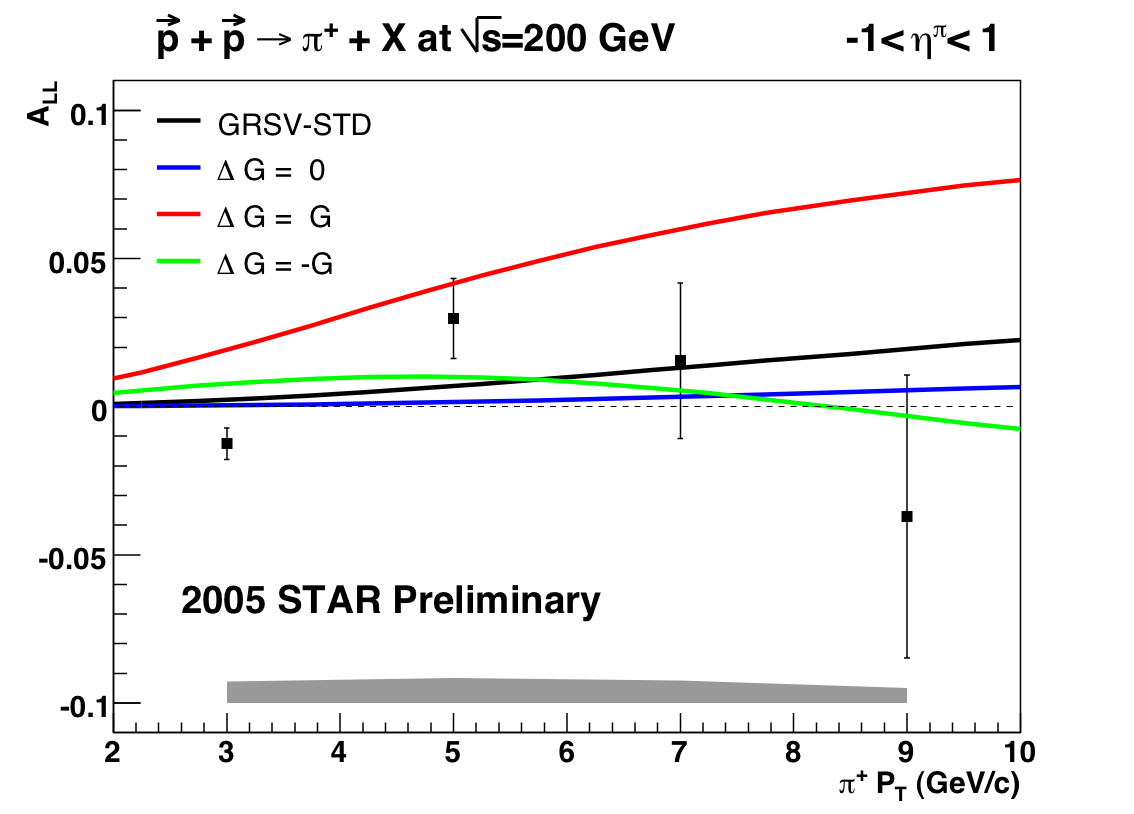
I repeated my A_LL analysis changing the dE/dx window to [-inf,-1] to select a good sample of protons and kaons. The A_LL I calculate for a combined MB || JP1 || JP2 trigger (ignore the theory curves) is


For comparison, the A_LL result for the pion sample looks like


I know it looks like I must have the p/K plots switched, but I rechecked my work and everything was done correctly. Anyway, since p/K is the dominant background the next step is to use this as the A_LL for the background and use the final contamination estimates from the fits to get a systematic on the pion measurement
Random Patterns
Triggers are| mb | ht1 |
| ht2 | jp1 |
| jp2 | all |
Conclusions: Sigmas of these distributions are ~equal to the statistical error on A_LL. Means are always within 1 sigma of zero
Systematic Error Table
I've included an Excel spreadsheet with currently assigned systematic errors as an attachment.