Coherent diffractive photoproduction of rho mesons on gold nuclei at RHIC
Target Journal: Physics Letters B
PAs: Ramiro Debbe, Spencer Klein
PWG presentation: STAR/system/files/userfiles/2729/file/RhoCoherentDiffractionV6.pdf
Abstract:
The STAR Collaboration reports on the photoproduction of π+π− pairs in gold-gold collisions at a center of mass energy of 200 GeV/nucleon. These pairs are produced when a nearly-real photon emitted by one ion scatters from the other ion. We fit the π+π− mass spectrum to a combination of ρ0 and ω resonances and a direct π+π− continuum; the ratio of ρ0 to direct π+π− is consistent with previous measurements. The ω cross-section is comparable with that expected from the measured γp → ωp cross section, a classical Glauber calculation and the ω → π+π− branching ratio.
The ρ0 differential cross section dσ/dt clearly exhibits a diffraction pattern, compatible with scattering from a gold nucleus, with 2 minima visible.
Figures:

Figure 1: The black histogram shows the pion pair transverse momentum. The peak below 100 MeV/c is from the decay of coherently produced π+π− pairs. The red histogram shows the pair momentum for same-sign pion pairs. Both histograms show pairs that come from vertices with only two tracks.
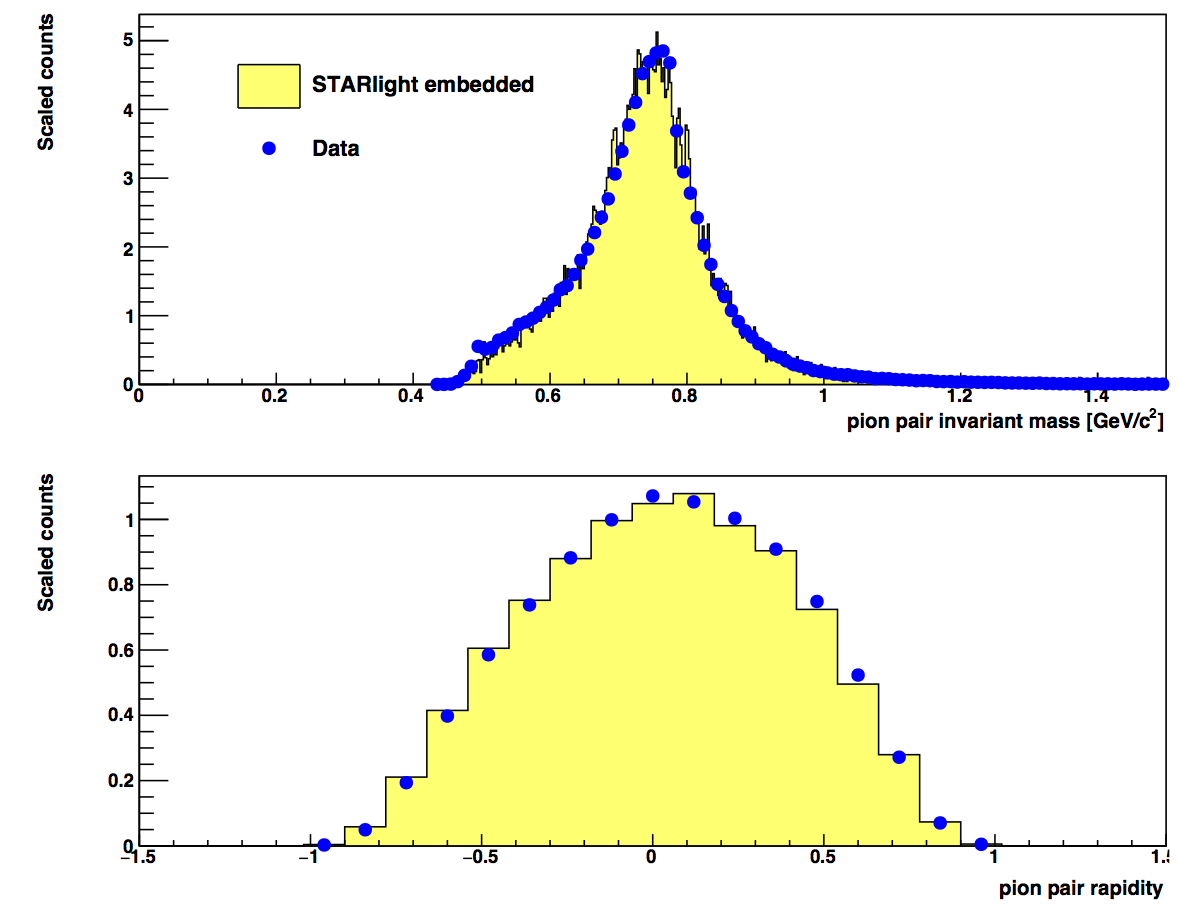
Figure 2: Comparison of uncorrected data (blue points) with embedded simulated ρ0 and direct ππ events (yellow histogram). The simulated UPCs were run through a GEANT sim- ulation of the detector, embedded in zero-bias background events, and subject to the same reconstruction programs as the data.
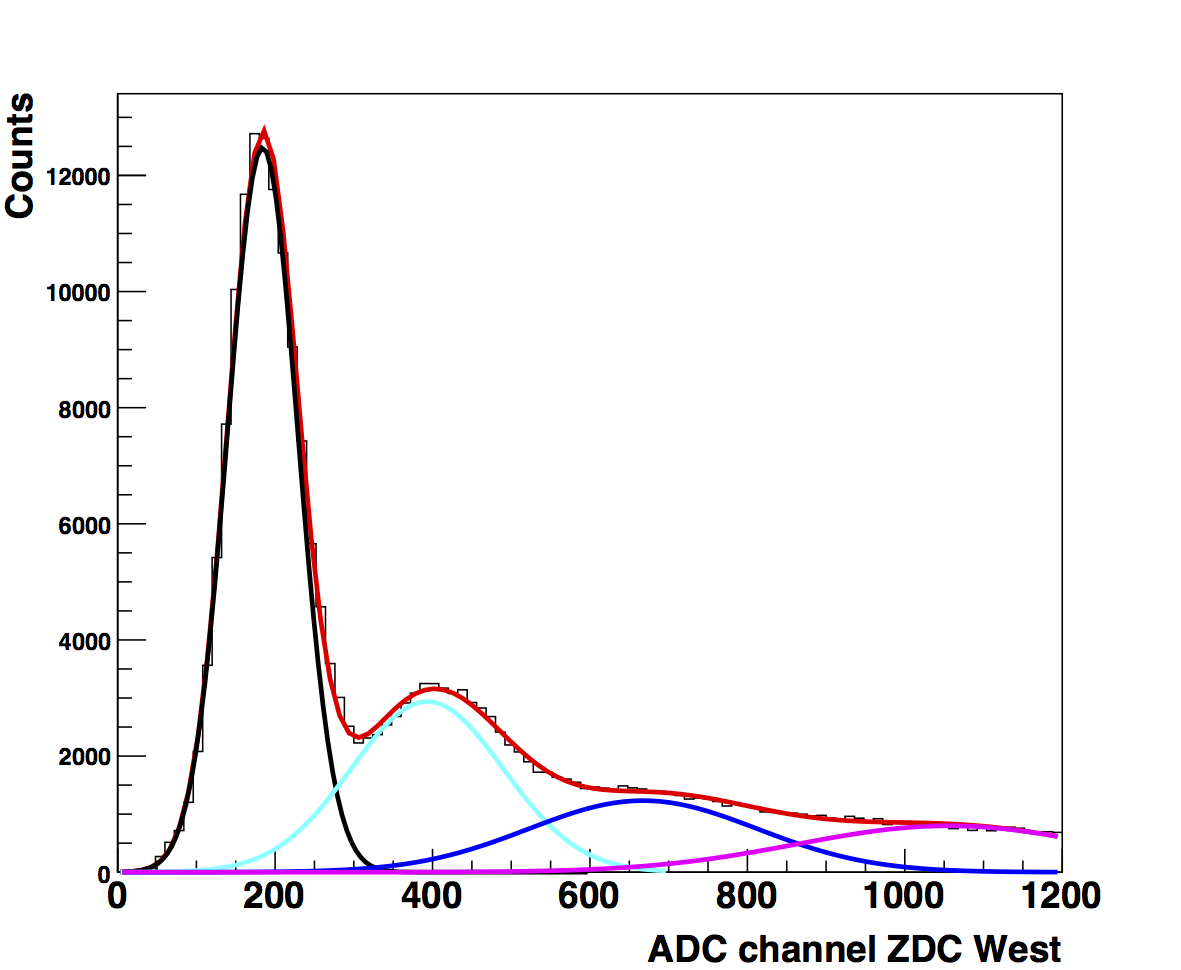
Figure 3: The shower energy in the West ZDC by neutron produced by mutual dissociation is shown as a distribution of ADC channels. These events had a single neutron detected on the East ZDC. The peaks corresponding to 1 to 4 neutrons are fitted with Gaussian distributions with standard deviations that grow as nσ with n the number of neutrons and σ the standard deviation of the one neutron Gaussian. The red curve is the sum of all Gaussians which are also displayed individually. The quality of fit is χ2/NDF = 498/88. The large χ2/NDF is due to the very small statistical errors and the imperfect descriptions of the neutron peaks. It does not introduce significant errors on the number of neutrons in each peak.
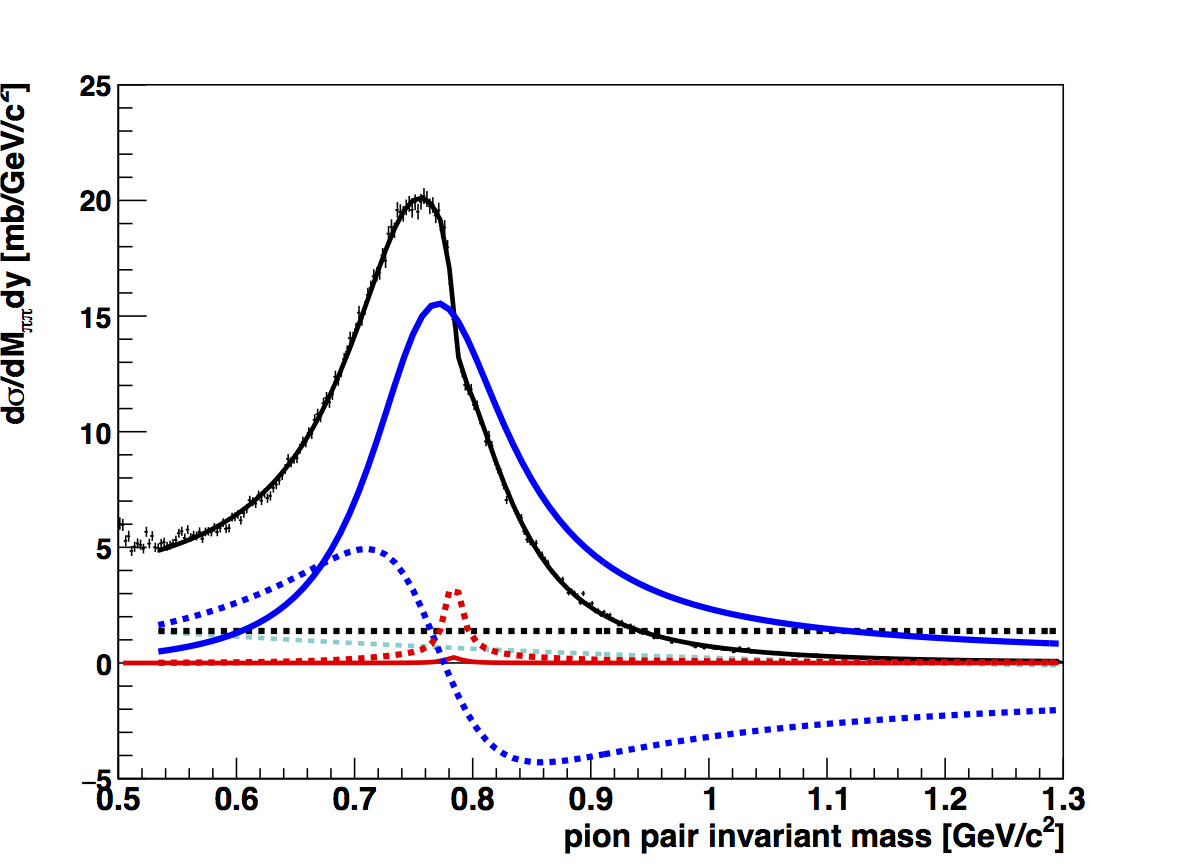
Figure 4: The π+π− invariant-mass distribution for all selected ππ candidates with pT < 100 MeV/c. The black markers show the data (in 2.5 MeV/c2 bins). The black curve is the modified S ̈oding fit to the data in the range 0.53 < Mππ < 1.3 GeV. The ρ0 Breit-Wigner component of the fitted function is shown with a blue curve and the constant non-resonant pion pair component is displayed with a black-dashed one. The interference between non- resonant pion pairs and the ρ0 meson is shown with a blue-dashed curve. The Breit-Wigner distribution for the ω mesons is shown with a red curve and the interference between ρ0 and ω is shown with a red-dashed curve. A small second order polynomial shown with a cyan-dashed curve accounts for the remnant background.
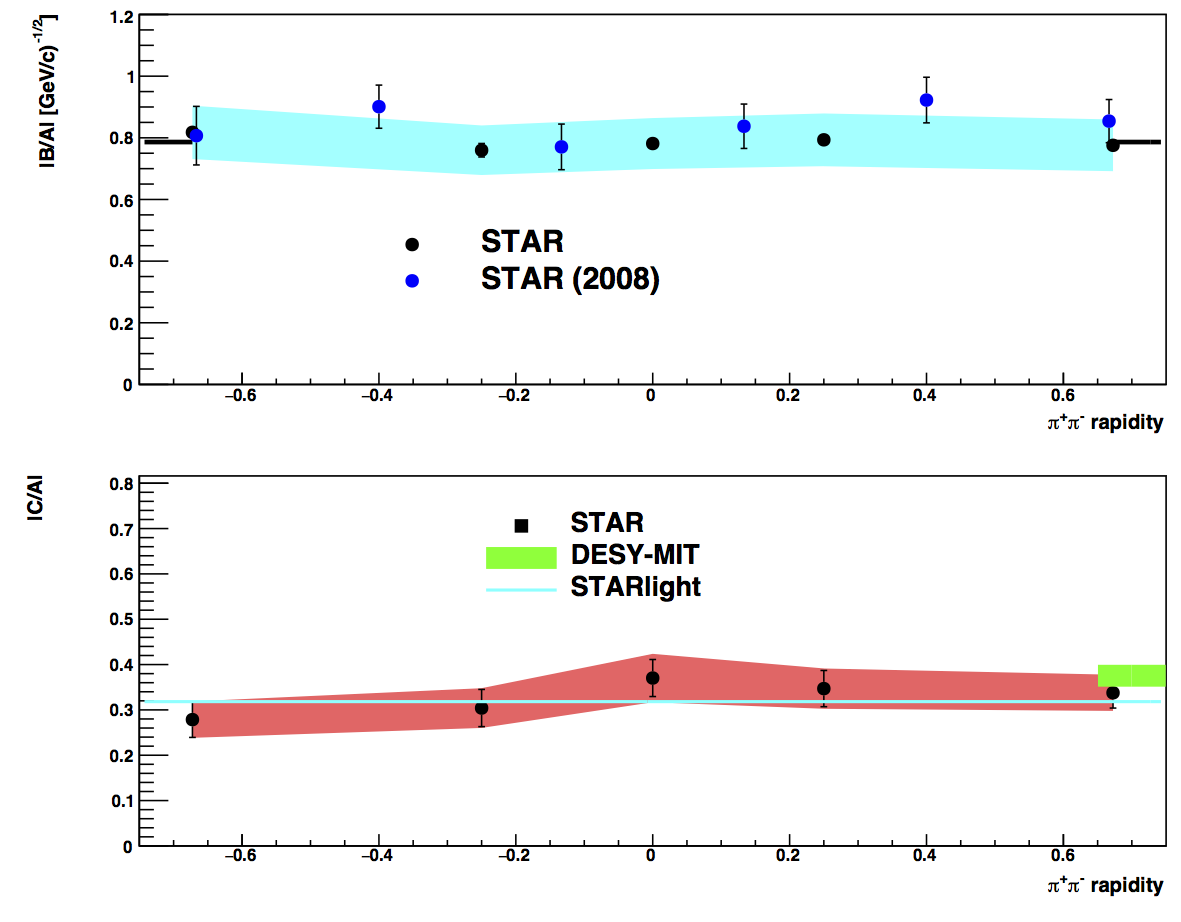
Figure 5: (Top) The ratio |B/A| of amplitudes of non-resonant π+π−and ρ0 mesons. The black points (with shaded blue systematic error band) are from the current analysis, while the previous STAR results are shown with blue-filled circles. The thick black line shows the rapidity-averaged result. In the bottom panel, the black points show the ratio |C/A| of the ω to ρ0 amplitude. The red band shows the systematic errors, while the horizontal blue line shows the STARlight prediction and the most recent branching ratio for ω → π+π− decay [26]. The green band shows the DESY-MIT result for |C/A| [27]. This result was at much lower photon energies leads to a large effective rapidity. For the lower energy photon solution of the two-fold ambiguity, the effective rapidity would be about 2.5.
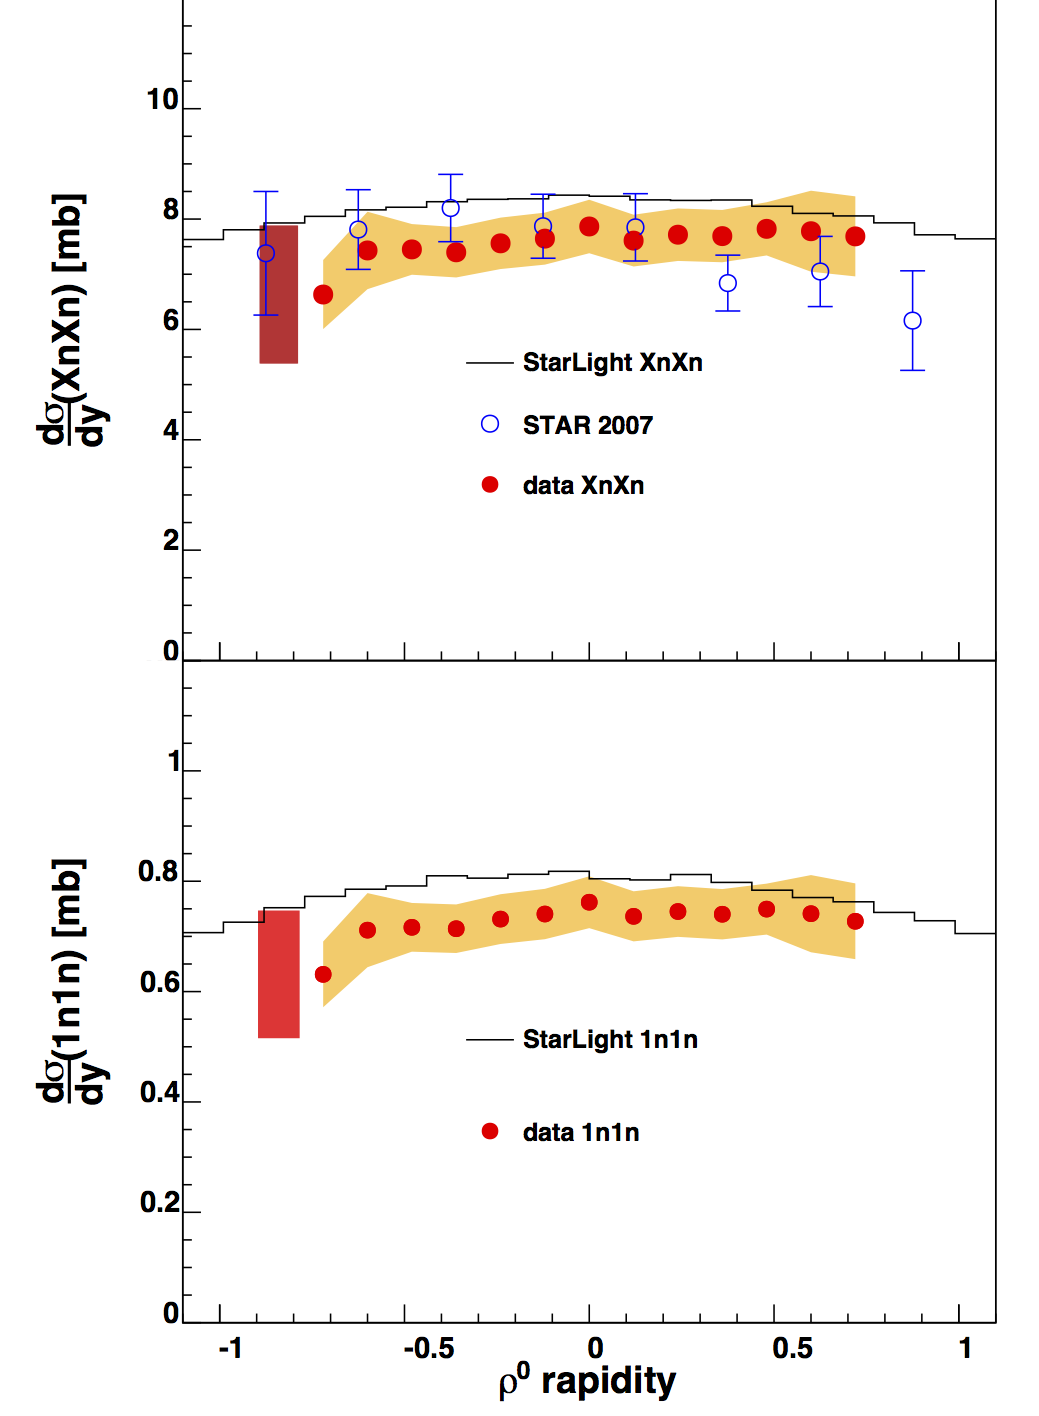
Figure 6: dσ/dy for exclusively photoproduced ρ0 mesons in (top) XnXn events and (bottom) 1n1n events. The data are shown with red markers. The statistical errors are smaller than the symbols, the orange band shows the quadrature sum of the point-to-point systematic uncertainties. The red box at y ∼ −0.9 shows the quadrature sum of the common systematic uncertainties. The black histograms are the STARlight calculation for ρ0 mesons with mutual dissociation. The blue markers in the top panel show the previous STAR measurement [10].
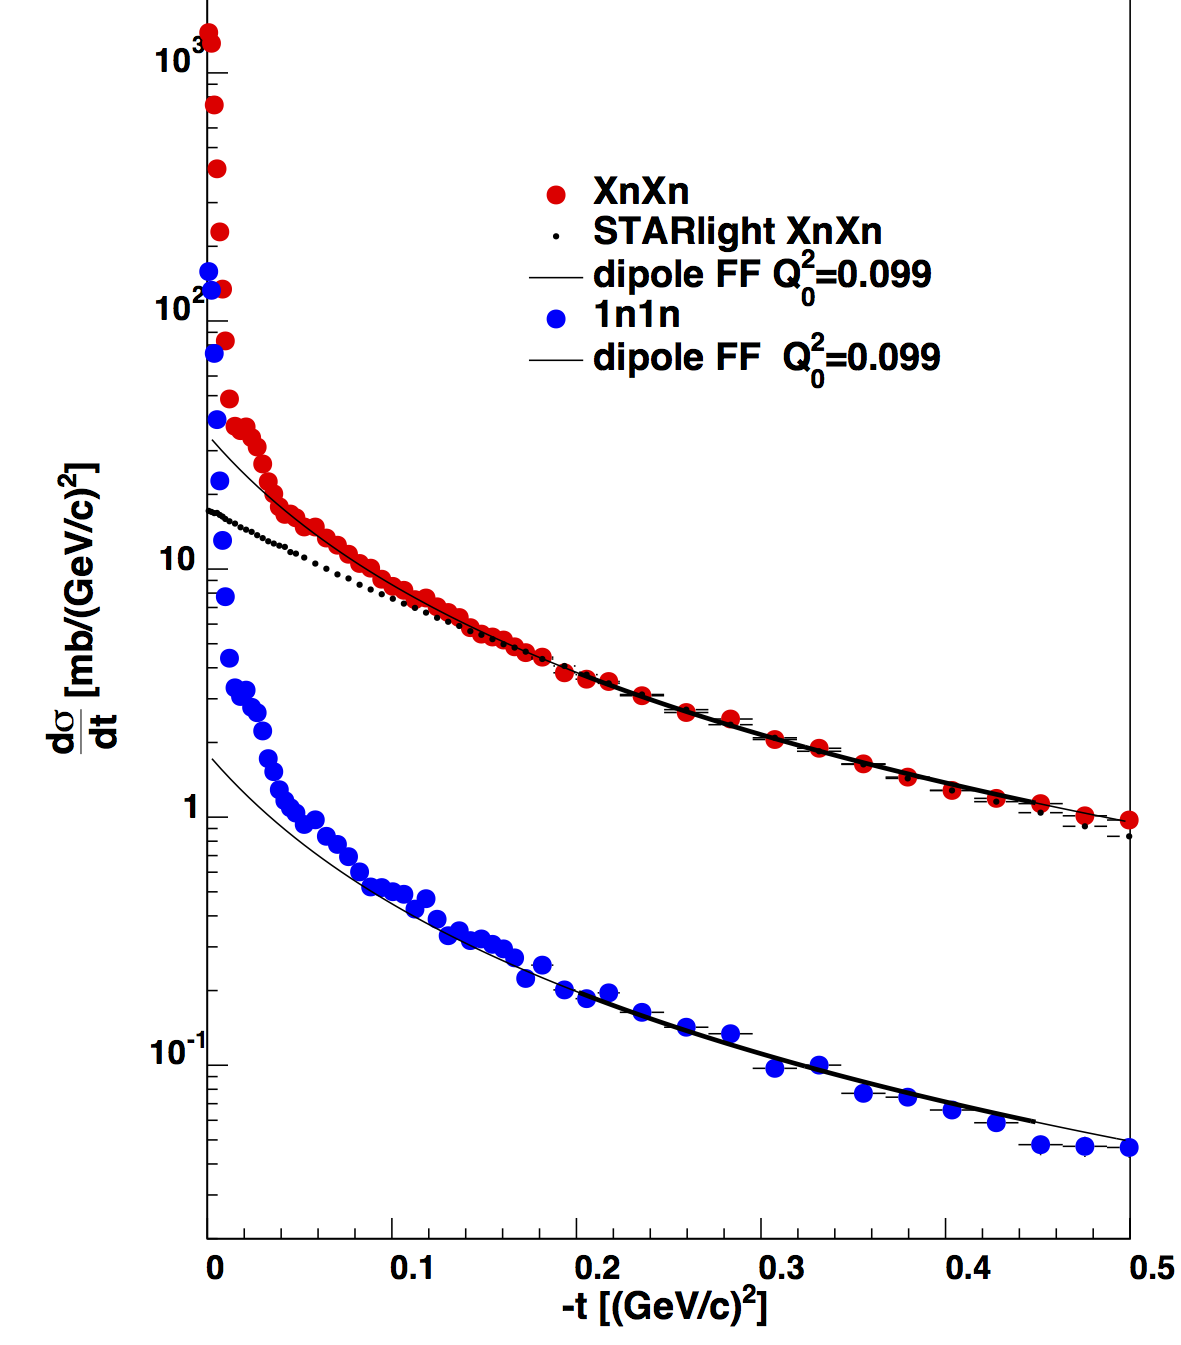
Figure 7: The −t distribution for exclusive ρ0 mesons in events with 1n,1n mutual dissociation (blue markers) or XnXn (red markers). The high t part of those distributions, which is dominated by the contribution from incoherent interactions is fit to a dipole form factor, shown with a thin line. The STARlight prediction for the incoherent contribution is shown by the histogram with small black markers.
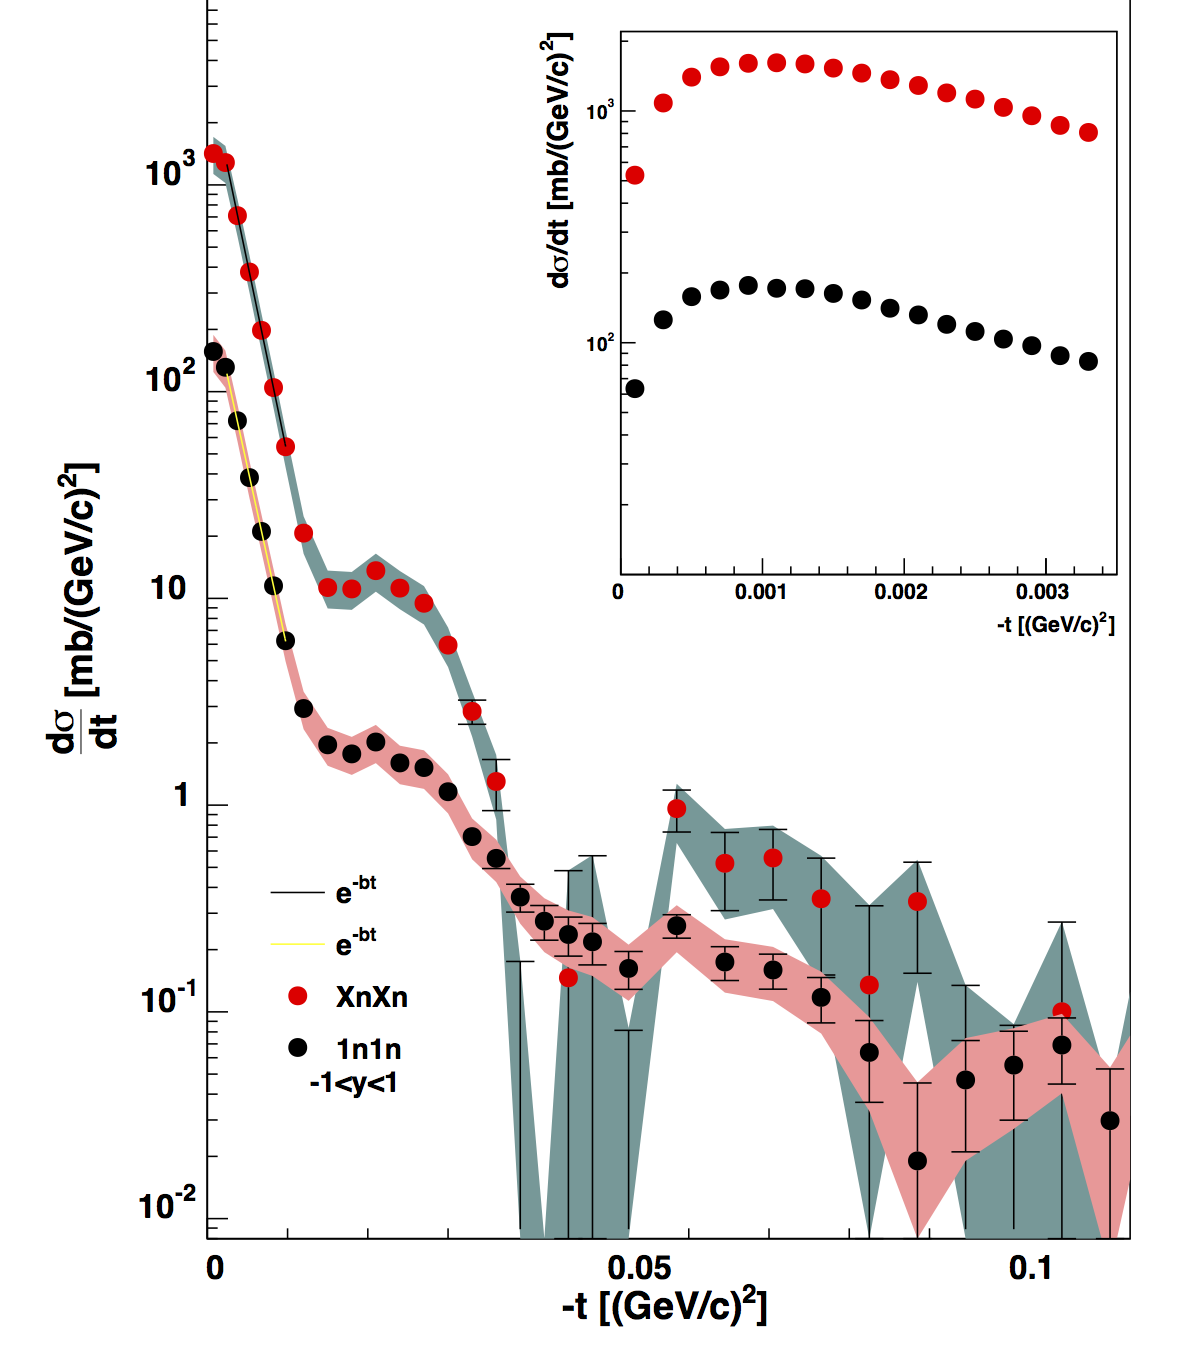
Figure 8: Fully normalized coherent diffraction patterns for ρ0 mesons detected in exclusive XnXn events is shown with red markers. The same distribution but extracted from 1n1n events is shown with black markers. The filled bands shows the sum in quadrature of all systematic uncertainties listed in table 4 and the statistical errors, which are shown as vertical lines.The insert shows, with finer binning at low pT , the effects of the destructive interference between photoproduction with the photon emitted by any of the two ions.
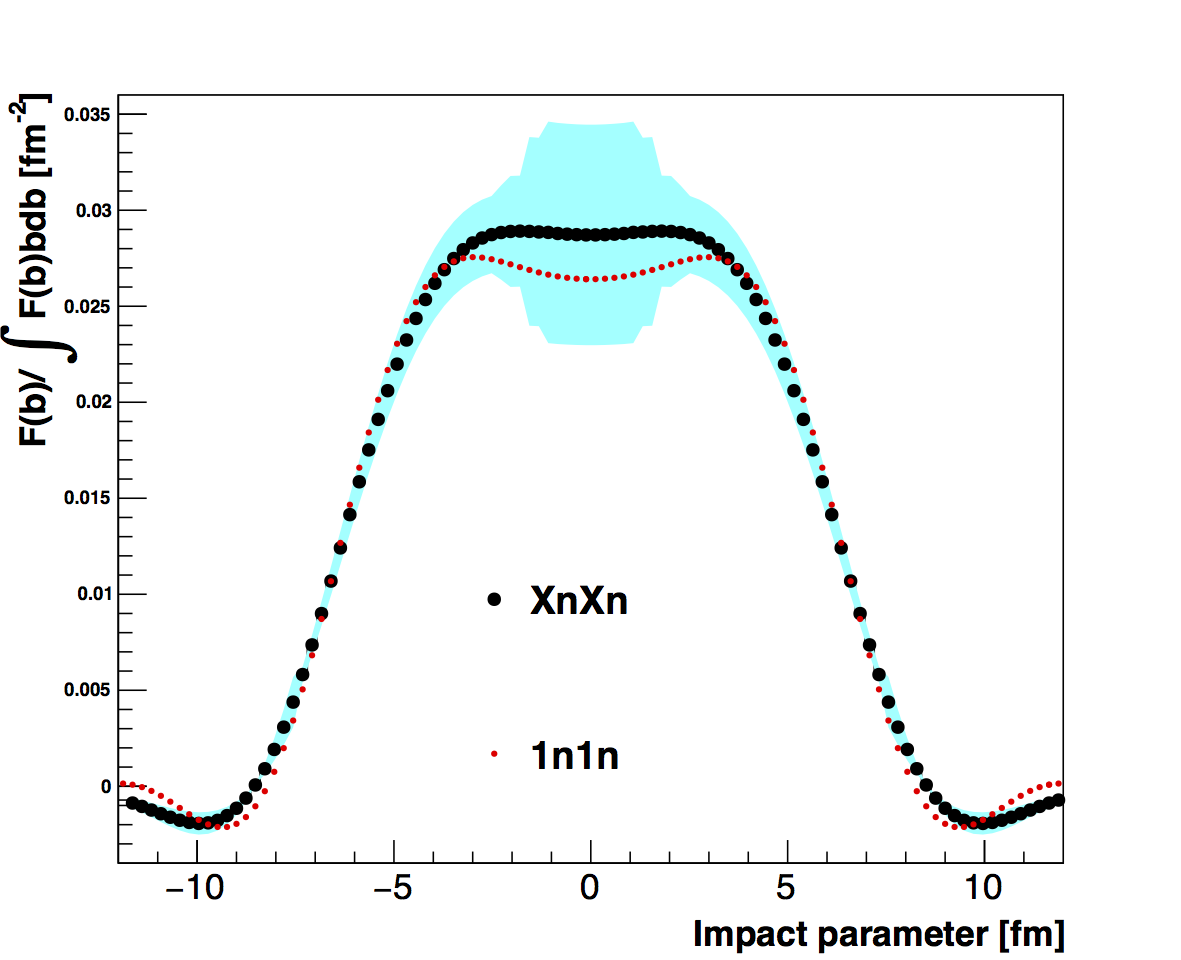
Figure 9: The normalized nucleon distribution in the transverse plane, the result of a two- dimensional Fourier transform (Hankel transform) of the XnXn and 1n1n diffraction patterns shown in Fig. 8. The integration is limited to a region where data is available; in the range 0 < |t| < 0.06 GeV2. The cyan error band shows the effect of changing the maximum t to 0.05, 0.07 and 0.09 GeV2. In order to highlight the similarity of both results at their falling edges, the resulting histograms are scaled by their integrals from -12 to 12 fm. The FWHM of both transforms is 2 × (6.17 ± 0.12) fm consistent with the coherent diffraction of ρ0 mesons off an object as big as the Au nuclei.
Paper conclusions:
In conclusion, STAR has made a precision study of ρ, ω and direct π+π− photoproduction in 200 GeV/nucleon gold-on-gold ultra-peripheral collisions, using 394,000 π+π− pairs.
We fit the invariant mass spectrum to a mixture of ρ, ω and direct π+π− (including interference terms). The ratio of ρ to direct ππ is similar to that in previous measurements, while the newly measured ω contribution is comparable with predictions based on on the previously measured γp → ωp cross section and the ω → π+π− branching ratio. The relative fractions of ρ, ω and direct π+π− do not vary significantly with rapidity, indicating that they all have a similar dependence on photon energy.
We also measure the cross section dσ/dt over a wide range, and separate out coherent and incoherent components. The coherent contribution exhibits
Analysis note (STAR Note psn0650)
The current version of the note can be found at: STAR/system/files/userfiles/2729/file/Main_analysisNote_RhoDiffraction.pdf
Section 9.7 has detailed instructions on how to reproduce the UPC pico-dst used in this analysis and the macros used to generate the figures of the paper.
The code for this analysis is stored in STAR CVS, to retrieve it do:
cvs co offline/paper/psn0650
Paper drafts:
First_draft - First circulation to UPC PWG
Second_draft - request for a GPC
Third_draft - first GPC revision
Fourth_draft - Oct. 24, 2016 - version for collaboration review
Final Draft - Feb 7, 2017. This is the final version, after collaboration review and GPC approval. It includes the current author list and acknowledgements, as of Feb. 7th. Also attached are detailed responses to the collaboration comments, in a single document.
Final, Final draft., Feb. 20th, 2017. This is the version after including comments from Norbert Schmitz. The response to Norbert is here.
May 10, 2017. The Physics Letters B Referee Report is here.
May 10, 2017. After discussion with the GPC, we decided to sent it to Physical Review C., with a very few changes in response to the PLB referee reports. The Physical Review C version is here.
September 26, 2017. After four months, PRC sent us a positive referee report, which is attached here. Our proposed response is attached here, and the revised manuscript is attached here.