Second Iteration
Same procedure as First Iteration. Took 600k events in runs 8089017, 8089019, 8089021. This time the processing went smoothly and I was able to analyze ~all the events that were taken. Here's the summary of slopes vs. eta: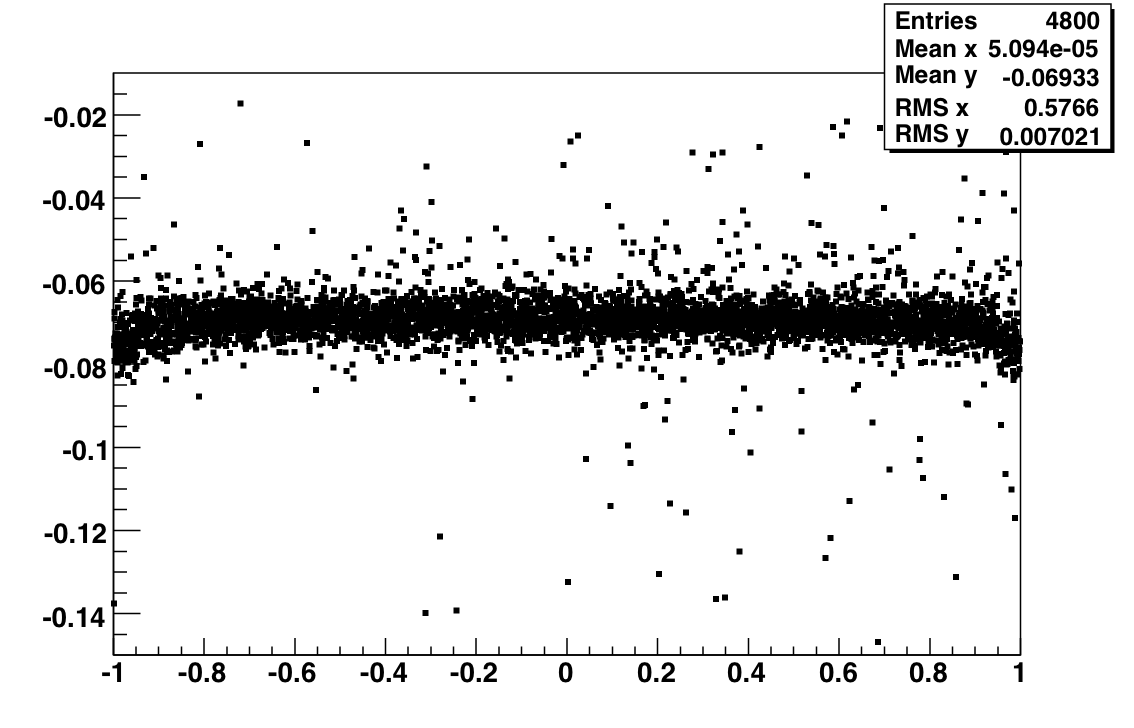
I've attached at the bottom of the page lists of slopes for individual towers. The format is the same as before, although I've adjusted the chi2 cut to 300 because of the additional statistics and I've also adjusted the 4*RMS slope cut to take into account the updated mean and RMS values from the plot above.