At the moment FGTEventDisplay incorporates much of the code that we've been using to generate plots, and allows the viewing of individual events. It's certainly not perfect (and it will likely be replaced at some point in the near future), but since it contains this functionality, I thought I might give a brief overview of what it can currently do and how to use it.
Here's what it can do:
* Calculate and display pedestals
Currently, pedestals are calculated from the first 1000 events in a file. These pedestals are only calculated the first time a daq file is viewed using the FGTEventDisplay, when the APV range is changed, and when you force the pedestals to be recalculated. Otherwise, it saves the pedestals to a file in the FGTEventDisplay directory.
When the pedestals are displayed, they are displayed as ADC response per channel. Three graphs are shown with error bars, at 1, 2 and 3 sigmas. Many of the algorithms in the code use the three sigma cutoff when accepting an ADC response for use.
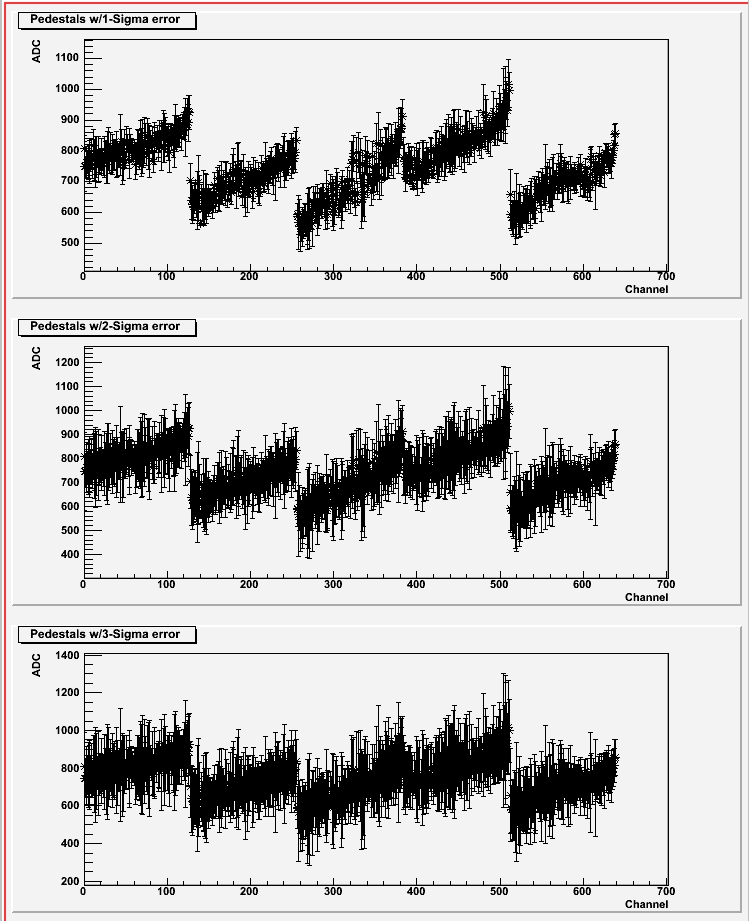
Figure 1: Example pedestal plot
* Generate Radio Hits graphs
The code can generate and save radio hits plots, similar to those that I have been posting to track down the APV mapping problem. The graphs that are generated are just raw 2-D histograms that are then saved to root files. The processing done to improve the appearance of those graphs as well as applying the device boundaries are actually done by a utility macro included with FGTEventDisplay. This macro is called Display.C and is in the same directory as FGTEventDisplay.
Note that all 7 time bins are accumulated by this code separately, and all 7 time bins are saved as separate histograms to the root file.
There are two types of radio hits graphs that are generated. The first plots only the maximum hits. The algorithm finds the maximum value for each event that is above the pedestal 3*sigma and then fills that location in the histogram/radio plot. The second algorithm finds all values that exceed 3*sigma above pedestal and then fills those locations in the histogram/radio plot. These two types of graphs are saved in separate root files.
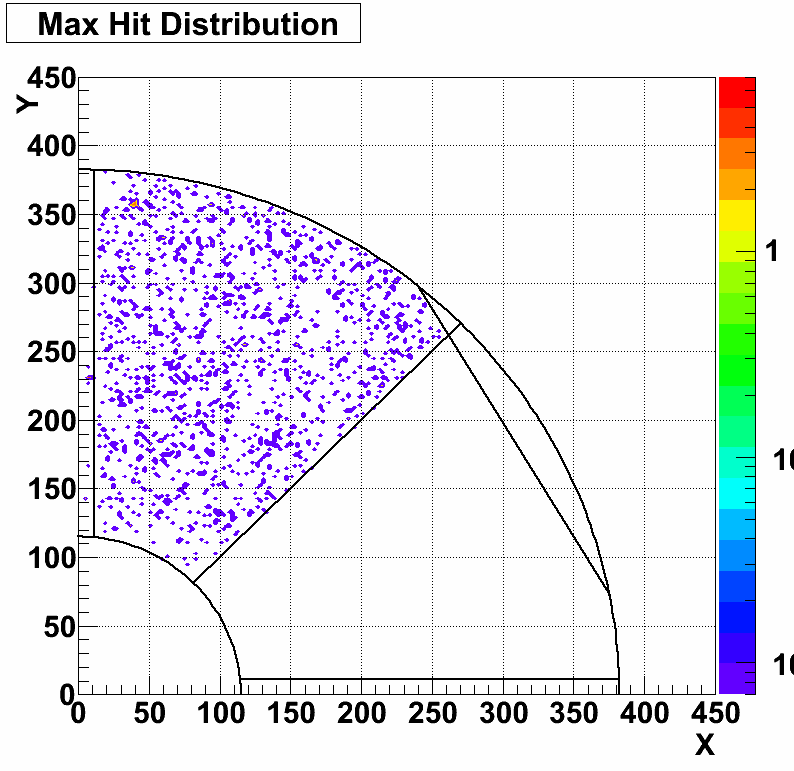
Figure 2: Example max hits plot
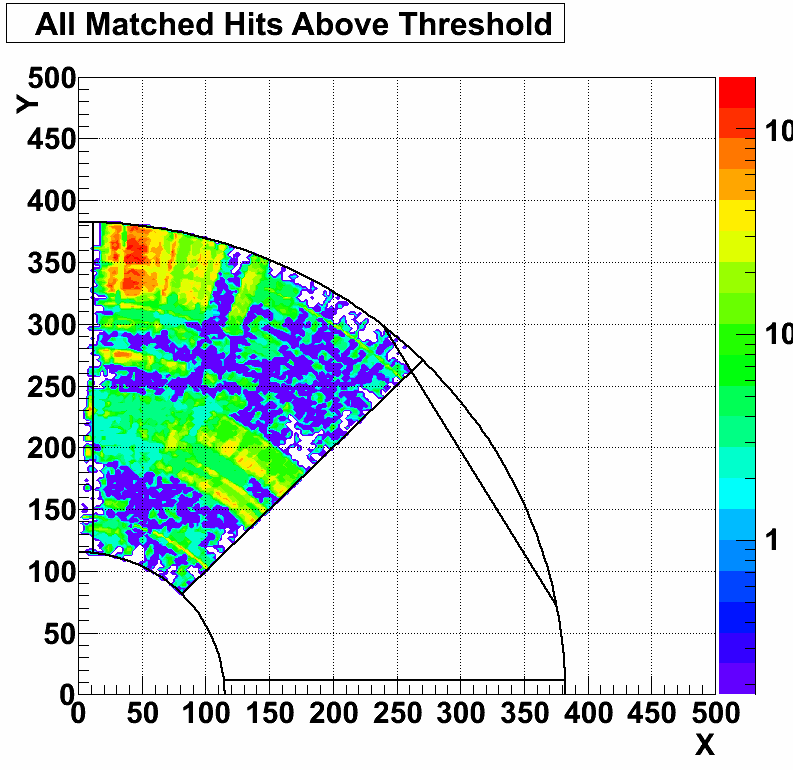
Figure 3: Example all r/phi matches plot
* Generate ADC Response graphs
This code generates and saves per-phi, per-r, and per-channel ADC response plots. Once again, these are just 2-D histograms that are then saved to a root file, and processing to improve the appearance of these plots was done in Display.C. The algorithm selects all ADC responses greater than 3-sigma over pedestal for each event. The channel number in this case is the APV number (offset so that all APV ranges start at 0) times 128 plus the actual channel number. Phi and R values are determined based on the mapping that is included with the FGTEventDisplay (this is located in fgt_mapping.txt). Once again, note that all 7 time bins are accumulated by this code separately, and all 7 time bins are saved as separate histograms to the root file.
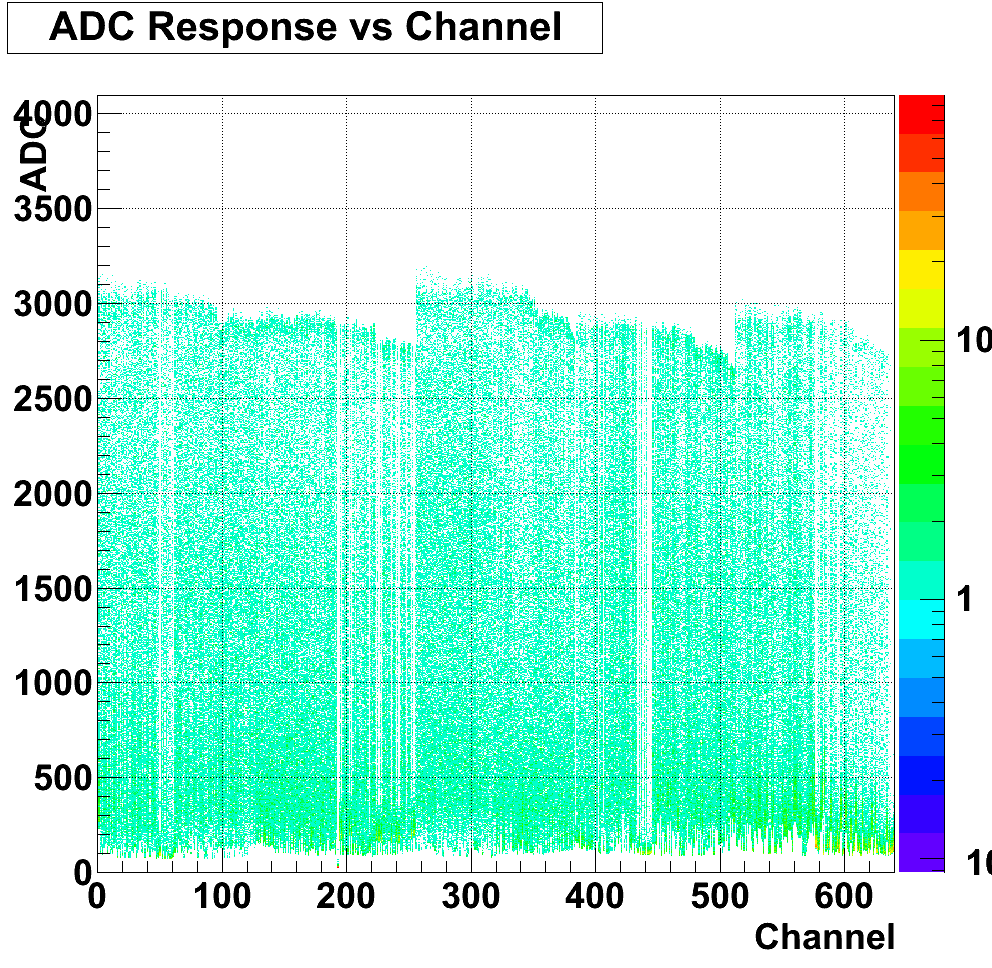
Figure 4: Example ADC response vs channel plot
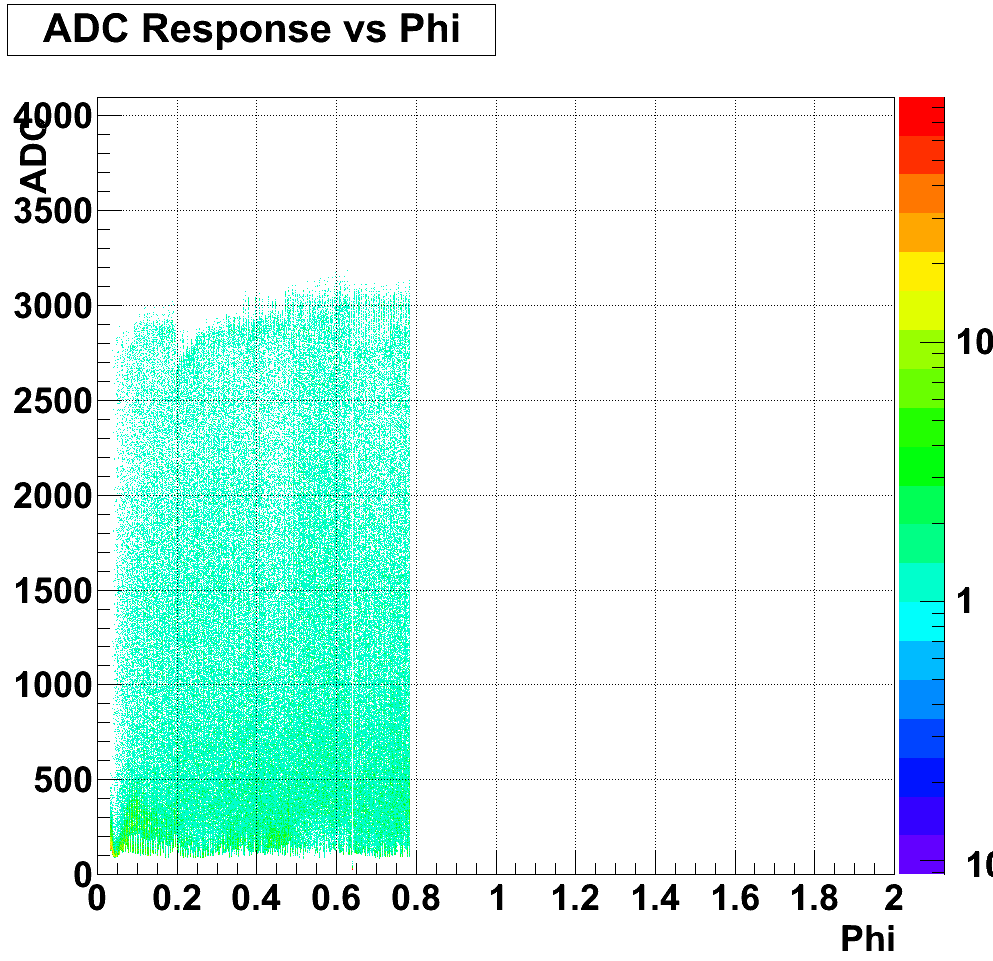
Figure 5: Example ADC response vs phi plot
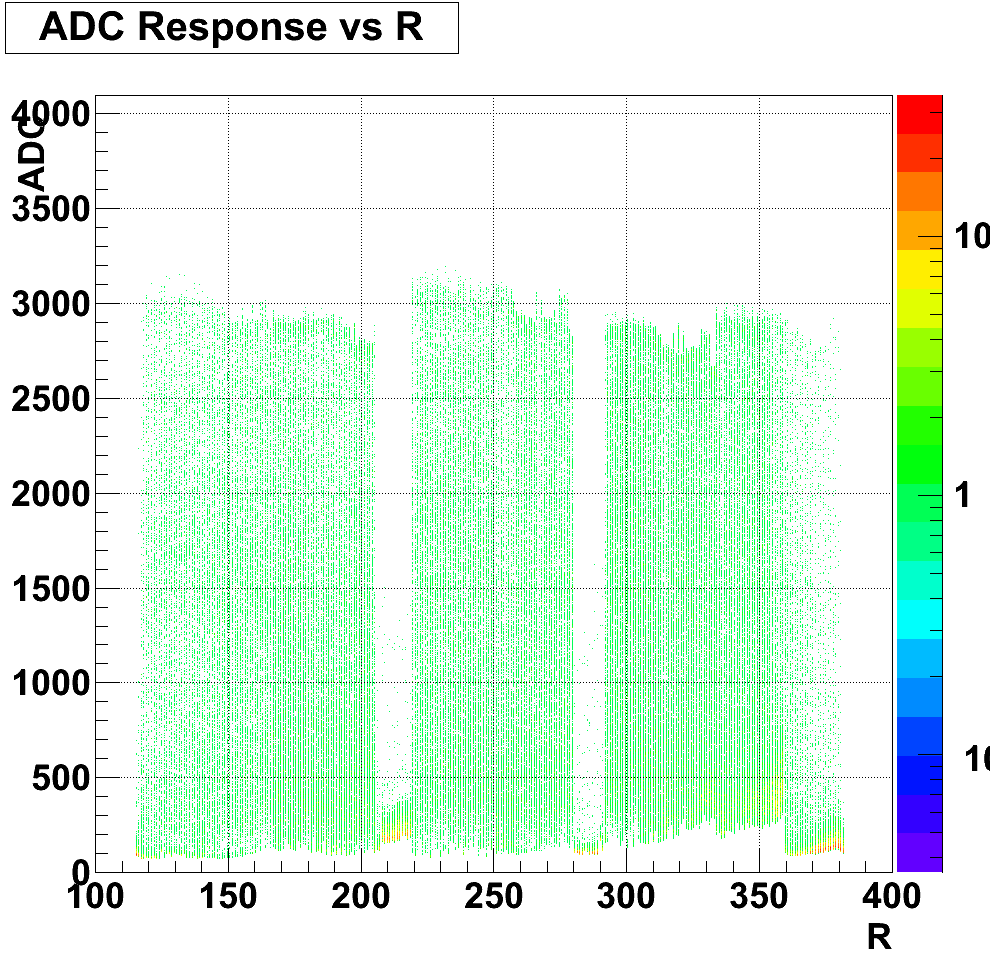
Figure 6: Example ADC response vs r plot
* Generate Raw ADC Response graphs
This code generates and saves per-phi, per-r, and per-channel ADC response plots, very similar to the above, but it does not apply pedestal subtraction or thresholds. The channel number is still the APV number (offset so that all APV ranges start at 0) times 128 plus the actual channel number. Phi and R values are determined based on the mapping that is included with the FGTEventDisplay (this is located in fgt_mapping.txt). Once again, note that all 7 time bins are accumulated by this code separately, and all 7 time bins are saved as separate histograms to the root file.
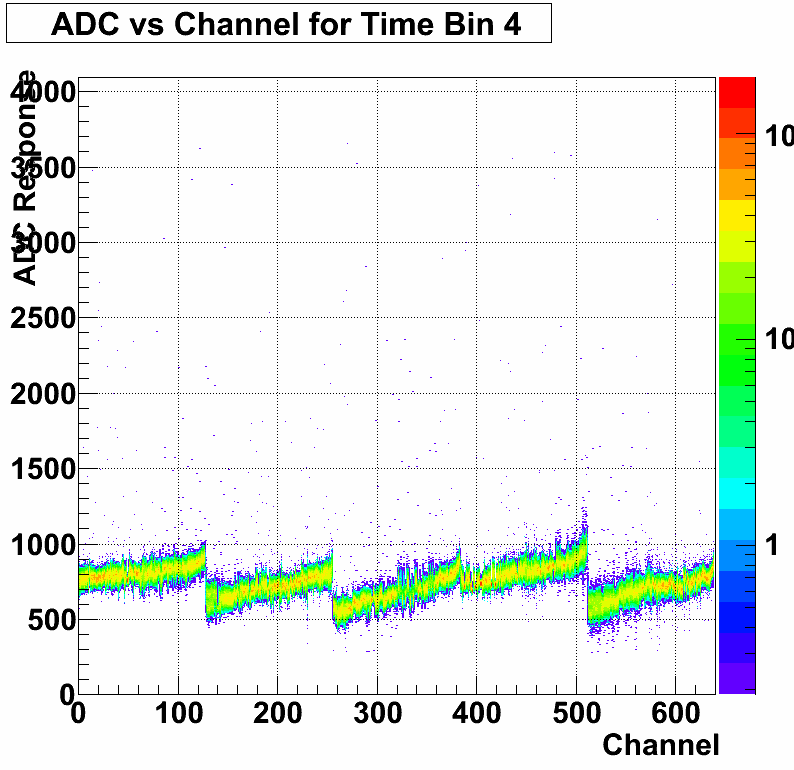
Figure 7: Example raw ADC response vs channel plot
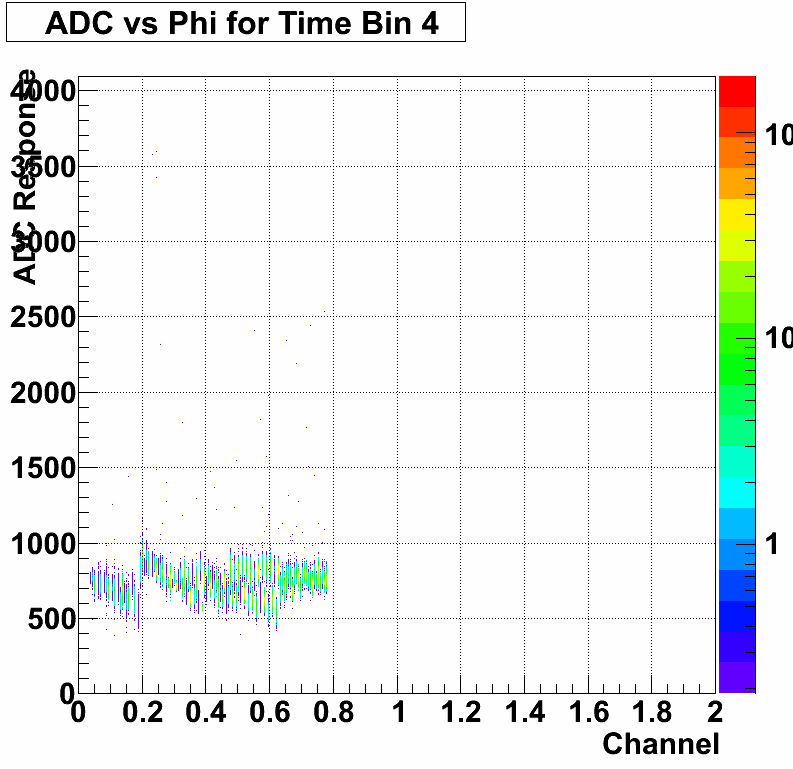
Figure 8: Example raw ADC response vs phi plot
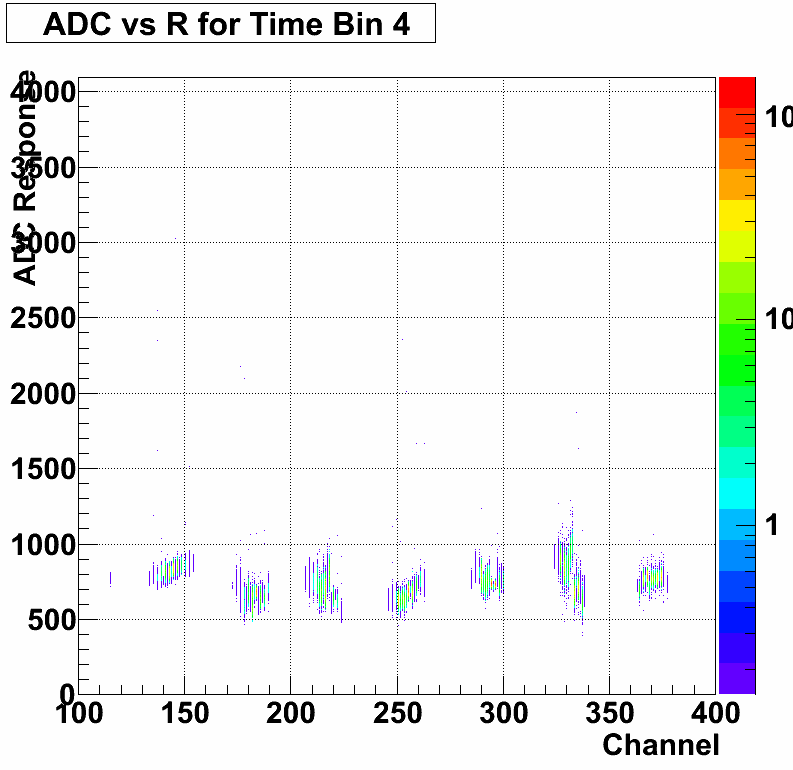
Figure 9: Example raw ADC response vs r plot
* Display individual events
FGTEventDisplay allows you to iterate both forward and (slowly) backwards through individual events in a daq file, as well as jump (slowly) to individual events. For each event, at least three graphs are shown, possibly four. The three that are always shown are ADC response versus R, ADC response versus Phi, and ADC response versus channel (using the same channel calculation method and mapping as described earlier).
The fourth graph will only display if the values for the current event are found that exceed 3*sigma over pedestal. It shows all possible hit locations in R and Phi for these values. Currently this is not a radio plot, but this may change in the future for clarity.
The time bin selected for display here is always the fourth time bin.
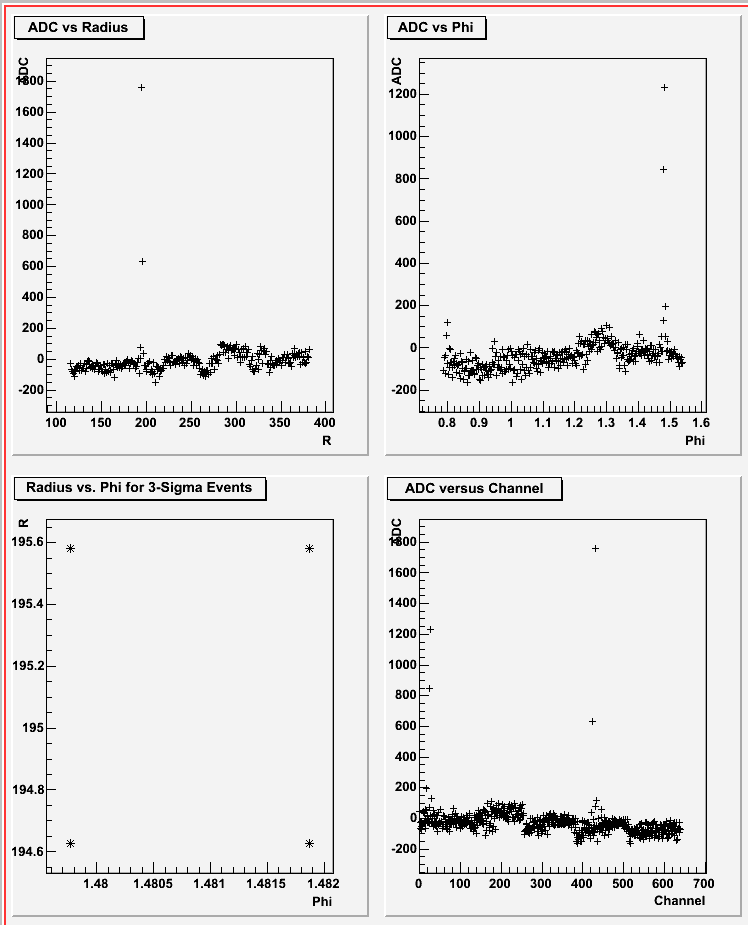
Figure 10: Example default event display plot
Anselm's clustering code is currently in a developmental version of FGTEventDisplay. We are working on incorporating a correction for common mode noise, relative R/Phi gains, and gain matching into this clustering code.
Here are instructions for downloading, compiling, and using FGTEventDisplay:
To download:
FGTEventDisplay is currently stored in a googlecode SVN repository. In order to use this repository, you have to set up your svn proxy properly so that you can contact the googlecode.com (this has already been done on fgt-ops). Probably the easiest way to do this is to attempt to download the code first by issuing the command:
svn co https://fgt-daq-reader.googlecode.com/svn/trunk/FGTEventDisplay FGTEventDisplay
This will almost certainly fail, but it should create the file ~/.subversion/servers. You will need to edit that file and by adding the following two lines to the end of the file:
http-proxy-host=proxy.sec.bnl.local
http-proxy-port=3128
Once that is done, try issuing the command again. This time it should work (let me know if it doesn't), and it should create a directory FGTEventDisplay containing all the program files. From then on you can just update that working copy to get updates by issuing the command
svn update
in the FGTEventDisplay directory. This should automatically merge changes into your files, without clobbering your own changes, although if there are conflicts you may have trouble.
If you want or need access to this repository, please send e-mail to Dr. Fatemi and let her know. At that point she'll probably ask me to add you, and I'll try and remember how to do that.
To compile:
Go into your FGTEventDisplay directory and issue the command:
make
Compilation stuff should happen, and you should be left with an FGTEventDisplay executable.
Please note that you should NOT use Rts_Example.sh to compile. I can't guarantee that it will work, and it is included in the repository only for historical reasons (because, historically, we've been too lazy to remove it).
To run:
Go into your FGTEventDisplay directory (this is IMPORTANT. . . the code will not run from another directory) and issue the command:
./FGTEventDisplay <location of DAQ file>
Replacing <location of DAQ file> with the actual path to a DAQ file.
This will start the program. The code will either automatically generate or load pedestals, depending on whether or not they have already been calculated by some previous run.
Then the program will show the main text menu. The menu lists most of your options, and most of them should be pretty straight forward.
However, there are a few things that should be mentioned. First, by default, the code will assume that you are using the APV range 17 through 21. If you are using a different range, you need to set that difference in the program options, and currently the software only supports ranges 17 through 21 and 12 through 16. To get to options, just type "o" at the main menu. Once there, type "a" to change the APV range. then press "q" to return to the main menu. Doing this will now AUTOMATICALLY force pedestal recalculation, so at this point you should be able to use the code normally.
Also, in options you can tell the program to display bar graphs when displaying events (instead of scatter plots), and change the marker style in the scatter plots. These ONLY effect the event display.
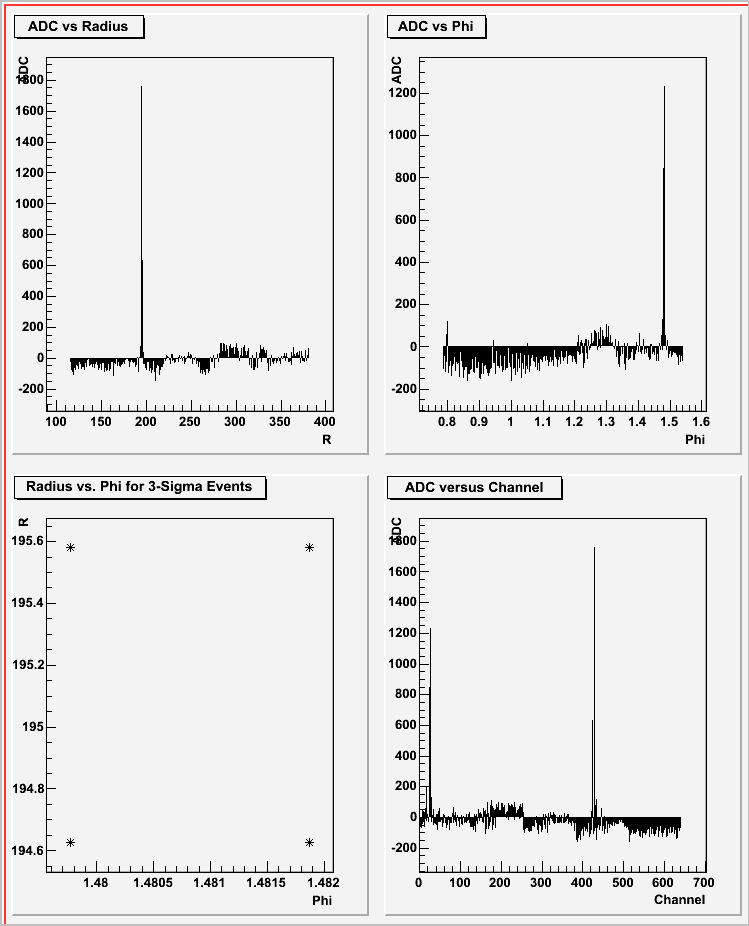
Figure 11: Example default event display with bars
The event display plots do not currently allow any user interaction. This is unfortunate, and I'm planning on fixing it in the future, but right now nearly all x-windows events are ignored by that window, so resizing and clicking and even moving it off screen (for some window managers) will not work as expected.
The daq reader does not have a mechanism for iterating backwards, or a mechanism for jumping to an arbitrary event. As such, iterating backwards (using "h" or "k") may be very, very slow, as the program has to iterate forwards from the beginning of the daq file to the previous event. Similarly, though I have tried to make it as efficient as possible, jumping to an event may be very slow (although, jumping to an event *forward* of your current position in the file will start from your current position, so it should be more efficient).
When jumping to an event directly, you should use the event number that is displayed by the program in the main menu as you are iterating through the daq file. That event number should appear right above the command prompt.
Finally, many of the plots above are colorful and contoured. These are not the raw images that the FGTEventDisplay will produce. With the exception of the individual event display and the pedestal display, FGTEventDisplay will produce root files containing histograms. Generating the plot for these histograms must be done separately. A macro, Display.C, is included with FGTEventDisplay that can be used to generate these nice, colorful plots, however it currently requires modification to function with every possible root file and contained histogram.