Timing Scans for the Barrel: Take 0
Introduction
These plots are my first pass at making plots for the fine timing scans done for the barrel.
The relevant runs and timings are:
| Run | Timing |
| 8337070 | 38 |
| 8337071 | 34 |
| 8337072 | 36 |
| 8337073 | 37 |
| 8337074 | 35 |
| 8337075 | 35 |
| 8337076 | 39 |
| 8337077 | 33 |
The nominal timing is 36 ns, corresponding to run 833702.
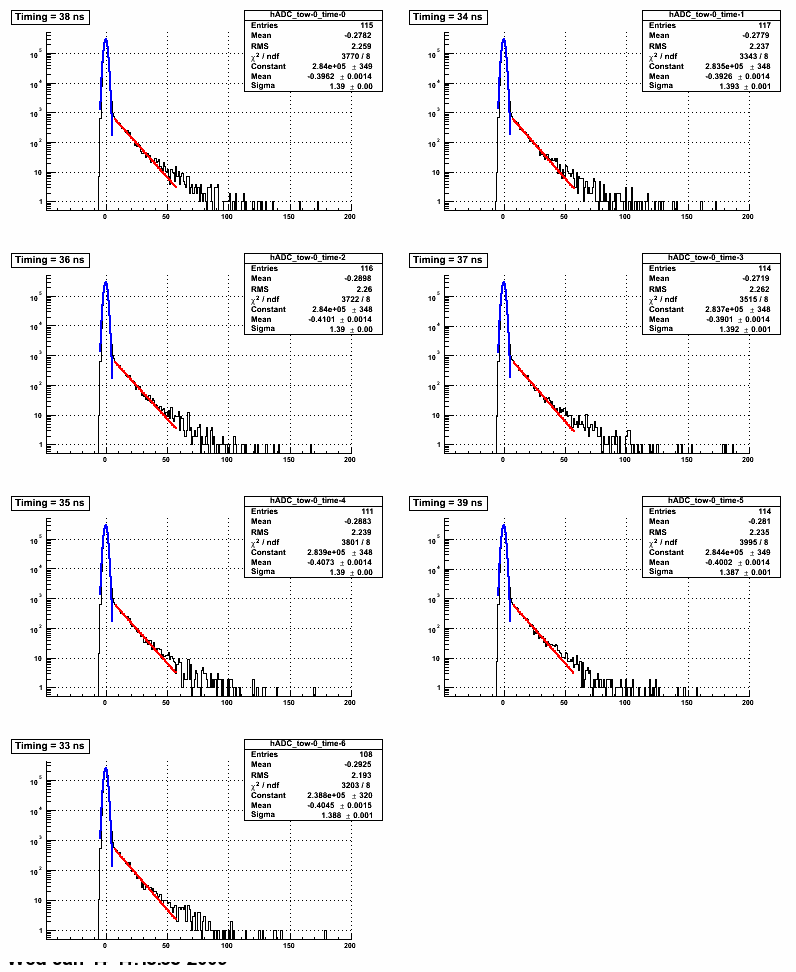
I use the code in StRoot/StEmcPool/StEmcOfflineCalibrationMaker to produce 2-d distributions of the ADC count vs. the tower ID at each of the points. Next, for each tower, I fit the ADC distribution to find the pedestal. I fit the tail to an exponential from an ADC count of 5 sigma above pedestal to 50 counts above that number. The Figure below shows an example of the fits for a single tower (the first tower) at each timing point.

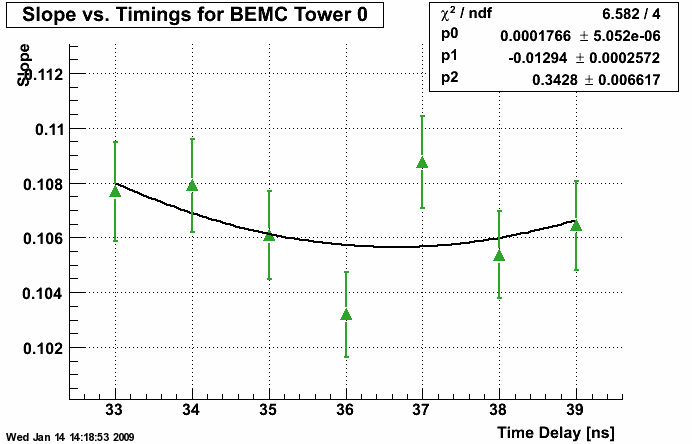
Then I plot the (absolute value of the) slopes versus the timing. The figure below shows this plot for the tower above. The fit is a quadratic function.

Results
Because there are 4800 towers in the barrel it is difficult to look at end one individually. I have instead averaged the slope for every 100 towers and each half barrel. If the slope can not be fit to better than 2-sigma (slope/err<2) I do not include the tower in the average for that timing point. This excludes a total of 334 towers at the nominal timing. Even with this cut, some of the fits are poor and this is reflected in the size of the error bars. The timing scans with the slope average every 100 towers are given in the attachment.
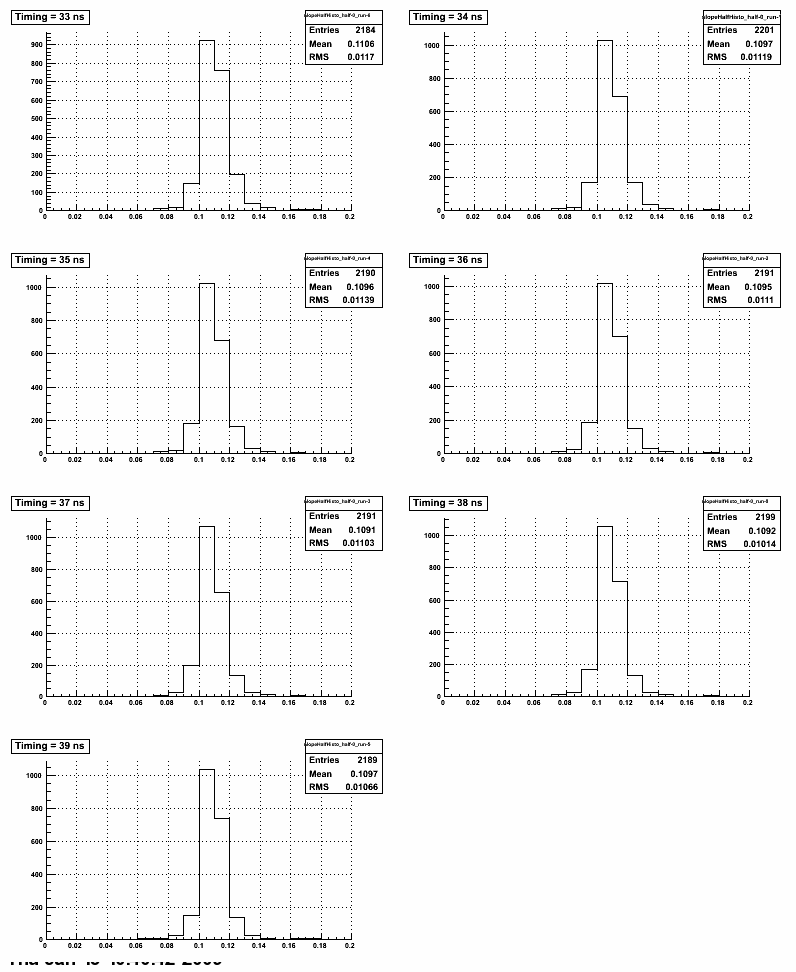
Below are histograms of the slopes at each timing point for the first half barrel (towers 1-2400).

and the average slope vs. timing:
.gif)
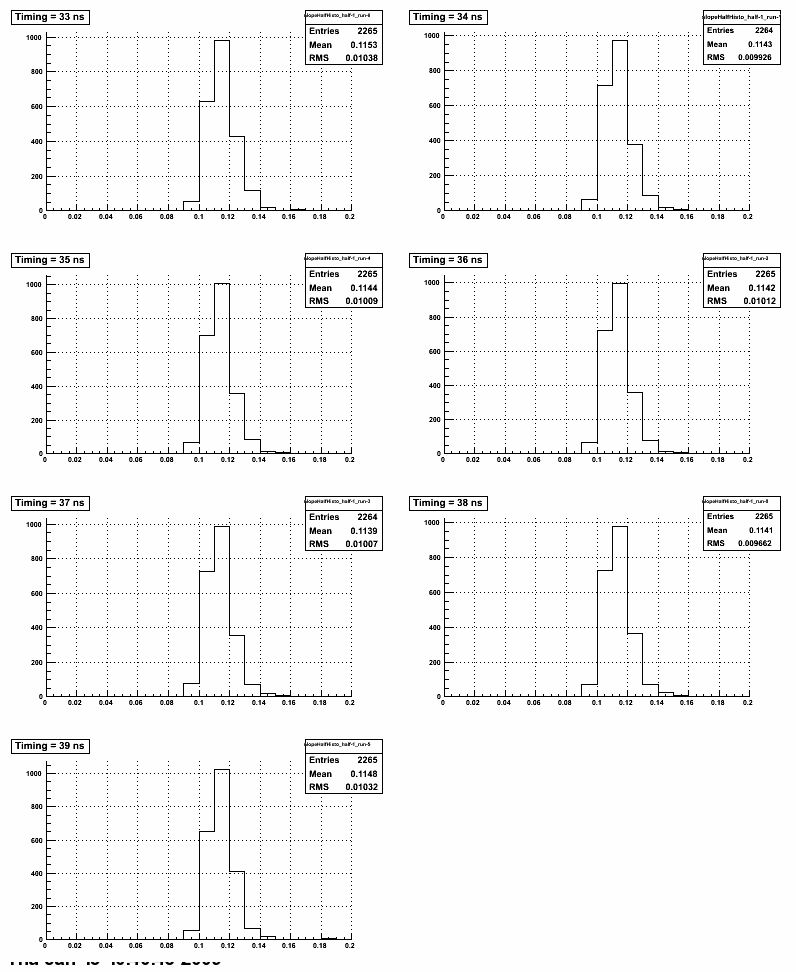
The result for the second half barrel (towers 2401-4800). First, a histogram of slopes at each timing point and then the average slope versus time delay.

.gif)
- aliceb's blog
- Login or register to post comments
