ZDC SMD Data Analysis
About
This page shows the results of my version of Melissa's code, which can be compared with hers. It also tells you how to run the code if you want to do this yourself. All code you need is attached (just rename the files without the .txt extension).
My results
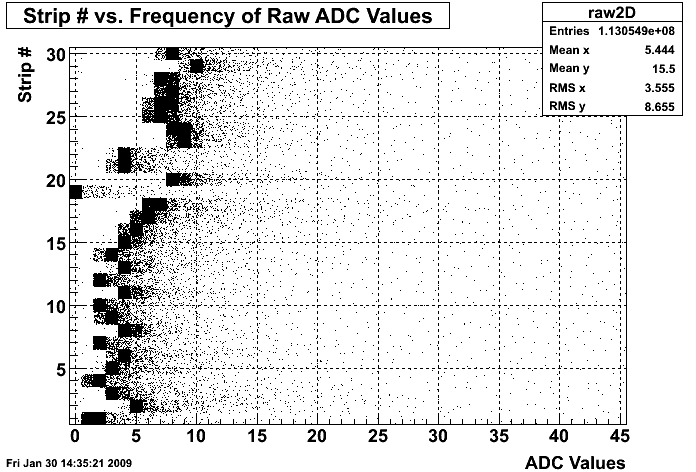
The first step of the analysis to to correct the ADC spectrum of each slat for the pedestal and gain. The distribution of raw ADC values if shown below. The ordering of the slats (labeled strips here by accident) are: east vertical (1-7), east horizontal (8-15), west vertical (16-22), west horizontal (22-30).
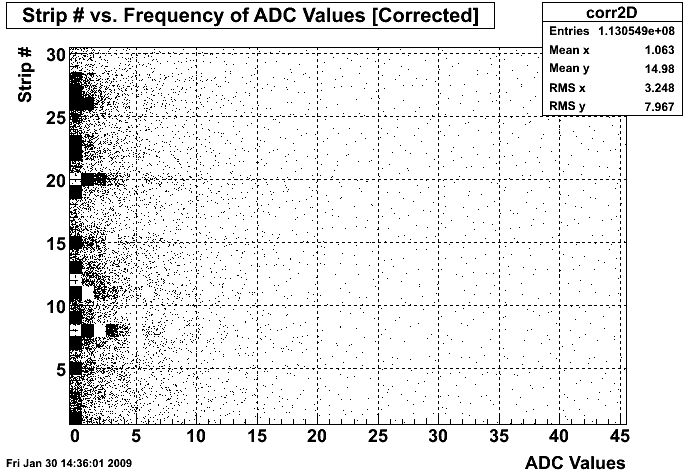
The corrected spectrum is shown below. I had a hard time getting good fits for some slats. More statistics would improve this.
Finally there is a threshold cut of 6 made. Good hits are found by looking for a vertical and horizontal coincidence. For each event the hit with the highest ADC value is counted. The text file zdcCounts.txt has the counts for each east/west detector and spin state according to horizontal and vertical slat number.
The asymmetries I obtain are presented in the table below:
| Luminosity | Geometry | Physics | |
| East Left-Right | -0.0951(0.0022) | -0.3205(0.0020) | 0.0141(0.0022) |
| East Up-Down | -0.0980(0.0019) | -0.3908(0.0016) | -0.0028(0.0019) |
| West Left-Right | -0.0903(0.0025) | -0.3267(0.0022) | 0.0158(0.0025) |
| West Up-Down | -0.0946(0.0021) | -0.3581(0.0018) | -0.0021(0.0021) |
My results for all but the geometry asymmetry are consistent with Melissa's results, within the uncertainties. The geometry asymmetry results are very sensitive to the pedestal and gain correction, which is, in turn, very sensitive to statistics and the inital parameters of the fit. I'm not very concerned about these differences.
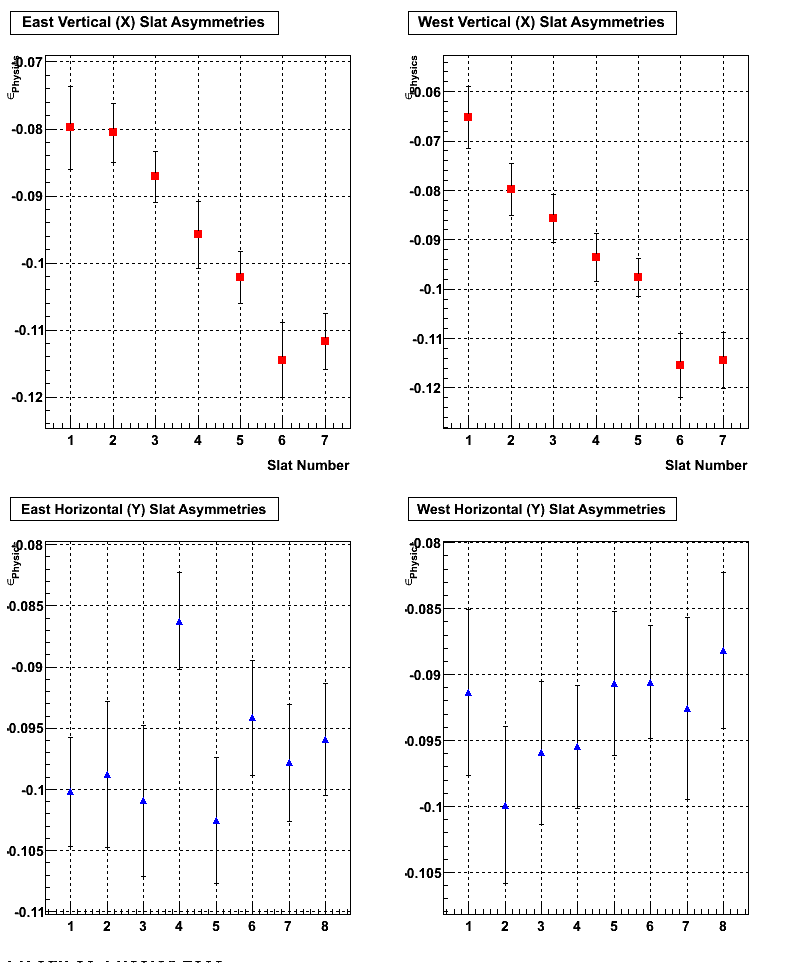
The slat-by-slat asymmetries are shown in the plot below. They appear consistent with Melissa's result.
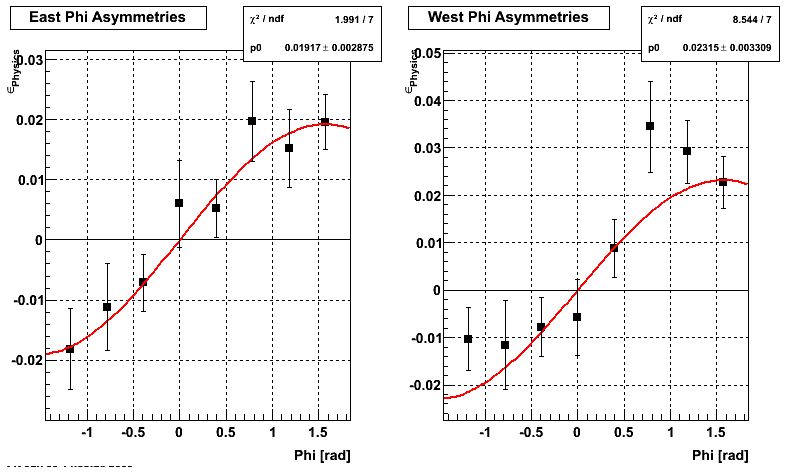
The asymmetry in phi is presented in the plot below. It also is consistent with Melissa's, meaning we obtain consistent analyzing powers.
Running the Code
Steps:
(1)First we strip the MuDsts for the run down to just the information that we need. This is accomplished with the code (from Jason) makeZdcTree.C . This code will need to be run on the farm. The xml file zdc.xml and the script submitzdc should do the trick - just modify zdc.xml to point to the correct areas, make the filelists, and do ./submitzdc, but I have not rigorously tested these scripts to make sure that the submission works properly. The code readZdcTree.C can be used to check that the ZDC trees contain the right information and are readable.
(2)Analyze this small ZDC tree to produce histograms of good hits in each vertical/horizontal slat of the ZDC SMD for both the east and west directions and each spin state. This is done with zdcAna.C. The input to this program are the number of events to loop over and the location of the zdc trees. If you run over a large number of events you need to run this on the farm. Use submit.xml to do this with: star-submit submit.xml, changing submit.xml to point to your areas. The output will include a .root file with a bunch of histograms, a text file with the counts of good hits in each slat and a .ps file showing the fits to the ped and gain for each slat.
(3)Calculate asymmetries. If you prefer excel (not me), the code in step 2 creates a text file with all the numbers you need. If you don't, I have an example root macro, ana.C, that calculates everything and makes a few plots. It would also need to be extended for the +- and -+ states.
- aliceb's blog
- Login or register to post comments