Analyzing runs 10066001-114
Introduction
Runs analyzed:
10066001 10066007 10066013 10066065 10066107 10066114
10066002 10066008 10066014 10066069 10066108
10066003 10066009 10066015 10066072 10066110
10066004 10066010 10066016 10066073 10066111
10066005 10066011 10066018 10066102 10066112
10066006 10066012 10066062 10066104 10066113
These runs have about 5 million events in them.
Spin Pattern
The spin pattern has change.d Now have 3 filled bunches and 1 unfilled (thank you, Ramon!). New pattern:
5, 9, 6, 0, 10, 9, 5, 0, 10, 6,
5, 0, 9, 6, 10, 0, 9, 5, 10, 0,
6, 5, 9, 0, 6, 10, 9, 0, 5, 10,
6, 0, 0, 0, 0, 0, 0, 0, 0, 0,
9, 5, 6, 0, 10, 5, 9, 0, 10, 6,
9, 0, 5, 6, 10, 0, 5, 9, 10, 0,
6, 9, 5, 0, 6, 10, 5, 0, 9, 10,
6, 0, 9, 5, 6, 0, 10, 5, 0, 0,
10, 6, 9, 0, 5, 6, 10, 0, 5, 9,
10, 0, 6, 9, 5, 0, 6, 10, 5, 0,
9, 10, 6, 0, 9, 5, 6, 0, 10, 5,
9, 0, 0, 0, 0, 0, 0, 0, 0, 0,
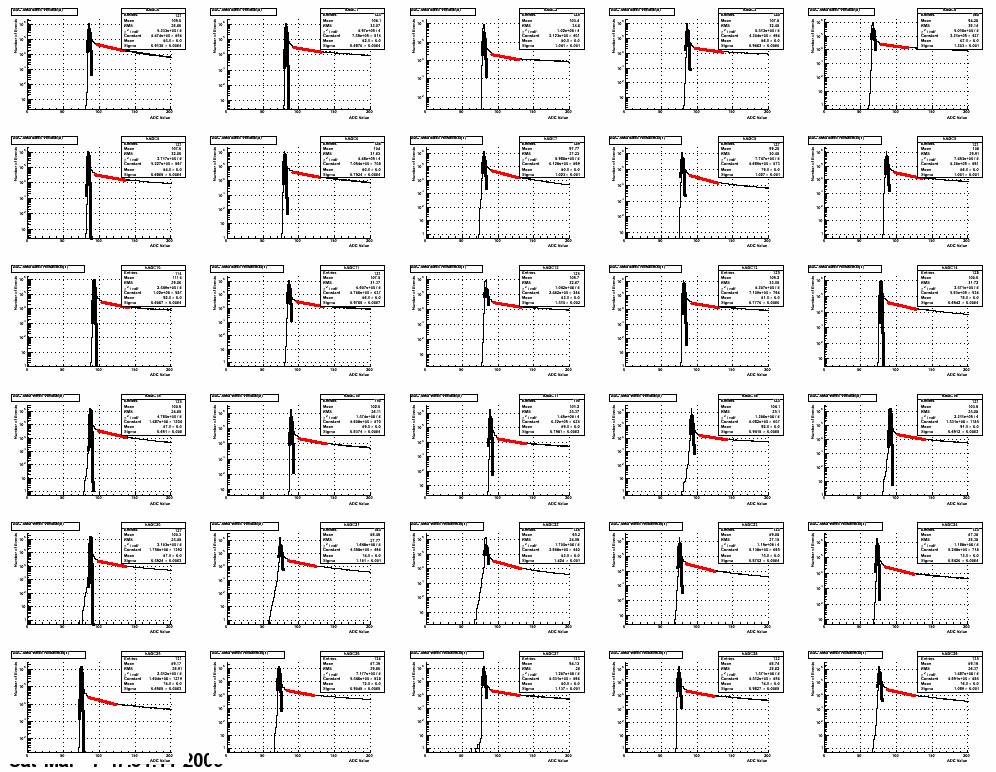
SMD Strips with fits for Ped and Gain Correction

Results
1)Slat by Slat asymmetries for average over blue beam (proportional to yellow beam polarization) and averaging over yellow beam (proportional to blue beam polarization)
East is left, west is right. Vertical is top, horizontal is bottom. Bottom right plot should say "west" horizontal not "east". I will fix this.
.gif)
.gif)
2)Phi asymmetries as above.
.gif)
.gif)
With beam polarizations of 0.369+/-0.010 and 0.270+/-0.010 for the yellow and blue beams this implies analyzing powers of 0.068+/-0.003 and 0.064+/-0.005 for yellow and blue, respectively.
- aliceb's blog
- Login or register to post comments
