I decided to take a first look at non-photonic electrons in d+Au 2008, in an attempt to do e-D0 correlations.
Cuts are mostly the default of the previous e-D0 analyses:
|vz|<40
|eta|<1.0
dcaGlobal.mag() < 1 (this is a slight change from the previous 1.5)
nFitsHit >=20
nHitsFit < 50
nHitsFit/nHitsFitPoss > 0.52
3.5 < dedx < 5
0<p/E<2
BSMD: do the cluster finder with parameters
//After andre's Mail:
ecl->SetClusterConditions("bemc", 4, 0.35, 0.35 , 0.2, kFALSE);
ecl->SetClusterConditions("bprs", 1, 500 , 500 , 501, kFALSE);
ecl->SetClusterConditions("bsmde", 5, 0.20, 0.005, 0.1, kFALSE);
ecl->SetClusterConditions("bsmdp", 5, 0.20, 0.005, 0.1, kFALSE);
Int_t clusterSizeSMDE = ((point->cluster(kBarrelSmdEtaStripId).size()>0) && point->cluster(kBarrelSmdEtaStripId)[0]) ? point->cluster(kBarrelSmdEtaStripId)[0]->nHits() : 0;
Int_t clusterSizeSMDP = ((point->cluster(kBarrelSmdPhiStripId).size()>0) && point->cluster(kBarrelSmdPhiStripId)[0]) ? point->cluster(kBarrelSmdPhiStripId)[0]->nHits() : 0;
if (clusterSizeSMDE==0)
continue;
if (clusterSizeSMDP==0)
continue;
Since the trigger simulator is still being worked on, I came up with rough cuts based on Et of the tower, i.e.
tower energy * sin(2.*atan(exp(-eta)))
I stupidly didn't include VPD-ZDCE events. Note that there is significant overlap, so the total number
of electrons with an or of the conditions
is not the sum of the individual contributions, but ~90% of this. Found 27612 total electrons in the
full P08ic dataset, scanning after the final thresholds and trigger ids were set, i.e.
<input URL="catalog:star.bnl.gov?production=P08ic,trgsetupname=production_dau200
8,filetype=daq_reco_mudst,tpc=1,emc=1,sanity=1,filename~physics,runnumber>=83440
88" nFiles="all" />
| Trigger Id |
Et threshold |
# electrons |
| 210501 |
2.64 |
6095 |
| 210511 |
3.6 |
8413 |
| 210521 |
4.3 |
13814 |
| 210541 |
8.4 |
1732 |
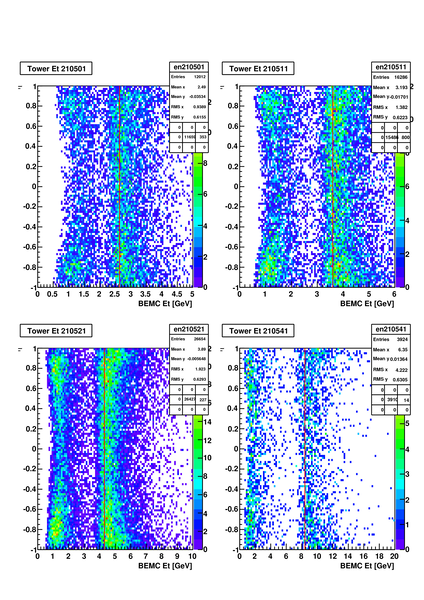
Below shows the distributions of Et with the rough Et cut. Clear edge is seen, and the cuts look
roughly correct, except for the high eta rings where there are calibration problems.
This is the distribution of tower Et for found electrons, vs. eta. The lines show the
Et thresholds above.
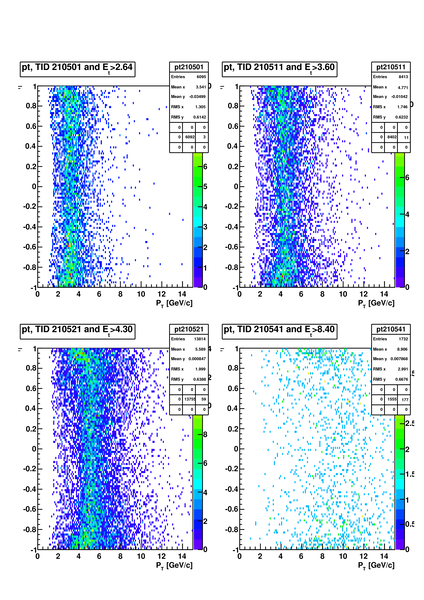
This is the distribution of pt for electrons vs. eta, after the offline thresholds applied above.
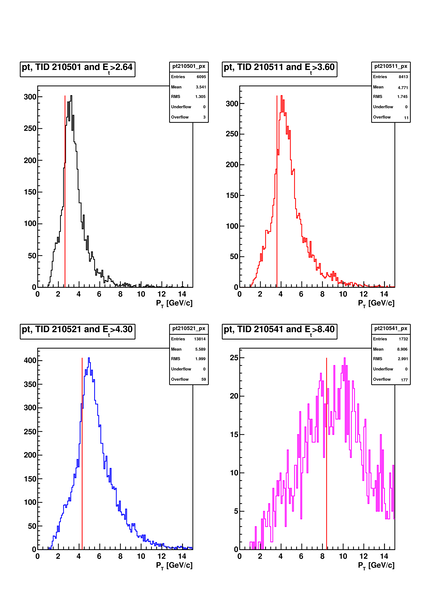
This is the distribution of pt for these electrons.
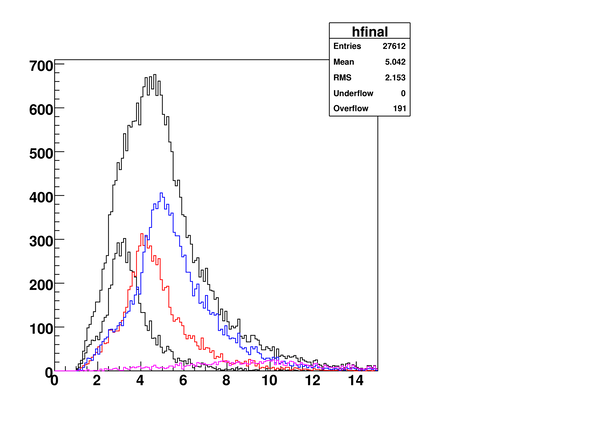
And, finally, this is the distribution of the OR of the four conditions
(isTrigger(trigId) && Et>threshold), along with the individual distributions.
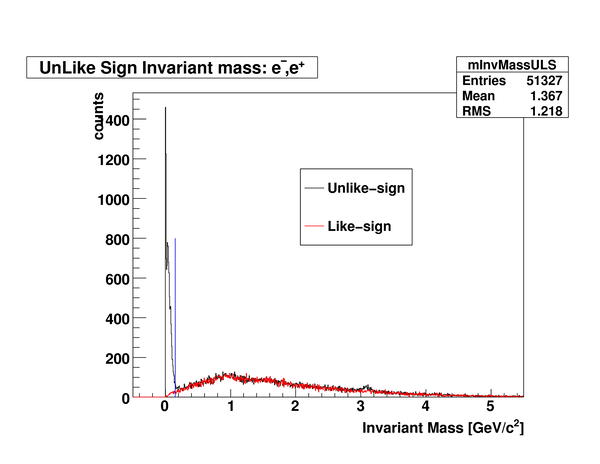
I also looked at reconstructing photonic electrons. Below is the distribution
of 3D invariant mass for all electrons (without the trigger id/threshold cuts, unfortunately).
Note the J/Psi peak. The line is at 0.15 GeV/c^2, which is taken to be the selection of
"Photonic"
With a further cut that the |eta|<0.7 (avoiding the rings
at high eta, could probably do this better), I did a simple labeling of electrons into "photonic" and
"semi-photonic".
The electron was labeled semiphotonic if a pair between it and another particle
Not quite right to do this, since in principle an electron can't be labeled but should be
used multiple times, but this was a quick and dirty way to do it.
The binning is (I think to match the high pt charged particle paper)
Double_t bins[19]={2.,2.1,2.2,2.3,2.4,2.6,2.8,3.0,3.35,3.8,4.40,5.10,6.00,7.
00,8.00,9.00,10.00,12.00
,15.00 }
;
Logic is from Andre:
Loop through all globals, and then ask
Start out with minv1 =1
minv2 = 1
Then, for every pair:
If ULS && mass<0.15
minv1 = -1
If LS && mass<0.15
minv2 = -2
return minv1*minv2.
There are four cases:
-2 has LS with mass<0.15 and no ULS with mass<0.15
-1 has no LS with mass<0.15 and has ULS with mass<0.15
+1 has no pair with mass<0.15
+2 has both a LS and an ULS with mass<0.15
(-2 || +1) == "Non-photonic"
(-1 || +2) == "Photonic"
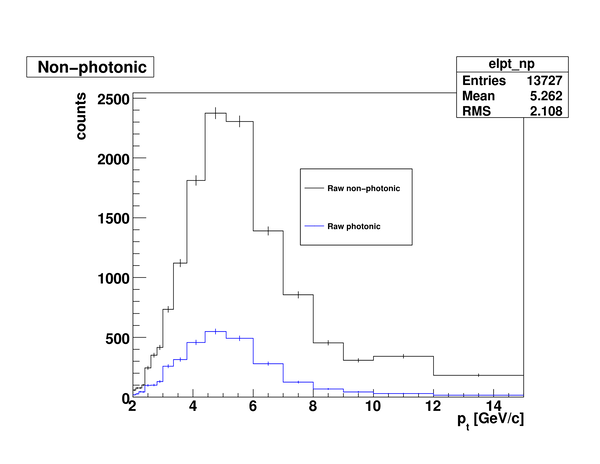
Statistics are below
| -2 |
78 |
| -1 |
3135 |
| +1 |
13649 |
| +2 |
46 |
So it is dominated by either no pair or just an ULS partner.
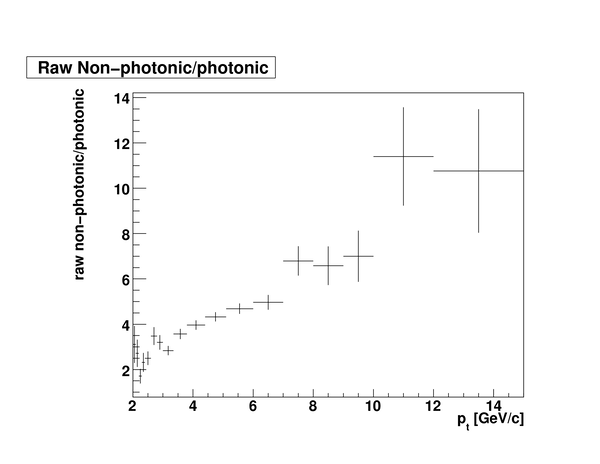
Momentum distributions and ratios are below with these definitions.
I also looked at cutting on central events, bbcE>=1377.
Statistics were:
| -2 |
35 |
| -1 |
1112 |
| +1 |
5018 |
| +2 |
18 |
So ~1/3 of the electrons happen in central 0-20% events.
Distributions and ratios are below.
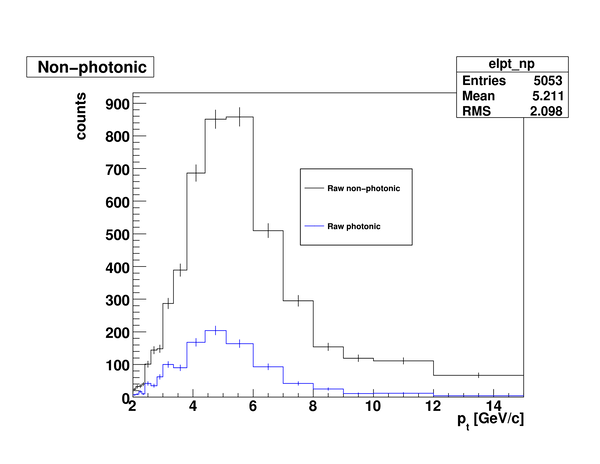
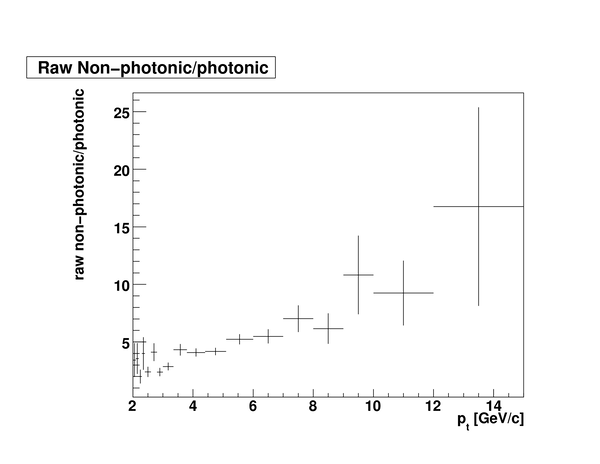
Just for kicks, I attempted to correct this for the efficiency of finding the photonic partner.
Take p = raw photonic
np = raw non-photonic
e = efficiency
then
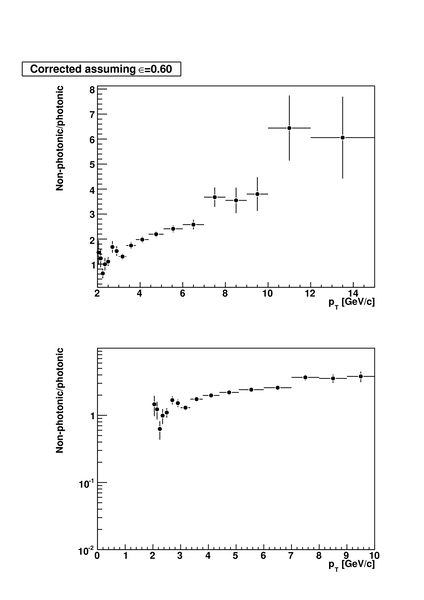
corrected non-photonic/photonic = np*e/p - (1-e)
Below I plot this, assuming epsilon=0.7, compared with the plot in Phenix's electron p+p paper, http://www.phenix.bnl.gov/phenix/WWW/info/figs/065/Fig2_logo.gif
Also plotted is the ratio assuming an efficiency of 0.6, which brings the result down a bit. Of course, this is very rough and will have to be done better, taking into account Dalitz, etc. separately with a real simulation, and also taking into account contamination, but one can see that we are in the right ballpark.
.png)



.png)

