- genevb's home page
- Posts
- 2025
- 2024
- 2023
- 2022
- September (1)
- 2021
- 2020
- 2019
- 2018
- 2017
- December (1)
- October (3)
- September (1)
- August (1)
- July (2)
- June (2)
- April (2)
- March (2)
- February (1)
- 2016
- November (2)
- September (1)
- August (2)
- July (1)
- June (2)
- May (2)
- April (1)
- March (5)
- February (2)
- January (1)
- 2015
- December (1)
- October (1)
- September (2)
- June (1)
- May (2)
- April (2)
- March (3)
- February (1)
- January (3)
- 2014
- 2013
- 2012
- 2011
- January (3)
- 2010
- February (4)
- 2009
- 2008
- 2005
- October (1)
- My blog
- Post new blog entry
- All blogs
TPC hits by padrow
Updated on Mon, 2009-05-11 10:55. Originally created by genevb on 2009-05-11 10:35.
(This entry is meant as additional input in a thread on Run 9 TPC studies/QA.)
Using the Offline QA TPC Sector histograms combined from 20 files of runs 10129049 and 10129050, I see the following distributions for each of the 24 sectors (PDF versions of these plots are available as attached files at the bottom of this page).
Notes:
- Sectors 13 & 20 show no qualitative differences from other sectors (which don't have any dead RDOs/FEEs/Anodes).
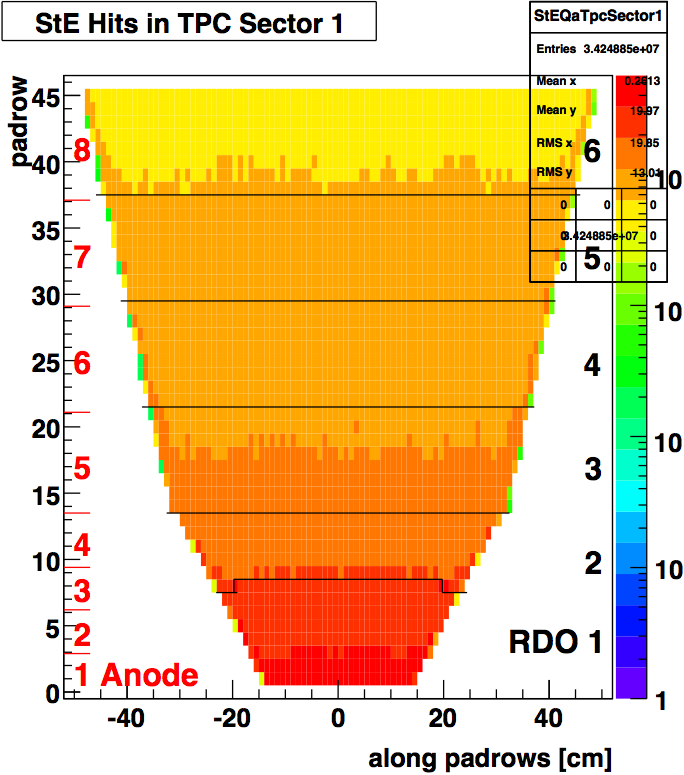
- Padrow 8 always see an excess of hits. This padrow is the only one which is covered by two RDOs, but I don't see why that matters.
To help in understanding the layout of RDOs and anode channels, I include here a 2D plot of the hits from Sector 1 (padrow vs. position along the padrow in [cm], not pad numbers) with lines to indicate boundaries of RDOs and anode channels. A PDF with all 24 sectors is attached at the bottom of this page. These plots make the following obvious:
- Anode outages:
11-8
12-4
18-4
20-5
- RDO outages:
4-1
5-5
6-5
11-1
- FEE outages:
2 (rows 16-17)
5 (row 3)
8 (rows 16-17, 36-37)
9 (row 7, 38-39)
19 (rows 44-45)
20 (a block on rows 39-45)
21 (rows 42-43, 44-45)
- There are a few dead pads and some warm FEEs.
These are noted in Offline QA shift reports.
-Gene
»
- genevb's blog
- Login or register to post comments