FileCatalog API
This blog will report on modifications made to the FileCatalog API on W13/08 and following weeks. It will serve as self-documentation.
- 2008/03/27 - 4 hours work time (API reshape, DB reshape)
- 2008/03/28 - 2 hours work time (adjustments, measurements)
- 2008/03/31 - 2 hours work (mainly documentation, additional implementation for later flexibilities)
- 2008/04/03 - 30 mnts work (documenting, statistics gathering)
- 2008/07/02 - 2 hours work (testing of brando as a reported additional server available here, initial results had to be repeated multiple times as problem were found)
- 2009/08/20 - No time really involved on my side (measurement of speed of ready to go test suite)
2008/03/27
General idea
The API was modified to take into account two features of MySQL server
- Query buffering before sending
- Query caching
Query buffering before sending
MySQL provides the option SQL_BUFFER_RESULT with the SELECT statement. As described in its help pages, the SQL_BUFFER_RESULT forces the result to be put into a temporary table. One of the side effects is that this actually helps MySQL free the table locks early and helps in cases where it takes a long time to send the result set to the client. Since the queries from user typically request a large result (entire dataset for a given production for example), each query was showed as locking tables for some time impacting the general perception of responsiveness over multiple user usage.
This parameter was tuned by hand to achieve a compromise: if the return result is small, there is a penalty to copy the results to a temporary table first before sending to the client. The threshold was empirically determine to be of the order of 10 rows for a typical server (db09).
Note: This would need better measurements.
Performance impact is showed in the table below.
Query cache
Query cache could be enabled at MySQL server side. MySQL documents two kind of cache at server level:
- DEMAND: in this mode, only SELECT statements accompanied of the SQL_CACHE indicator would be cached.
- ON: in this mode, MySQL caches all statements within
Since the FileCatalog heavily relies on dictionary tables, DEMAND for such queries seemed to be a first approach. In fact, no downside of DEMAND exists a-priori (at the limit where all SELECT use SQL_CACHE, this would equate to ON).
Use of dictionaries is a classic approach in which strings are transformed into integers for use in WHERE statements. In other words instead, of either a WHERE table1.fieldX = table2.fieldX AND table2.fieldX='MyString' or a table1.fieldX='MyString' one would do a table table1.fieldX=N where N is determine by table2.index WHERE table2.fieldX='MyString' in a separate query statement. More intuitive, users think they use strings while the implementation uses a faster integer (or mask) query.
In all cases, the FileCatalog makes significant use of dictionaries and all dictionary queries were cached as first approximation.
Slave response
User reported (have been reporting for a while actually) slow response of the FileCatalog API. The slave server heston was determine as the root cause of this as demonstrated in the below table.
Measurements
The below measurements were done / automated on March 28th 2008.
The test simply used a user typical query and repeated it over 5 times. This is a first pass test (statical fluctuation over 5 tries does not allow for conclusive interpretations in some instances as result differences are within standard deviation - will summarize).
| Slave | db09 | ||||||
| Trial # | 1 | 2 | 3 | 4 | 5 | Average | Std |
| no buffer + no cache | 227 | 175 | 176 | 174 | 172 | 184.80 | 21.14 |
| no buffer (cache) | 198 | 239 | 236 | 206 | 212 | 218.20 | 16.40 |
| SQL buffering + no-cache | 450 | 421 | 351 | 222 | 194 | 327.60 | 103.20 |
| SQL buffering (cache) | 207 | 178 | 172 | 172 | 173 | 180.40 | 13.48 |
| Slave | heston | ||||||
| Trial # | 1 | 2 | 3 | 4 | 5 | Average | Std |
| no buffer (cache) | 3820 | 3668 | 3242 | 3848 | 3336 | 3582.8 | 249.36 |
| SQL buffering (cache) | 3689 | 4330 | 3546 | 3747 | 3564 | 3775.2 | 287.46 |
| Master | robinson | ||||||
| Trial # | 1 | 2 | 3 | 4 | 5 | Average | Std |
| no buffer (cache) | 5 | 5 | 5 | 5 | 6 | 5.2 | 0.4 |
| SQL buffering (cache) | 5 | 5 | 6 | 5 | 5 | 5.2 | 0.4 |
Observations
Table results
- Observing the results from db09
- The tests are not conclusive so far as many values are close within statistical fluctuation.
- The buffering with no-cache test suffered from two high values raising the average to larger value than expected. This test is celarly biased.
- heston is consistently 20 times slower than db09
- robinson is 30 times faster than db09
- Enabling caching and buffering seemed to allow a master update while a full spidering was performed as well in parrallele.
- We attribute this to the use of a Union table (ENGINE=MERGE) while canonical operations may happen on indvidual tables instead (especially, updates and select).
- This could be done and implemented at API level as "some" querries are predeterministric. For example, storage may be known a-priori and while the storage=HPSS individual table is being updated, this will un-affect querries based on the table for storage=local (and vice-versa).
Additional comments and observations
- Measurements made on simple query get_file_list.pl -keys path,filename showed
- if un-cached would take 12 seconds to execute on db09
- if cached, further queries would take less than a second (measurement would show as 0)
- Following the MySQL blogs article on Query cache, we conclude
- Based the the definition: Query Cache efficiency = Qcache_hits/(Com_select+Qcache_hits)
- The results for db09 are (after a week-end of queries)
- Qcache_hits = 43000
- Qcache_inserts = 586
- Qcache_not_cached = 20000
- no qurries with errors were found
- Com_select = Qcache_inserts + Qcache_not_cached + querries with errors found = 20586
- Efficiency: 2%
- Efficinecy is currently low
- SQL_BUFFER_RESULT creates additional TMP tables - one way to avoid this to be a penalty impact is to force memoery resident TMP table creation. On March 31st 2008
- On db09, the ratio disk versus memory is 12 to 20 so a 37% imperfection.
- On robinson, this ration is 137 to 3431 so a 4% impact
- Avoiding using disk resident tmp table can be done by increasing tmp_table_size if created_disk_tables is large. This will further consume memory.
- At the time of this post, the cache miss rate was estimated as 27% and the key_reads were flagged as high. Using a key buffer size of 64 M was requested (instead 8M a bit low).
- The current miss rate is Key_reads = 2493 k versus Key_read_requests = 1128 M i.e. a 0.2% miss rate
- This adjustement seemed to be paying off but more moniroring and longer times are needed for this to be conclusive.
- See follow up [+]
Next adjustements
The tuning todo list
On robinson, we need to keep monitoring the ration Key_reads / Key_read_requests[>>]We need to look at this value on db09[>>]- We need to re-address poorr performance on heston - slaves base characteristics should match (otherwise, performance differences by order of magnitudes between slaves could confuse both users and problem-analysizer)
- db09 could benefit from a higher tmp_table_size value; this parameter needs to be checked over Master/Slace for consistency
- Cache and SQL querry buffering test need to be redone
- The cache efficiency needs to be tuned and increased
Path to further improvements
Can the query cache on the Master be improved?
Since spidering and indexer constantely hit the same querries, likely it could be improved BUT
- There is no point on caching statements which would lead to an update of the record - hence, only storage=HPSS records could be cached
- storage=NFS files are volatile (files move aorund, are deleted and frequently deleted even more so than on distributed disk where lifetime is expected to be of month length). Those should never be cached.
- A new method was introduced run_query_cache() for measurement and test pruposes. The method was enabled in the spiders and indexer on March 31st and the statistics reset at 20:00 (RESET QUERY CACHE). The method was used for all HPSS based queries in Spider and Indexers
- See result and conclusion here (basically, NO it does not)
- At this stage, we note that a crucial improvement is missing: clone_location() and insert_file_location() have not been made aware of the table split and do not take advantage of it.
Can we increase the cache by enabling caching of user querries?
The below graphs show the query usage statistics for SUMS whereas a total number of queries is divided by a total number of queries over some period of times.
Period of times = one week
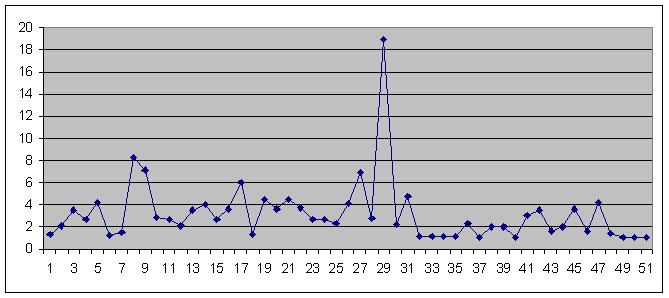
The average number of unique queries over a week is ~ 2.87 queries. Caching would be helpful 65% of the time. While extracting the results, we looked at the profile of the queries and realized that the result is dominated by emc=1 based queries requesting sub-ranges based on runNumber ranges.
Period of times = one month
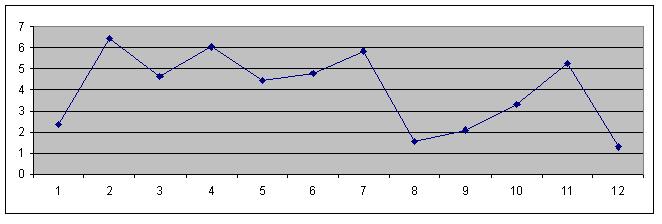
The average would move the average to ~ 4 (75% cache reuse). It is unclear of queries would remained cached for a month.
2008/04/03
Follow-ups on the tuning parameters
- In this blog, we noted the server's parameters adjustement to compensate for a high cache miss rate initial quoted as high as 27% (see here). The miss rate was estimated to be at 0.2% after a requested adjustements. The new calculated miss rate is
Key_read_requests = 2,183.55 M
Key_reads = 20 M
Leading to a cache miss-rate of Key_reads/Key_read_requests = 0.9%
- We noted the need to verify this value on db09, the working slave for the FileCatalog (since the parameter was adjusted everywhere)
On db09, the values are
Key_read_requests = 4,719.86 M
Key_reads = 7,620 k
The cache miss rate is therefore 0.2%
- We conclude that the adjustment was bneficial to both server and client. It is likely that --key-buffer=64M is high and could be decreased and retuned (32 M would already be x4 the initial too low value which leaded to a 24% miss rate).
Follow up on server's caching of more queries
- We noted in this blog that the server caching may be improved if we cache more querries but cautionned of volatile querries (files frequently moved such a the one on storage=NFS) and the size of the cache itself (is it able to hold more queries and especially, the spider querries). The conclusion of this trial could have been reached by observing the 'QCache%' parameters but unfortunately, the query cache was disabled without warning as the parameters below demonstrates:
- March 31st parameters:
query_cache_type DEMAND
query_cache_size 26255360 - April 3rd parameters:
query_cache_type ON
query_cache_szie 0
- March 31st parameters:
2008/07/02
Following the same tests made on 2008/03/27, brando was tested for performance. However, to ensure binary comparison, a new test result was taken from db09.
Base parameter check
Setup for brando:
| query cache size | 25,325,568 |
|---|---|
| query cache type | DEMAND |
Checks (caching would be enabled). The parameters in db09 have not changed either.
| query cache size | 25,325,568 |
|---|---|
| query cache type | DEMAND |
Both db are comparable caching wise.
Performance
| Slave | db09 | ||||||
| Trial # | 1 | 2 | 3 | 4 | 5 | Average | Std |
| no buffer (cache) | 140 | 139 | 139 | 140 | 140 | 139.6 | 0.55 |
| SQL buffering (cache) | 168 | 150 | 184 | 215 | 141 | 171.6 | 29.38 |
The results are comparable to previous ones although in this trial, disabling optimization (SQL_BUFFER) seems to lead to a tighter average. The one server scheme seem to absorb most of the load from all users but a secondary would still be an improvement.
| Slave | brando | ||||||
| Trial # | 1 | 2 | 3 | 4 | 5 | Average | Std |
| no buffer (cache) | 164 | 162 | 162 | 162 | 163 | 162.60 | 0.89 |
| SQL buffering (cache) | 163 | 162 | 163 | 162 | 162 | 162.40 | 0.55 |
Note: Initial numbers for the SQL buffering (cache) test were 1460, 752, 210, 162, 162 leading to an average of 549.20 with a standard deviation of 566.92. This deviation was so far off the expected results that a longer test of 50 cycles was run over a period of 2 hours during which, no jitter was found. A note seems in order however as there may be situations when the server is overloaded with other processes (in principle, dedicated).
2009/08/20
New infrastructure was put in place with tuned FS, caching, db server and so on. The work involved multiple people (Wayne testing IO and demonstrating best configuration, Dmitry tuning and testing diverse database configuration on test nodes, Matthew and Wayne configuring new "beefy" nodes matching required specs). The results of the performance are below (for reference, brando and db09 are also measured).
| Db | Average | Std |
| brando | 457.42 | 59.96 |
| db09 | 696.00 | 315.04 |
| fc1 (master) | 43.44 | 0.53 |
| fc2 | 51.44 | 14.5 |
| fc3 | 52.90 | 13.6 |
| Increased cache - limit where querries are cached | ||
|---|---|---|
| fc1 (master) | 1.62 | N/A |
| fc2 | 1.66 | N/A |
| fc3 | 0.76 | N/A |
- jeromel's blog
- Login or register to post comments