Energy in preshower-1 vs gamma candidate position
Updated on Tue, 2008-04-15 11:23. Originally created by jwebb on 2008-04-14 16:05.
Figure 1 -- Mean energy in preshower-1 deposited for gammas with fit position at U,V. Data (left) and Monte Carlo (right). MC resolution degraded to achieve reasonable occupancy. NOTE: the color-z scale is different between the two plots.
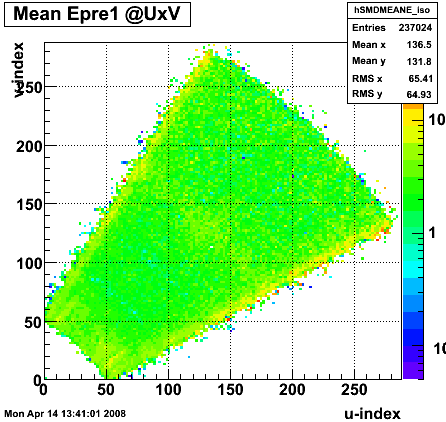
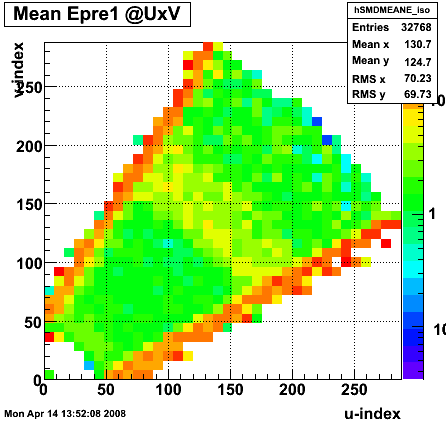
Gross features seen in the data are present in the MC. The ribs of the TPC support, the band near strip 180 (somewhat fainter in data, but probably because of occupancy).
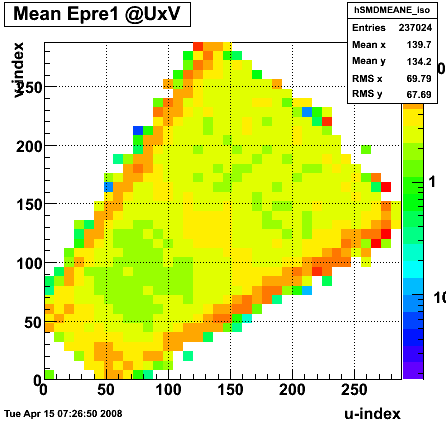
Figure 2 -- Degrade the data resolution to match the MC resolution...
Conclusions:
1. Not entirely clear at this point. The
»
- jwebb's blog
- Login or register to post comments