- jwebb's home page
- Posts
- 2019
- 2018
- 2017
- 2016
- 2015
- 2014
- 2013
- November (1)
- October (1)
- September (1)
- July (1)
- June (1)
- April (1)
- March (3)
- February (1)
- January (1)
- 2012
- 2011
- December (2)
- September (3)
- August (5)
- July (6)
- June (6)
- May (1)
- April (5)
- March (5)
- February (2)
- January (2)
- 2010
- December (3)
- October (3)
- September (2)
- August (2)
- June (2)
- May (4)
- April (4)
- March (2)
- February (4)
- January (10)
- 2009
- 2008
- 2007
- 2006
- July (1)
- My blog
- Post new blog entry
- All blogs
Optimization of cluter size for gamma ID in the endcap
Abstract: We compare four different cluster sizes (3x3, 2x2, 2x1 and Ahmed's high-tower/2x1 scheme) in the endcap. Monte Carlo simulation indicates that Ahmed's scheme provides the best discrimination between gammas and π0's, but introduces a ~7% loss of energy (and hence degraded resolution effects) into the measurement.
Monte Carlo Sample:
1. throw pT > 4 GeV, exponential pT distribution
-
single gammas
-
single pi0 decays
2. throw zvertex width of 30 cm
3. throw 0.05 < eta < 1.95
Clustering options:
Try four different clustering schemes:
1. 3x3 tower cluster (the "traditional" clustering algo") around a seed tower
2. 2x1 tower cluster
- includes the two towers whose centers are closest to the SMD point
3. 2x2 tower cluster
- includes the four towers whose centers are closest to the SMD point
4. Ahmed's scheme (or close to it)
- include the closest tower to the SMD point
- include the next closest, if the SMD point is further than 75% of the tower's
half-width in eta-phi space from the tower center.
n.b. The code (at present) uses the center of the towers in eta-phi space to determine distance. This, combined with the changing size in eta of the towers, introduces a bias which favors adding towers at smaller eta.
Figure 1 -- Effectiveness of isolation cuts for 2x1 clusters. Left panel: pT (candidate) divided by pT summed over R<0.3. Black histogram for generated gammas. Red histogram generated pi0 decays. Right panel: rejection versus efficiency curve.
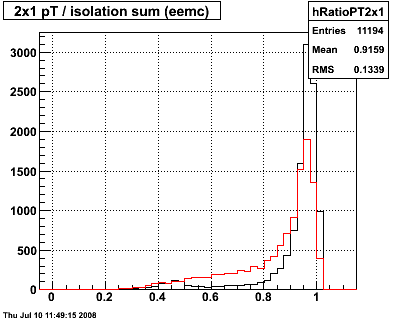
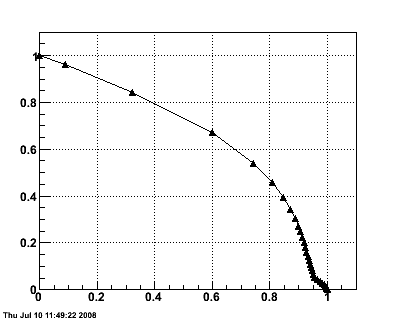
Figure 2 -- Effectiveness of isolation cuts for 2x2 clusters. Left panel: pT (candidate) divided by pT summed over R<0.3. Black histogram for generated gammas. Red histogram generated pi0 decays. Right panel: rejection versus efficiency curve.
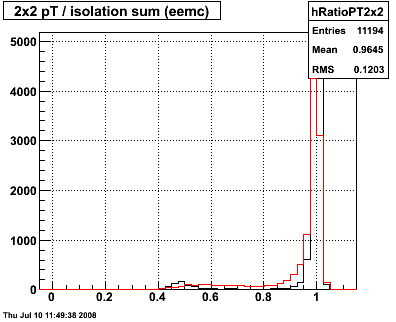
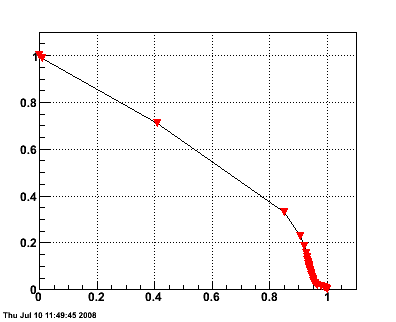
Figure 3 -- Effectiveness of isolation cuts for 3x3 clusters. Left panel: pT (candidate) divided by pT summed over R<0.3. Black histogram for generated gammas. Red histogram generated pi0 decays. Right panel: rejection versus efficiency curve.
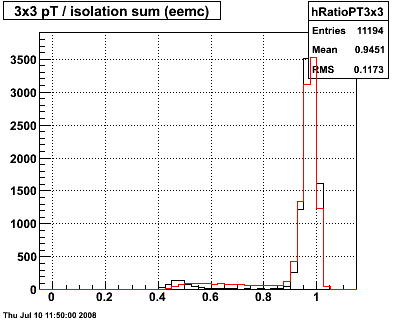
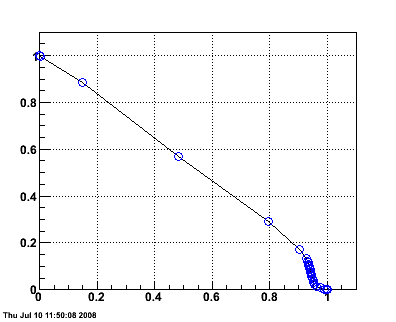
Figure 4 -- Effectiveness of isolation cuts for 2x1 clusters, using (something like) Ahmed's criteria for adding the second tower. Left panel: pT (candidate) divided by pT summed over R<0.3. Black histogram for generated gammas. Red histogram generated pi0 decays. Right panel: rejection versus efficiency curve.
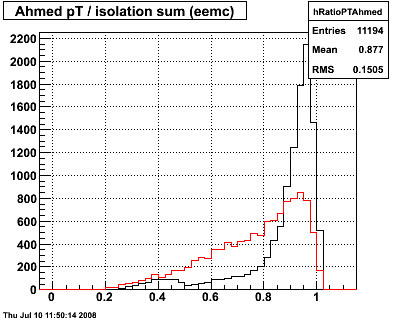
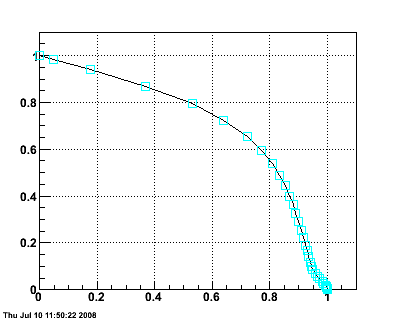
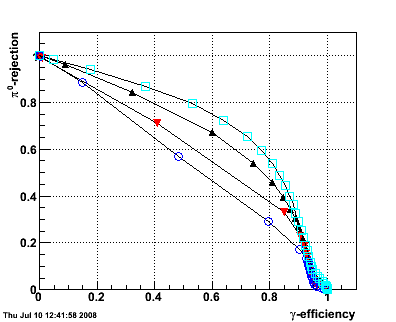
Figure 5 -- Rejection versus efficiency curves for the above clustering algorithms superimposed on each other.
Trade offs:
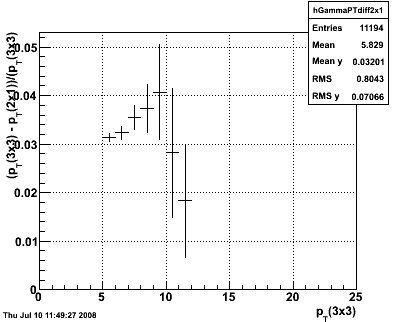
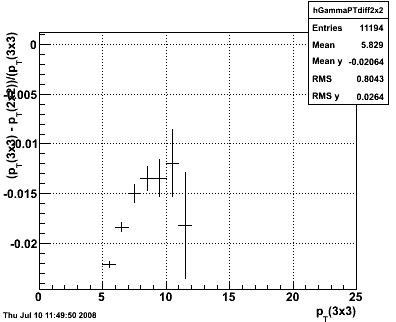
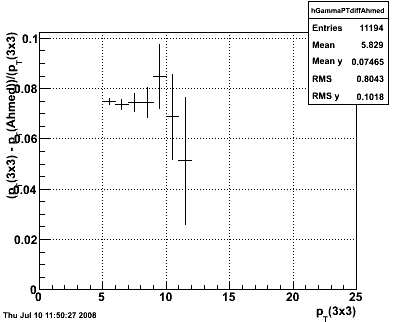
The trade off is in pT resolution. Below we plot the mean difference between the 3x3 cluster and the chosen cluster size, versus the pT of the 3x3 cluster. We take this as an estimate for the pT we fail to integrate in the cluster.
Figure 6 --
Conclusions:
1. The best "rejection-efficiency" plot for single gammas vs single pi0 decays is found when we use Ahmed's scheme. This is because we are more likely to count the 2nd photon as part of the isolation sum rather than the photon cluster energy.
2. There is a degradation of energy resolution using Ahmed's scheme which is ~7% of the energy of the photon. This should be something which we can address using the Monte Carlo.
3. The resolution issue can also be removed if we use Ahmed's clustering scheme for evaluating the isolation sum, then fall back on a more inclusive cluster definition (2x2 or 3x3) to measure the energy of the photon candidate.
4. Alternatively, the question of "what fraction of energy leaks out of a tower for a photon at a given position" should be easy enough to solve. (In fact, it's already incorporated in Weihong's pi0 analysis). So here, one could even a better rejection-efficiency curve if this information were taken into account.
07/15/2008
Next steps:
1. Investigate use of 1-tower clusters. Would need to correct for energy sharing across tower boundaries based on position.
2. Divide MC data into (eta < 1.5) and ( eta > 1.5) samples... smaller towers should have better rejection power.
Energy sharing model:
Toy MC which relies only on tower geometry and an assumed shower shape. Code is setup to easily change the shower shape, which will allow us to easily investigate what the salient features are.
1. Use EEMC geometry class to define tower boundaries
2. Throw "photons" on a grid 1.8x the physical size of the tower
3. Distribute energy as follows:
- 90% of energy flat distribution w/in R<2.5 cm of photon center
- 10% of energy flat distribution w/in R<3*2.5 cm of photon center
4. At each photon position
- sum total energy generated
- sum total energy w/in fiducial volume of tower
- and divide
Figure 1 -- Fraction of energy deposited in 12TC01 for a photon at a given position relative to the center of the tower. Axes are alligned radially outward (eta-hat) and tangential (phi-hat). The box indicates the nominal (eta,phi) boundaries of the tower.
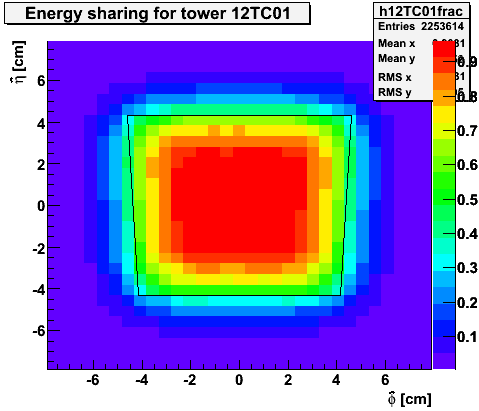
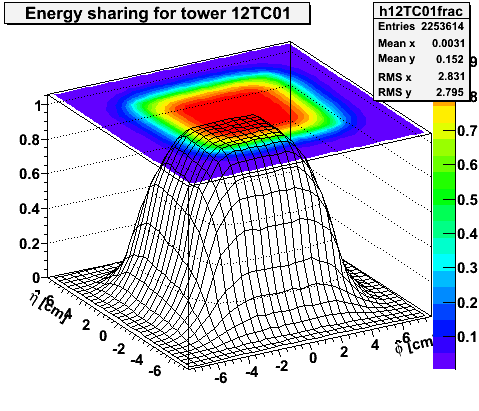
Figure 2 -- Fraction of energy deposited in 12TC12 for a photon at a given position relative to the center of the tower. Axes are alligned radially outward (eta-hat) and tangential (phi-hat). The box indicates the nominal (eta,phi) boundaries of the tower.
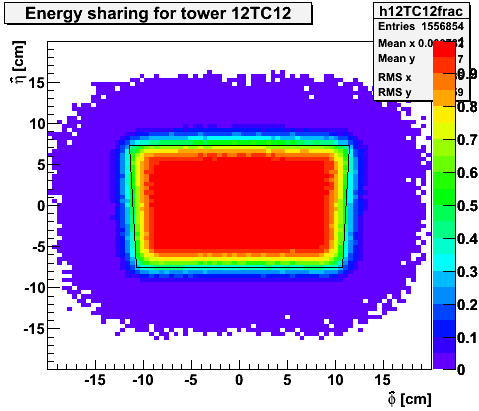
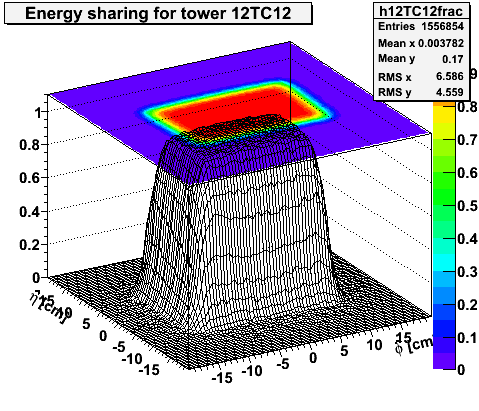
Figure 3 -- Comparison of tower size, energy sharing to the minimum opening angle (inner circle) and opening angle for zgg=0.95 (outer circle) for a pi0 decay with ET=6.0 GeV.
.png)
.png)
Figure 4 -- as above w/ ET=10 GeV
.png)
.png)
Groups:
- jwebb's blog
- Login or register to post comments