- jwebb's home page
- Posts
- 2019
- 2018
- 2017
- 2016
- 2015
- 2014
- 2013
- November (1)
- October (1)
- September (1)
- July (1)
- June (1)
- April (1)
- March (3)
- February (1)
- January (1)
- 2012
- 2011
- December (2)
- September (3)
- August (5)
- July (6)
- June (6)
- May (1)
- April (5)
- March (5)
- February (2)
- January (2)
- 2010
- December (3)
- October (3)
- September (2)
- August (2)
- June (2)
- May (4)
- April (4)
- March (2)
- February (4)
- January (10)
- 2009
- 2008
- 2007
- 2006
- July (1)
- My blog
- Post new blog entry
- All blogs
pT dependence of the isolation cut
Updated on Sun, 2008-07-27 14:26. Originally created by jwebb on 2008-07-26 16:18.
Figure 1 -- Isolation ratio for single-thrown Monte Carlo events (black single gammas, red single photons) with realistic pT and vertex distributions. The three figures correspond to gammas and pi0's with 5<pT<6 GeV, 6<pT<8 GeV and 8<pT<12 GeV. The fit s to a double gaussian w/ constrained mean plus a constant and is only there to give some estimate of the resolution of the photon energy.
![]()
![]()
![]()
Figure 2 -- Rejection vs efficiency curves derived from the above figures.


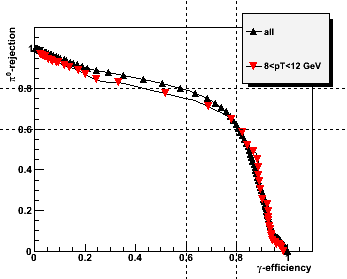
Observations:
The rejection power at a given efficiency does not degrade as fast vs pT as I would have expected. Next step is to feed this cut realistic (pythia) events and see what we get.
Figure 3 -- Isolation ratio for single-thrown Monte Carlo events (black single gammas, red single photons) with realistic pT and vertex distributions. The three figures correspond to gammas and pi0's which reconstruct within eta bins 1-4, 6-8, and 9-12 respectively.
![]()
![]()
![]()
Figure 4 -- Rejection vs efficiency for the above isolation ratios.
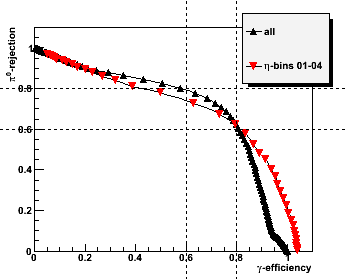
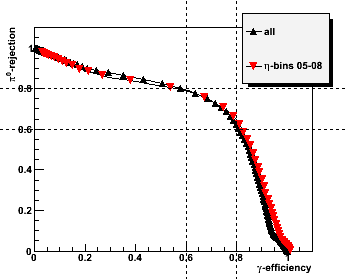
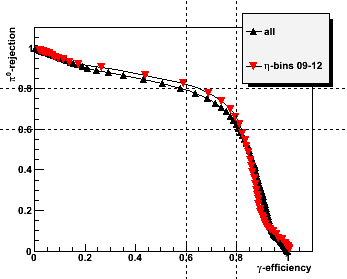
Observations...
Well... somewhat unexpected, but energy resolution at large eta leaves alot to be desired... eta bins 5-8 seem to be pretty good. Perhaps 2 tower clusters would work reasonablywell at large eta and would improve upon the energy sharing situation.
07/27/2008
Probably not surprising that we have problems at large eta. If we have issues w/ the leakage correction, this is where they should show up. Next try a different correction model.
»
- jwebb's blog
- Login or register to post comments