Abstract: We evaluate the rejection power vs efficiency of an isolation cut using a 1-tower cluster using pythia Monte Carlo. The energy of the 1-tower cluster is corrected for light leakage based on a simple toy model.
0.0 Data Sample and Candidate Selection
Data Sample:
- /star/institutions/iucf/pibero/sim/dijets
- /star/institutions/iucf/pibero/sim/gammajets
Events from different partonic pT bins are reweighted according to the generated cross sections...
const float luminosity = 3.164; // pb^-1
const float luminosity = 3.164;
const float weight_gammas_5_7 = luminosity * 0.0000494 * mb / (15 * 2000);
const float weight_gammas_7_9 = luminosity * 0.0000110 * mb / (15 * 2000);
const float weight_gammas_9_11 = luminosity * 0.00000314 * mb / (15 * 2000);
const float weight_gammas_11_15 = luminosity * 0.00000149 * mb / (15 * 2000);
const float weight_gammas_15_25 = luminosity * 0.000000317 * mb / (15 * 2000);
const float weight_gammas_25_35 = luminosity * 0.00000000990 * mb / (15 * 2000);
const float weight_dijets_5_7 = luminosity * 0.1360 * mb / (199 * 2000);
const float weight_dijets_7_9 = luminosity * 0.02305 * mb / (210 * 2000);
const float weight_dijets_9_11 = luminosity * 0.005494 * mb / (210 * 2000);
const float weight_dijets_11_15 = luminosity * 0.002228 * mb / (207 * 2000);
const float weight_dijets_15_25 = luminosity * 0.0003895 * mb / (199 * 2000);
const float weight_dijets_25_35 = luminosity * 0.00001016 * mb / (199 * 2000);
const float weight_dijets_35_45 = luminosity * 0.0000005299 * mb / (120 * 1000);
const float weight_dijets_45_55 = luminosity * 0.0000000283 * mb / (60 * 2000);
Candidate Selection:
- No trigger simulation/emulation
- Standard gamma candidate: 3x3 cluster with pT > 5 GeV
- Evaluate pT using 3x3 cluster energy
- Evaluate isolation using 1-tower with leakage correction
1.0 Isolation Cut in pT bins
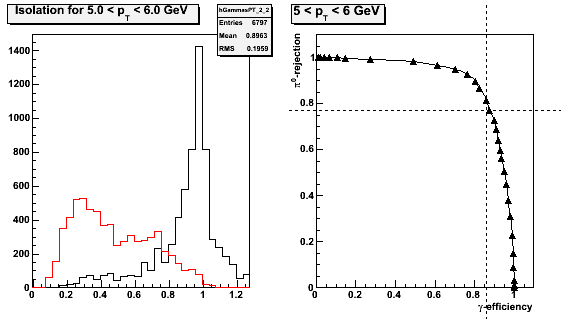
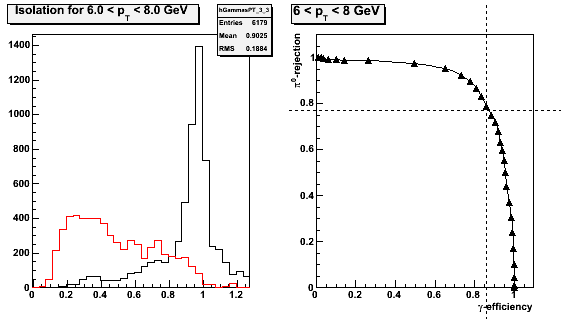
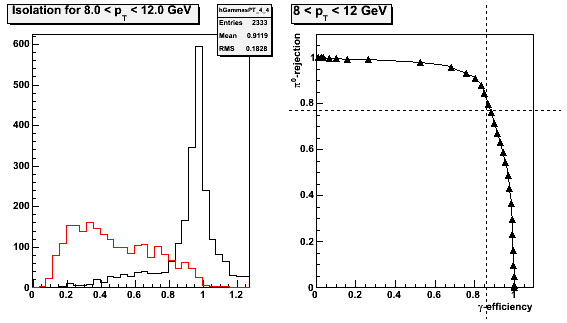
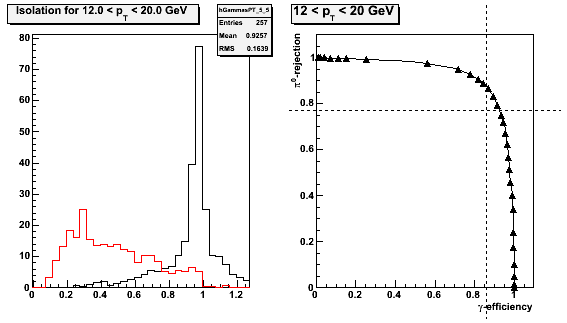
For clarity in the following plots, the jet background distributions are normalized to the same number of counts as the signal gammas.
Figure 1.1 -- Isolation energy ratio (left) and rejection-vs-efficiency (right) for gamma candidates with 5 < pT < 6 GeV. The isolation ratio is the corrected 1-tower ET divided by the ET summed over R < 0.3. The pT of the gamma candidate is the 3x3 cluster pT. The lines in the rejection-vs-efficiency plot indicate the rejection/efficiency of the UA2 cut discussed in the EEMC simulation document.
Figure 1.2 -- Isolation energy ratio (left) and rejection-vs-efficiency (right) for gamma candidates with 6 < pT < 8 GeV. The isolation ratio is the corrected 1-tower ET divided by the ET summed over R < 0.3. The pT of the gamma candidate is the 3x3 cluster pT. The lines in the rejection-vs-efficiency plot indicate the rejection/efficiency of the UA2 cut discussed in the EEMC simulation document.
Figure 1.3 -- Isolation energy ratio (left) and rejection-vs-efficiency (right) for gamma candidates with 8 < pT < 12 GeV. The isolation ratio is the corrected 1-tower ET divided by the ET summed over R < 0.3. The pT of the gamma candidate is the 3x3 cluster pT. The lines in the rejection-vs-efficiency plot indicate the rejection/efficiency of the UA2 cut discussed in the EEMC simulation document.
Figure 1.4 -- Isolation energy ratio (left) and rejection-vs-efficiency (right) for gamma candidates with 12 < pT < 20 GeV. The isolation ratio is the corrected 1-tower ET divided by the ET summed over R < 0.3. The pT of the gamma candidate is the 3x3 cluster pT. The lines in the rejection-vs-efficiency plot indicate the rejection/efficiency of the UA2 cut discussed in the EEMC simulation document.
2.0 Isolation Cut in eta bins
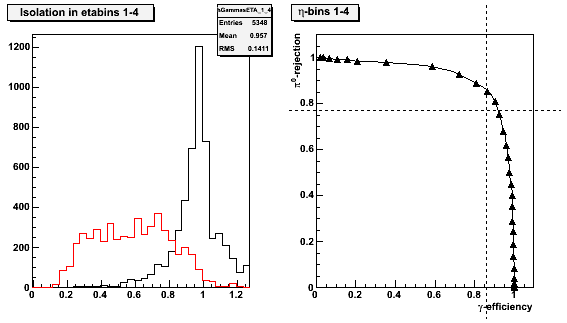
For clarity in the following plots, the jet background distributions are normalized to the same number of counts as the signal gammas.
Figure 2.1 -- Isolation energy ratio (left) and rejection-vs-efficiency (right) for gamma candidates located in eta bins 1-4. The isolation ratio is the corrected 1-tower ET divided by the ET summed over R < 0.3. The pT of the gamma candidate is the 3x3 cluster pT. The lines in the rejection-vs-efficiency plot indicate the rejection/efficiency of the UA2 cut discussed in the EEMC simulation document.
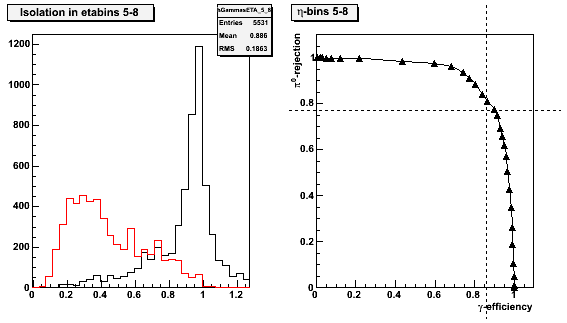
Figure 2.2 -- Isolation energy ratio (left) and rejection-vs-efficiency (right) for gamma candidates located in eta bins 5-8. The isolation ratio is the corrected 1-tower ET divided by the ET summed over R < 0.3. The pT of the gamma candidate is the 3x3 cluster pT. The lines in the rejection-vs-efficiency plot indicate the rejection/efficiency of the UA2 cut discussed in the EEMC simulation document.
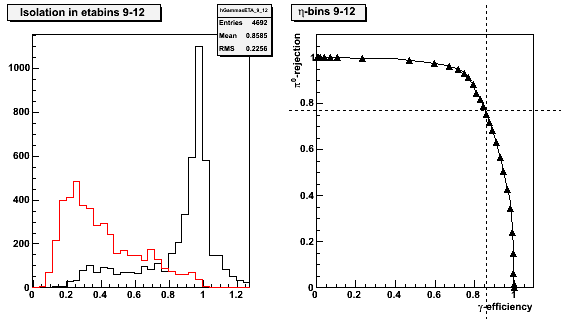
Figure 2.3 -- Isolation energy ratio (left) and rejection-vs-efficiency (right) for gamma candidates located in eta bins 9-12. The isolation ratio is the corrected 1-tower ET divided by the ET summed over R < 0.3. The pT of the gamma candidate is the 3x3 cluster pT. The lines in the rejection-vs-efficiency plot indicate the rejection/efficiency of the UA2 cut discussed in the EEMC simulation document.
3.0 Conclusions
We have demonstrated that an isolation cut based on a single tower cluster with a correction for shower-leakage into the neighboring towers is capable of achieving the rejection power and photon efficiency discussed in the EEMC proposal. Further study is required to verify that the Monte Carlo provides a reasonable description of the isolation distribution, the shower-sharing observed by the towers, etc.