SMD Sector Edge Effects
Updated on Sun, 2008-06-08 15:15. Originally created by jwebb on 2008-06-08 15:15.
Abstract: We examine edge effects in the SMD at sector boundaries.
0.0 Data Sample and Cuts
Cuts:
1. Isolation cone: R = 0.30
2. Isolation cut: ET > 0.90 × ETcone
3. CPV cut: Epre1cone == 0
4. Analysis cut: Epre2cone > 0
1.0 Comparison of SMD Strip Multiplicity for Candidates Near Sector Boundary and Center
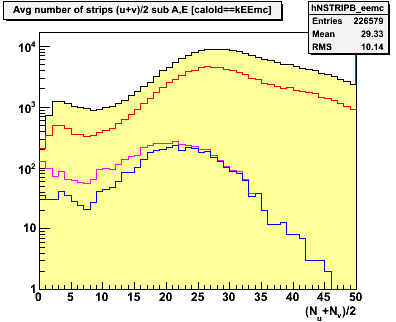
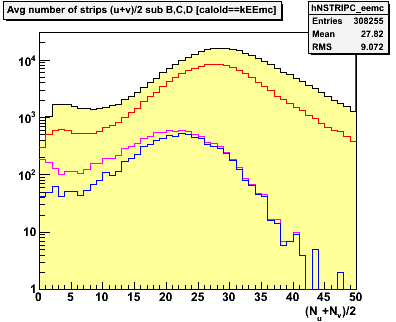
Figure 1 -- Number of strips (average between SMD planes) for the 3 cuts listed above. Left shows distribution for boundary candidates -- gamma candidates w/ seed towers in subsectors A and E. Right shows distribution for central candidates -- gamma candidates in subsectors B-D.


Observations:
1. Backgrounds show a large difference. More candiates with larger numbers of strips firing on average. Likely due to larger acceptance.
2. Events which pass the charged particle veto have qualitatively similar distributions. But a couple of differences exist, as shown in next figure.
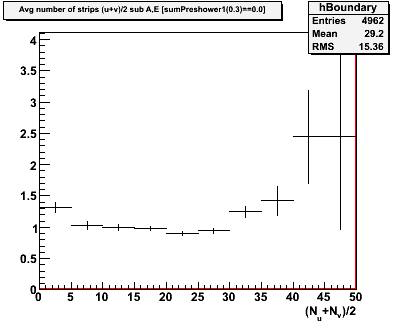
Figure 2 -- Number of boundary candidates passing the CPV cut divided by number of central candidates passing the boundary cut. Distributions are normalized before dividing.

Observations:
1. Near sector edges, an excess number of gamma candidates show up with both low and high number of SMD strips firing beneath them.
2. Candidates with large number of SMD strips... we're more likely to see signal in additional SMD strips, since they will (on average) be longer for candidates near a sector boundary.
3. Candidates which show up with smaller numbers of SMD strips can be explained by gammas starting to cross the sector boundary, and deposit a significant amount of energy within a neighboring SMD plane.
Hadronic backgrounds tend to manifest themselves similarly to gamma candidates crossing sector boundaries: lower energy deposited in fewer SMD strips. Will this impact the extraction of the gamma yields accounting for hadronic backgrounds?
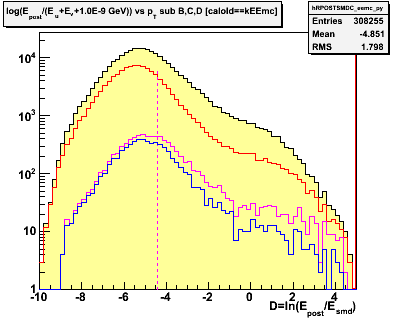
2.0 Comparison of D Distributions for Candidates Near Sector Boundary and Center
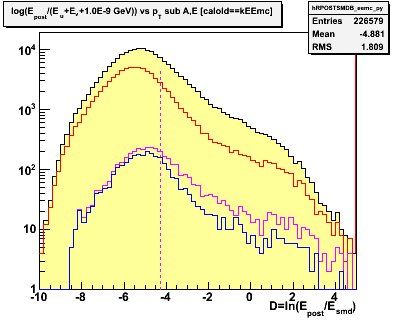
Figure 3 -- D Distributions for boundary (left) and central candidates (right).


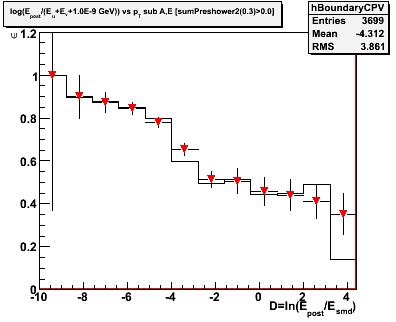
Figure 4 -- Solid histogram: conversion rate for gamma candidates in boundary subsectors. Red points: conversion rate for gamma candidates in the three central subsectors.

Observations:
1. Conversion rates seem to be unaffected whether the gamma candidate is near a boundary or not.
3.0 Conclusions
While there is an effect on SMD distributions near sector boundaries, it does not appear to be an issue for discriminating against the hadronic background.
»
- jwebb's blog
- Login or register to post comments
