EEmc Gammas via conversion method, determine/cross check efficiencies
Updated on Sat, 2008-03-29 18:05. Originally created by jwebb on 2008-03-29 17:10.


Abstract: In order to use the conversion method, we need to know the efficiencies with which single photons and the different sources of background candidates pass the analyzing cut. So far we have identified two sources of backgrounds: (1) photonic backgrounds arising from the decay of mesons, e.g. pi0 --> gamma gamma, and (2) neutral hadrons (or charged hadrons which pass the CPV) which hadronize w/in the calorimeter stack. We should be able to estimate the efficiencies for both of these directly from the data with good precision. The only parameter in his method which relies on the Monte Carlo is the probability for a single photon to convert in the 1st radiator of the EEmc.
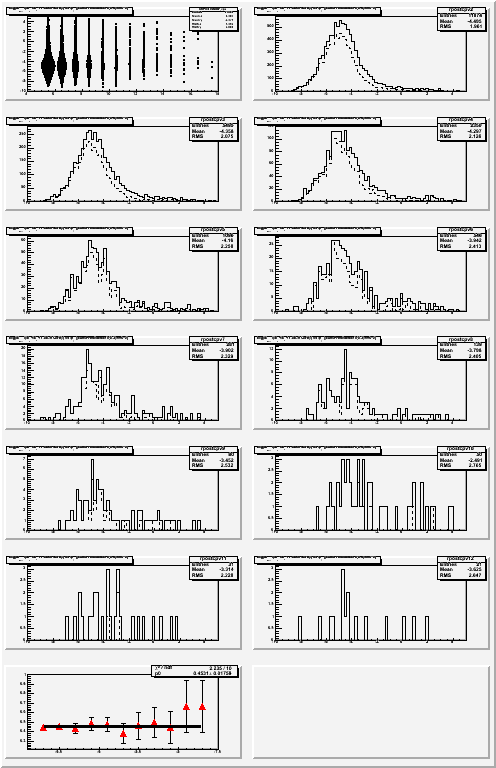
Figure 1 -- Upper left: D=log(Epost/Esmd) vs pT. Other panels, the number of events which satisfy the CPV cut (solid) and analyzing cut (dashed) vs D. Last panel: ratio of number passing analyzing cut to number passing the CPV cut, i.e. the efficiency of the analyzing cut, plotted vs pT.

Observation:
The fit to the efficiency vs. pT plot (last panel) is consistent with a constant. The hadronic background has an efficiency
εhadronic = 0.453 +/- 0.018
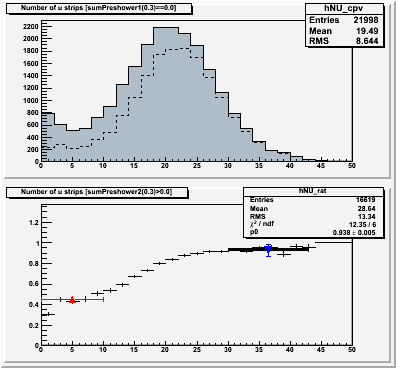
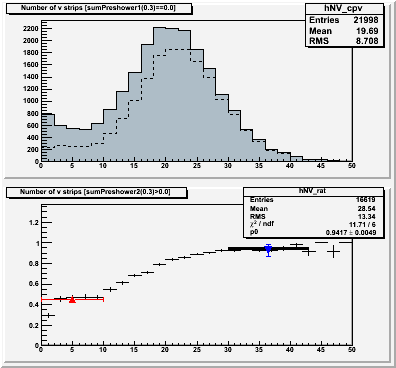
Figure 2 -- N-strip distributions for smd-u (left) and smd-v (right) planes. Solid histogram shows the number of events passing the CPV cut. Dashed curve the number of events passing the analyzing cut. Bottom panel shows the ratio (analyzing / CPV). The fit is over the range 30 <= N strips <= 43. The blue data point shows the efficiency for identified pi0's which satisfy all cuts to pass the analyzing cut. The red data point compares the efficiency of the hadronic-like events to the efficiency measured at low numbers of strips.


Observations:
1. The efficiency for pi0 decays is consistent with the efficiency for events with large numebrs of strips firing. This region is expected to be dominated by pion decays. Therefore we use the efficiency extracted in this region as a better estimate of the pi0 conversion efficiency.
2. The hadronic efficiency is consistent w/ the conversion rate seen for N strips <= 10. We strongly suspect this region is contaminated by neutral and/or charged hadrons.
We take the efficiency for photonic backgrounds to be
εphotonic = 0.940 +/- 0.007
This is just the average of the two results, with an increase in the uncertainty equal to their difference.
»
- jwebb's blog
- Login or register to post comments
