- jwebb's home page
- Posts
- 2019
- 2018
- 2017
- 2016
- 2015
- 2014
- 2013
- November (1)
- October (1)
- September (1)
- July (1)
- June (1)
- April (1)
- March (3)
- February (1)
- January (1)
- 2012
- 2011
- December (2)
- September (3)
- August (5)
- July (6)
- June (6)
- May (1)
- April (5)
- March (5)
- February (2)
- January (2)
- 2010
- December (3)
- October (3)
- September (2)
- August (2)
- June (2)
- May (4)
- April (4)
- March (2)
- February (4)
- January (10)
- 2009
- 2008
- 2007
- 2006
- July (1)
- My blog
- Post new blog entry
- All blogs
Background conversion probability using identified pi0 sample
Updated on Wed, 2008-05-14 09:55. Originally created by jwebb on 2008-05-07 14:29.
.png)
Abstract: Using identified p0 decays we measure the conversion probability for the jet background in the photon sample which passes the CPV cut.
0.0 Data sample and Cuts
Data sample:
XXX runs from ppLong2 (no QA cuts)
Select EEmc L2gamma triggers
π0 finding:
{
  mEEclusters->setSmdSeedEnergy( 3.0, 0.0 ); // seed and slope [MeV]
  mEEclusters->setSmdMaximumSize(4);
  mEEclusters->setSmdMinimumStrips(5);
  mEEclusters->setSeedEnergy(2.0);
  mEEclusters->setMinimumEnergy(0.5);

  mEEpoints=new StMyPointMaker("mEEpoints",mEEanalysis,mEEclusters);
  mEEpoints->setSplit();
  mEEpoints->setSplitMinimumET(6.5);
}
Cuts:
0) Reconstruct a π0 candidate
1) Isolation cut -- ET(π0) / ET(0.3) > 0.9
n.b. isolation cut does not include BEMC towers
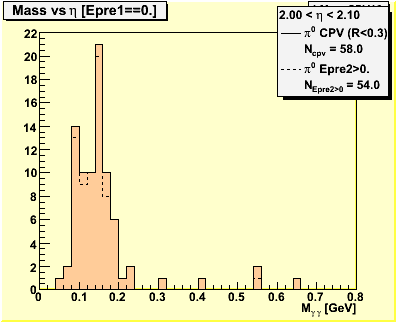
2) CPV cut -- E(pre1) == 0 w/in R<0.3
3) Analyzer -- E(pre2) > 0 w/in R<0.3
1.0 Method
π0 candidates are reconstructed with the π0 finder. We apply the same set of gamma candidate selection cuts to the π0 sample. Events which survive the CPV cut are binned in psuedorapidity. We count the number of events reconstructed with 0.1 < M < 0.2 which satisfied the CPV cut and the analyzer.
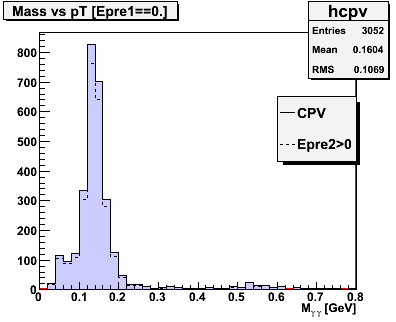
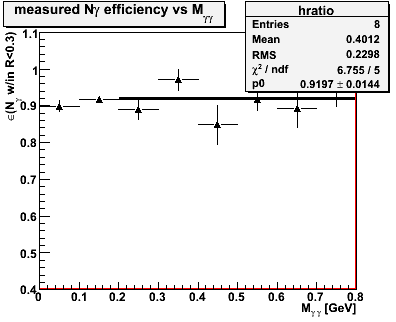
Figure 0 -- Invariant mass spectrum for all events which satisfy the CPV and analyzing cuts (left). Conversion probability w/in R<0.3 versus digamma invariant mass (right).
Obserrvations:
1) The background efficiency w/in the pi0 mass region (0.1 to 0.2 GeV) is about 91.5%, averaged over all eta, pt, etc...
2) We see a consistent efficiency versus invariant mass.
3) The eta mass region (0.5 to 0.6 GeV) is consistent w/ the pi0 mass region.
4) The yield above the pi0 mass (and not in the eta region) is given by combinatoric backgrounds from correlated photons from the jet, and uncorrelated random backgrounds.
I take this as a confirmation that this is an appropriate surrograte for measuring the jet background in the gamma sample.
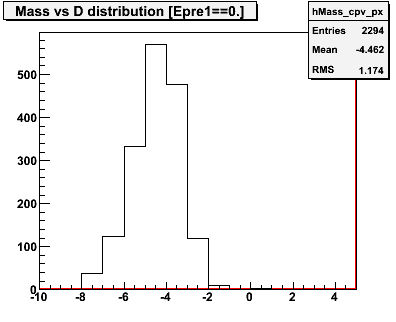
Figure 1 -- Conversion probability for background events with an identified π0 , plotted versus pseudorapidity. The fit is described below. The red(ish) lines indicate conversion probabilities for 1,2,3 and 4 gammas versus pseudorapidity. At right we show the "D" distribution for the events used to measure the efficiency. These events show no significant contamination from neutral hadrons.
The fit in the above figure uses Scott's observation that background conversion probability should be related to the single gamma conversion probability by the expression
(1.0 - εbg) = (1.0 - εγ)N where "N" is the number of detectable gammas within the isolation cone. The single photon conversion rate is calculated based on the known
amount of material in the first radiator and the incident angle, i.e. 1.0 - εγ = e-0.6873 / cos(θ).
2.0 Observations and Conclusions
- The shape of the measured background conversion rate is consistent with the shape expected given the amount of material in first radiator of the EEMC and a photon multiplicity of 3.35 w/in a jet cone of R<0.3 around the reconstructed π0 candidate.
- It may be possible to perform a 2-parameter fit, simultaneously fitting εγ and "N" from the π0 conversions. However, a quick-n-dirty attempt to do this resulted in rather large uncertainties in both the single photon efficiency and the number of gammas w/in the isolation cone. The two parameters were highly correlated w/in the fit. This probably requires better statistics to dig out.
- If I play around a bit with step sizes, initial conditions and parameter boundaries, I can convince Minuit to deliver something in line with my expectations for a 2-parameter fit. Specifically N=3.42+/-0.5 and MFP=0.68+/-0.04. The chi2/dof remains at 21/11. However, to get this result I need to constrain the MFP to be w/in +/- 2% of its nominal value (reasonable, since this is the integration tolerance for the 1st radiator). But I also need to constrain the number of photons to be between 3 and 4. If I don't do this, the uncertainties get rather large.
- I've reduced the SMD seed threshold to 2.0 MeV, and am rerunning the pi0 finder this evening, to try to get more statistics.
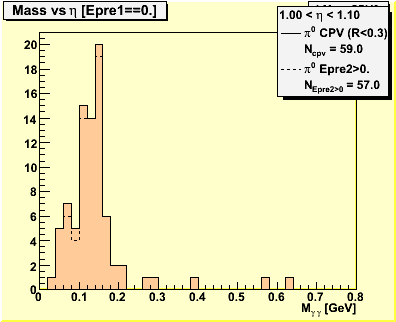
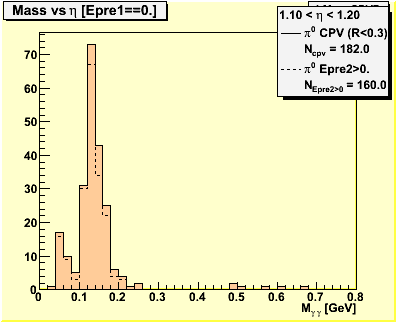
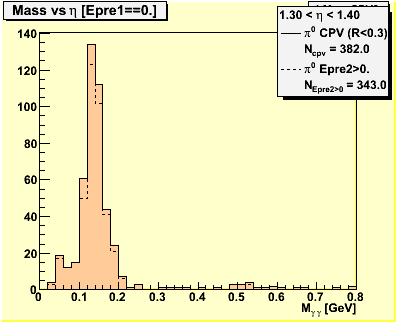
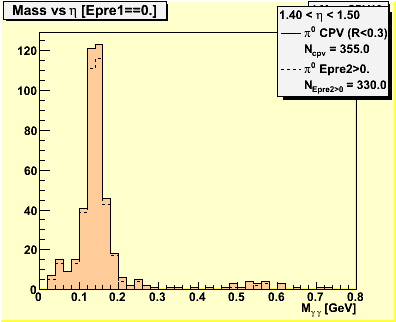
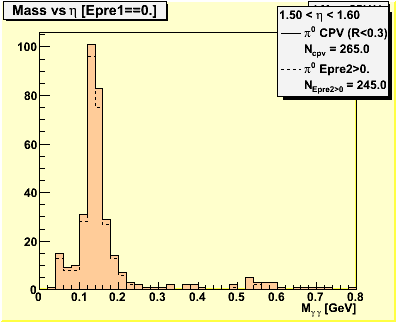
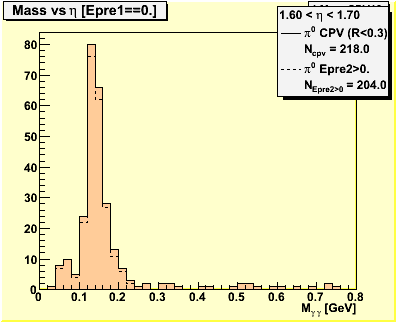
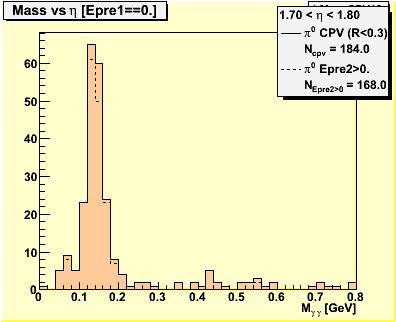
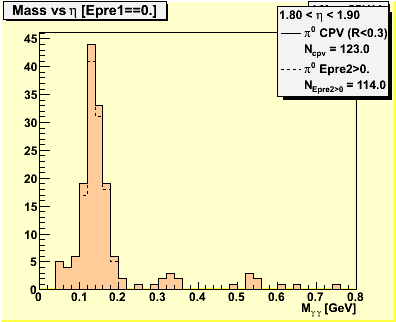
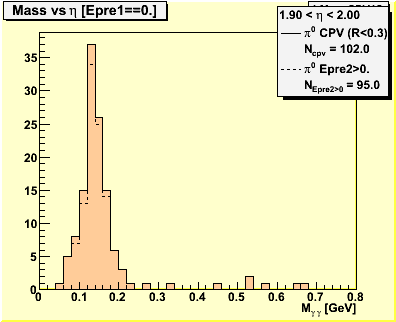
3.0 Mass Spectra
Figure 2 -- Invariant mass spectra used to obtain figure 1.


»
- jwebb's blog
- Login or register to post comments