- leun's home page
- Posts
- 2013
- 2012
- December (2)
- October (3)
- September (2)
- August (1)
- July (4)
- June (4)
- May (2)
- April (3)
- March (5)
- February (5)
- January (5)
- 2011
- December (3)
- November (3)
- September (5)
- August (2)
- July (2)
- June (3)
- May (4)
- April (4)
- March (2)
- February (4)
- January (2)
- 2010
- December (2)
- November (3)
- October (3)
- September (5)
- August (6)
- July (2)
- June (4)
- May (3)
- April (4)
- March (4)
- February (2)
- January (4)
- 2009
- 2008
- October (1)
- My blog
- Post new blog entry
- All blogs
DSM check 2
The purpose of the analysis is to compare various DSM inputs to the corresponding values constructed from Qtdata according to my best understanding of Eleanor's trigger document.
For the following plots, I am comparing L0dsm inputs to the Qtdata bit by bit. I take the Qtdata for the trigger crossing, and scan through available pre and post for the dsm data. The crossing with the highest number of matching bits is selected. The selection of crossing can change from event to event, and can depend on which Qt32 the data is coming from.
Previous analysis with older runs are found here.
The following is a quick look at the data taken on Wednesday, 4/22/09.
run10112099 (First 5 segments)
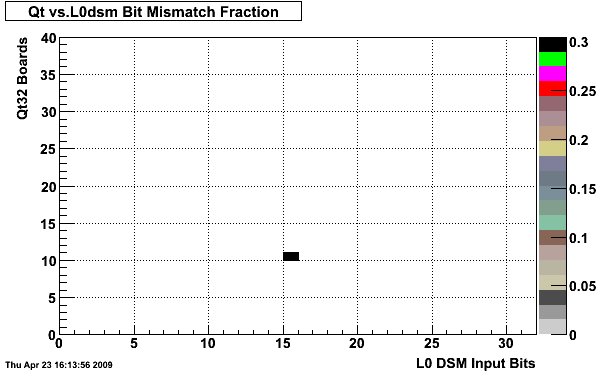
Bit-wise comparison between Qtdata and L0dsm input. LSB is always on the left. 0 means perfect match. 1.0 means perfect mismatch. -0.1 means no event. Bit 0~19 are for 4 qt8 card sums, (5 bits each) and the rest of the 12 bits are for HT(7 bits) and HT id(5bits).
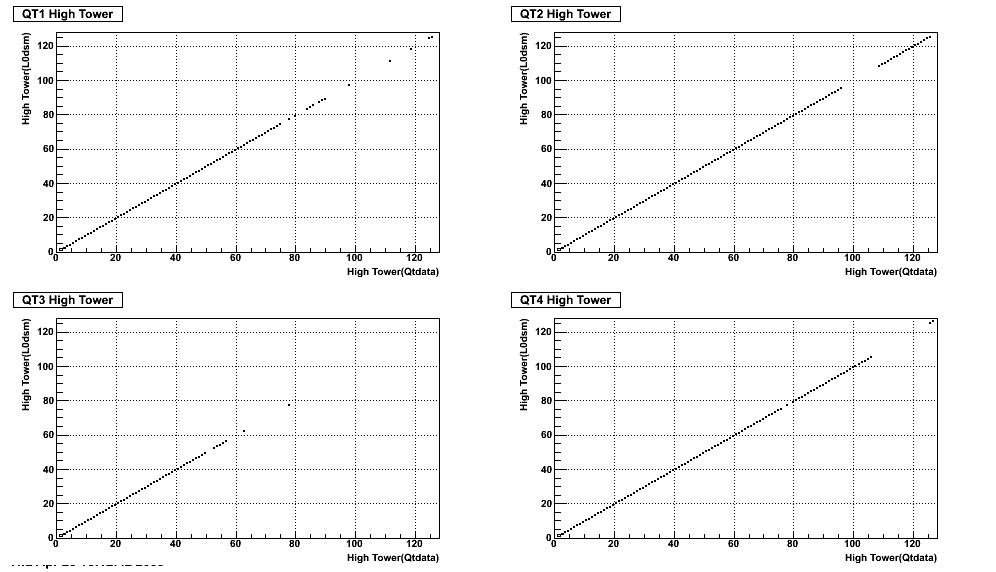
High Tower comparison per Qt crate
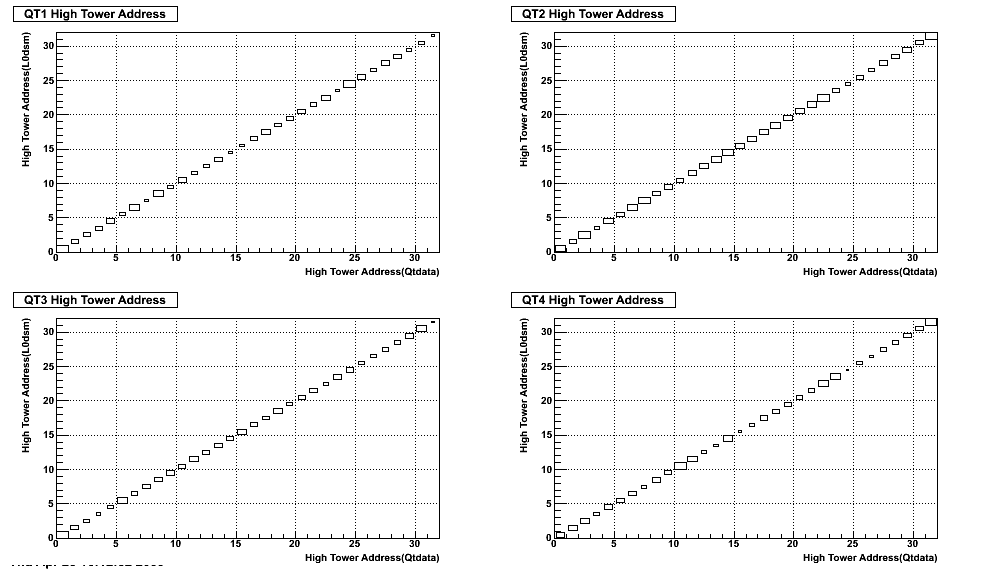
High Tower Address comparison per Qt crate
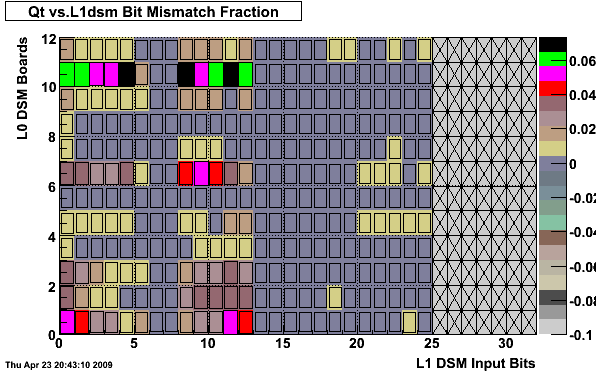
Bit-wise comparison between Qtdata and L1dsm input. This is not L0dsm emulation. We create clusters strait from Qtdata according to Eleanor's document, and compare attiributes like adc sum and HT address to those of the L1 DSM input. LSB is on the left. 0 means perfect match. 1.0 means perfect mismatch. -0.1 means no event.
The following plots use Qtdata clusters made out of qt8sums that were truncated to emulate the data packaging from Qt to L0dsm. The low 5 bits of qt8sums are suppressed, and then anything greater than 31 gets set to 31. Also, changes were made to the small cell clustering according to the updated information from Eleanor's email. Board H probably needs to be changed as well, but this has not been implemented yet.
Cluster Sum comparison per L0 DSM board. The events where L0sum>0 and qtsum=0 seems to come from those cells that should be ignored at L0 for clustering, but are currently not.

For comparison, if I don't truncate the qt8 sums, then I get the following correlation.
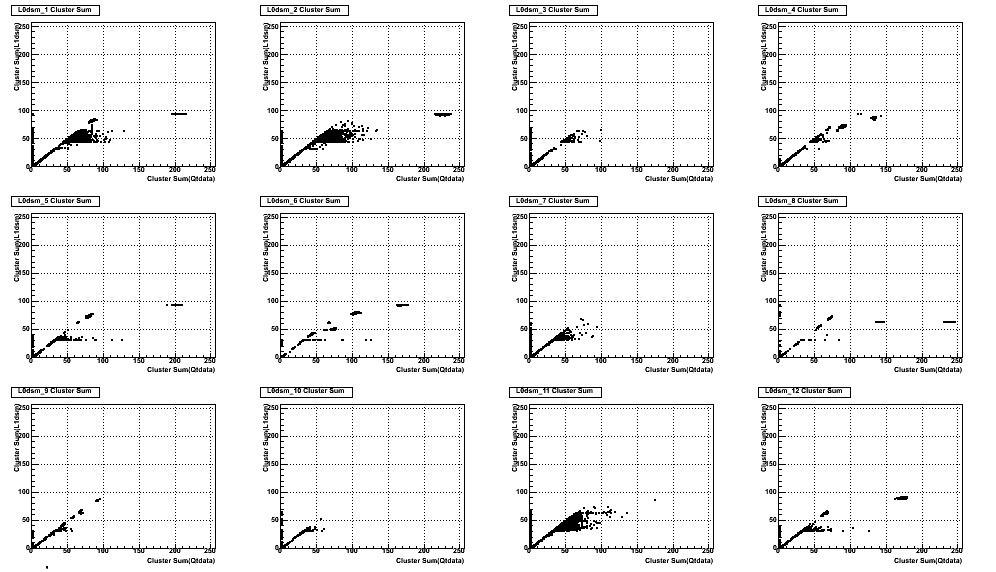
Distributions of the un-truncated qt cluster sums(black) and the L1 internal cluster sums(red) per module. Both cluster sums now include the 4th card sum added in L1 for boundary clusters.
.gif)
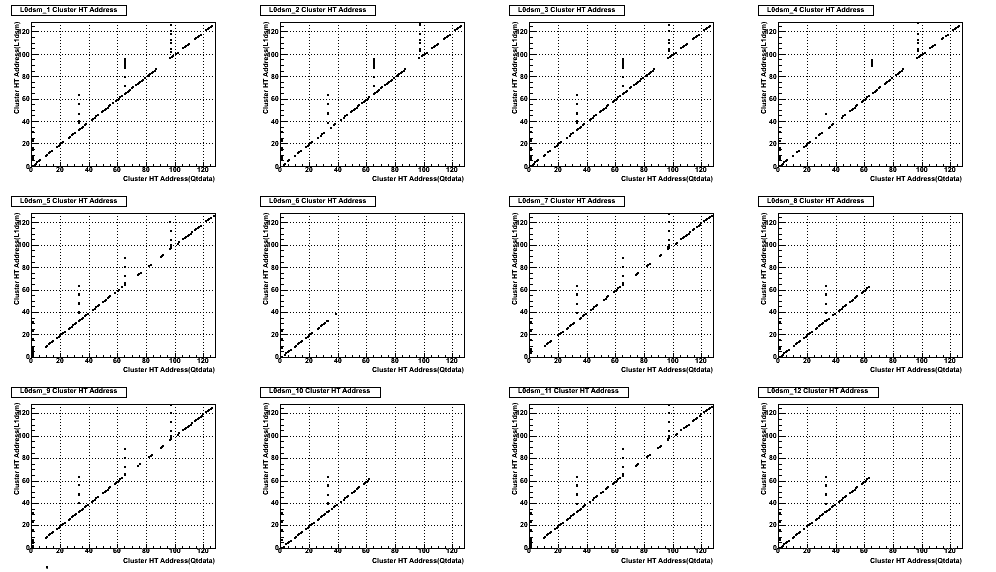
Extended HT address for clusters, per L0 DSM board. The vertical line segments come from the same events described earlier, where qtsum is zero and qt8 channel is (consequently) a multiple of 32, while L0 thinks that there is a valid HT and some cluster sum.
- leun's blog
- Login or register to post comments
