- leun's home page
- Posts
- 2013
- 2012
- December (2)
- October (3)
- September (2)
- August (1)
- July (4)
- June (4)
- May (2)
- April (3)
- March (5)
- February (5)
- January (5)
- 2011
- December (3)
- November (3)
- September (5)
- August (2)
- July (2)
- June (3)
- May (4)
- April (4)
- March (2)
- February (4)
- January (2)
- 2010
- December (2)
- November (3)
- October (3)
- September (5)
- August (6)
- July (2)
- June (4)
- May (3)
- April (4)
- March (4)
- February (2)
- January (4)
- 2009
- 2008
- October (1)
- My blog
- Post new blog entry
- All blogs
run10124075
Run 10124075 (5/4)
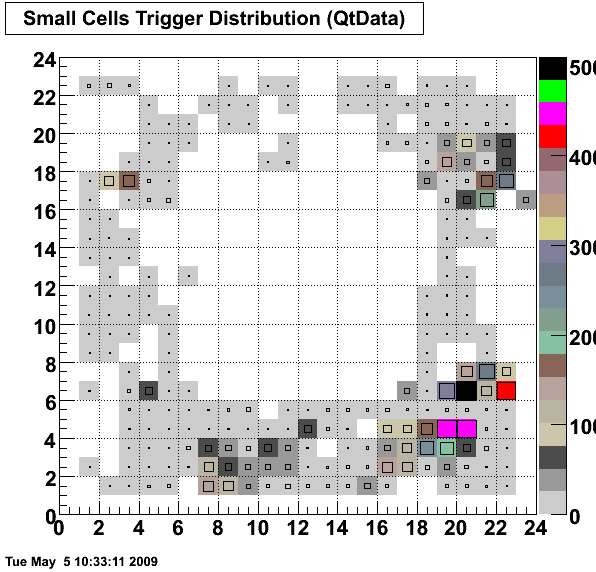
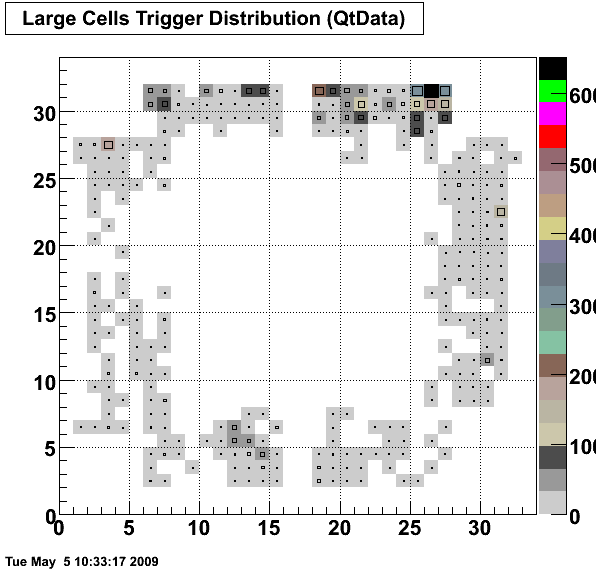
I'm looking at the first 35,000 events from this run, which had the configuration "production2009_200Gev_Hi / Physics"
The clusters are generated from Qtdata. These clusters differ from the "appended/internal" L1 DSM input clusters in two aspects. 1. Qt8 sums are NOT truncated. 2. The perimeter high towers are ignored according to Eleanor's table.
Total of 40 clusters, one for each Qt32 board, are compared to the threshold.
LED suppression is done by looking at the number of channels with ADC>10, and cutting at 800.

For the following plots, left is South, and up is Down.

Compared to Sunday's run, the south side has been cooled down. Overall it's more evenly distributed, and now it seems that the North Top area is the most active.
There are couple of mapping issues (asymmetry between top and bottom) that we haven't verified, and those are showing up here as perimeter high towers. (r12 c6, r16 c23)

Cluster sum distribution. (after low 5 bit suppression)

Trigger multiplicity
.gif)
- leun's blog
- Login or register to post comments
