Hadronization/Underlying Event Systematic for 2005+2006 jet aLL Part II
In Part I of this blog I discussed the porting of the Hadronization and Underlying Event stand-alone pythia code, originally written by Mike Miller, to RCF and the various tests used to determine that the output of the current code matches both that of the original code and current STAR CVS version of the jetfinder. In the process of this verification several unresolved issues arose concerning the dependence of the systematic on the deltaR cut and the range of the fit. This blog aims to address the reasons behind these dependencies and how they affect what I ultimately propose for the final systematic.
Figure 1.
The 2005 Systematic was estimated by applying a dR < 0.2 cut between the Particle and associated Blojet. When this dR cut was applied to the 2006 cuts (R=0.7 and eta -0.7<eta<0.9) the fits changed substantially, especially for the gluon jets. The reason for this is that the dR distribution changed - became broader for R=0.7 compared to R=0.4 jets. Figure 1 shows the dR of the most closest associated blojet for both R=0.7 and R=0.4 jets with 2005 and 2006 cuts applied.
Comparing the red and black points (R=0.7/0.4 w 2005 cuts) for all subprocesses (upper left panel) you will see the increase in radius increased the dR distribution. Therefore the dR<0.2 cut applied to the red points cut out much more data than when applied to the black points. This effect is only enhanced for the gg sample (lower right panel). This effect depends on the choice of cone radius and not difference in kinematic cuts between 2005 and 2006.
My hypothesis (which I will discuss more below) is that these effects are caused by the split/merge feature in the jet algorithm. It may be more likely for a R=0.7 BLOjet to be split into two lower pT jets at the particle level. Once this split occurs the dR spectrum will reflect this by broadening. This broadening wouldn't occur as often for R=0.4 jets because the jets are more likely to split at the BLOjet level. This split then propagates to the particle jet level as well and the dR association is tighter. Another possible explanation is that the R=0.7 cone radius is more efficient in reconstructing gluon jets than the R=0.4 (verified in Figures 6-9). Since gluon jets are characterized by higher multiplicities and lower <z> than quark jets it is also possible they are more likely to be split at the particle level. So an enhanced gluon subprocess could enhance the splitting effect for cone R=0.7 jets.

Figure 2:
I decided to look again at the fits of the associated Particle and BLOjets as a function of dR cut. Instead of plotting Particle pT vs associated BLOjet pT, I plot deltapT=BLO-Particle Jet pT vs Particle pT in Figure 2. I did this to show more clearly that what looked to be a linear correlation is actually only linear at high pT. The previous fits ranged from pT=10-40 and were dominated by the smaller error bars at low pT. These plots make clear that the previous fit method must be discarded. Figure 2 contains R=0.4, 0.2<eta <0.8 jets with a dR <0.2 cut applied.
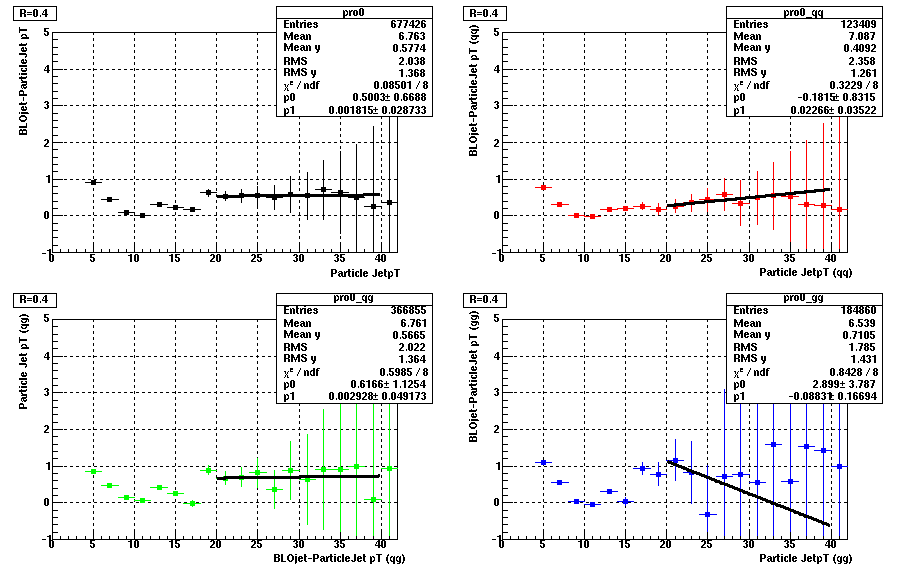
Figure 3:
Figure 3 is the same as Figure 2 but without a dR cut applied. Instead the most closely associated BLOjet was used. Looking only at the upper left panel it is clear that there are differences between Figure 2 and 3 at low and high pT. These differences are consistent with differences due to split/merge effects. When the dR cut is lifted those lower pT particle jets that result from the splitting of a BLOjet at the particle jet level are not removed by the dR cut and therefore BLOjet-Particle Jet is pulled negative. Cut out these low pT jets with a dR cut and the deltapT goes back up (Figure 2). Where is this effect strongest? You guessed it boys and girls. In the gg distribution.
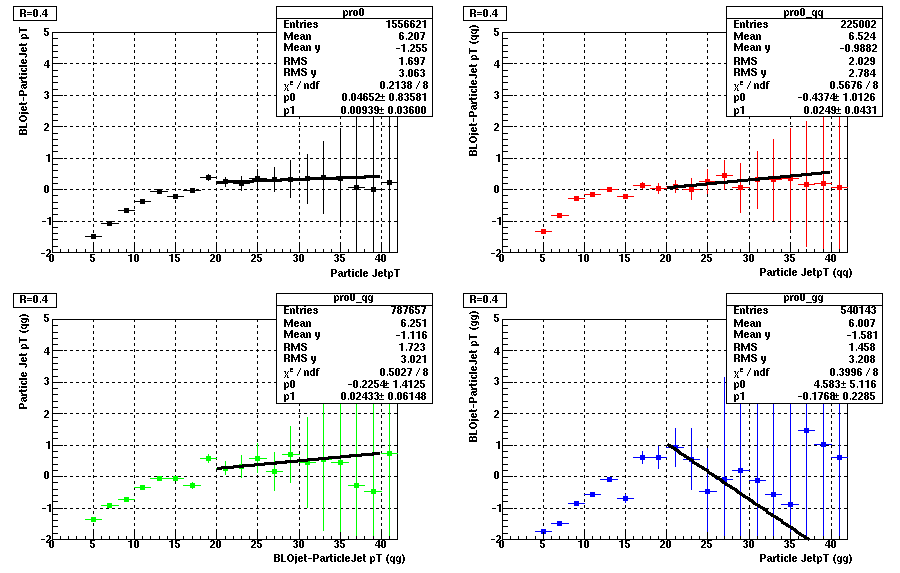
Figure 4:
If my theory is correct then this effect should be larger for R=0.7 than R=0.4. Figure 4 shows plot R=0.7, with 2006 eta cuts and associated dR < 0.4 applied. Already the lower pT distribution is pulled down due to the larger dR cut. A dR cut <0.2 leads to a distribution that looks very similar to Figure 2 at low pT.
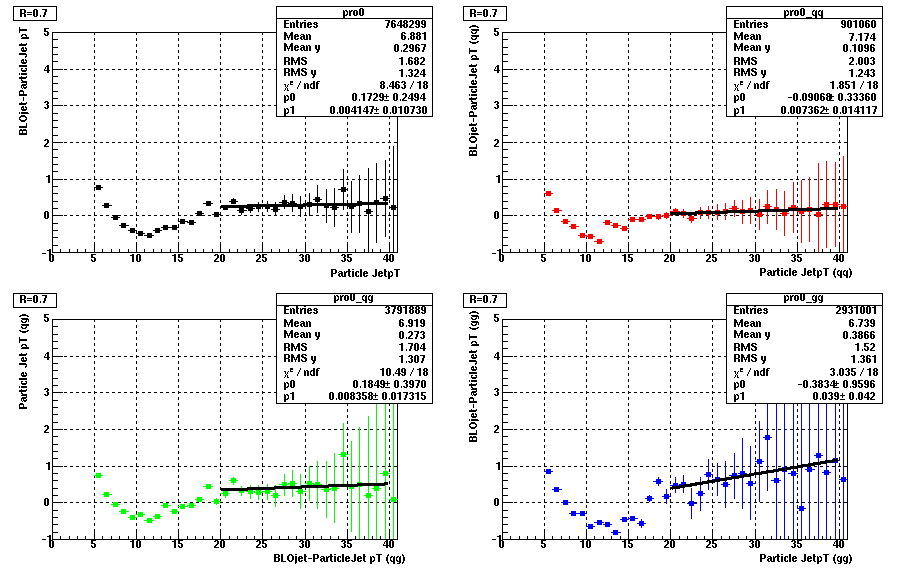
Figure 5:
Figure 5 includes BLO and Particle jets with cone R=0.7, 2006 cuts and no dR cut. This lowering of the average association at low pT is about the same in magnitude as for the R=0.4 jets but it extends to higher pT ( deltapT==0 at 18/12 in R=0.7/0.4 plots). It is not clear to me if this effect is due to an increased jet splitting at the particle level for R=0.7 cone jets or a simple increase in pT due to an increase in cone radius.

MIDPOINT CONCLUSIONS:
1) Strong dR dependence is consistent with split/merge effects
2) old linear fit method must be discarded
PROPOSAL:
1) Correct back to BLOjet level with UE turned off
2) Remove all dR cut and work only with inclusive spectrums
3) Isolate UE effect by comparing BLOjets with UE turned on and off
4) Isolate OCC effect by comparing BLOjets and PARTICLE jets with UE turned on
5) Combine UE and OCC effect to provide final correct/systematic
6) Let subprocess dependence decide if this systematic should be a correction or an associated error
Figure 6:
Comparison of BLO jets with UE turned off (top row) and turned on (middle row) for all subprocesses (columns). Each spectrum is fit with a sum of 4 exponentials - with the goal being to provide a smooth parameterization, rather than to characterize the shape of the distribution. The bottom row shows two distributions. The open squares represent the ratio of the UEoff/UEon Blojets. This varies smoothly from 0.5(0.3)-1.0 at low to high pT for qq(gg) jets. When UE is turned on we should expect two things to happen to the inclusive jet spectrum. The first is that on average the jet pT spectrum gets a horizontal shift. Jets which used to have 10 GeV now have 10.5 GeV (with 0.5 coming from the UE contribution). This effect should result in the ratio begin flat in pT with an absolute value < 1. What we see is a spectrum which varies with pT. I propose this is due to a second effect -- the increased splitting of jets when UE is turned on. UE not only increases the average pT of a jet it also creates new jets! These new jets would just be the same jets as in the BLOjet UEoff sample but they would be split, increasing the yield of UEon jets at low pT. And sticking with our theory, gluon jets are more susceptible to this effect and therefore show more of a supression at low pT.
The second distribution, filled squares, represent the pT you need to shift the yield of the BLOjet UEon bin in order to match the yield of the BLOjet UEoff spectrum. As an example, the yield at pT=11 in the middle left panel (UEon) is 2x10⁻³. The pT in the top left panel (UEoff) which corresponds to a yield of 2x10⁻³ is ~10 GeV. Therefore UEoff-UEon pT is ~-1 GeV and should be plotted at UEon pT =11 GeV. Looking at the bottom left plot you see -1.5 is plotted at UEon pT=11 GeV. So as expected, the UEon spectrum is shifted to the right of the UEoff spectrum. Again this shift has two components. The constant shift due to the UE contribution and the non-uniform pT shift due to split/merge effects. This effect is subprocess dependent, with larger non-uniformities occurring for gg jets.

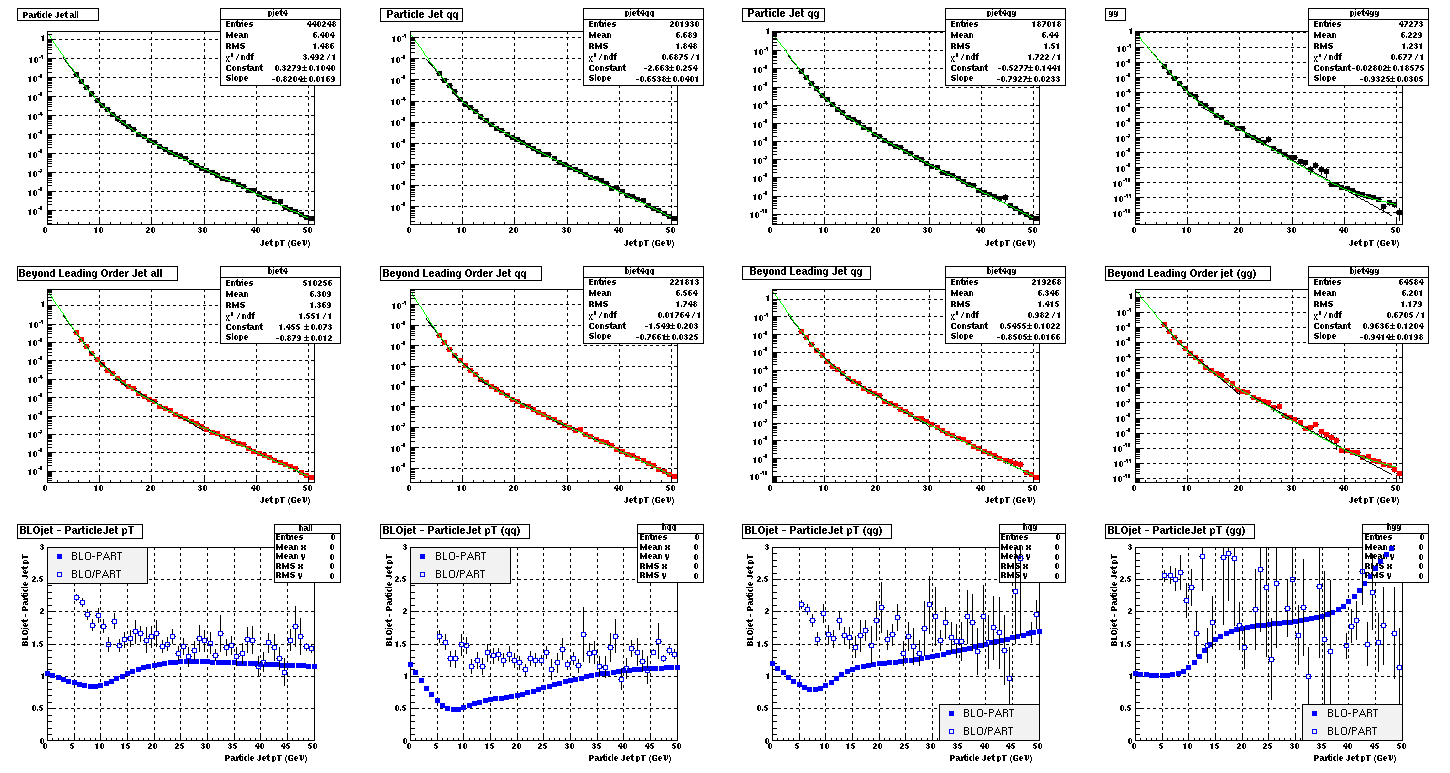
Figure 7:
Comparison of Particle and BLOjets with UE turned on for both. At the bottom you see the BLO/PARTICLE jet ratio > 1.0. This is expected since the particle jet will lose energy due to out of cone fragmentation. This ratio is 1.1 for quark jets and 1.4 for gluon jets. The shift spectrum says you need to shift the particle jet yields up to match the BLOjet yields. This is a shift in the opposite direction from the UE shown in Figure 5 and again is largest for gluons.
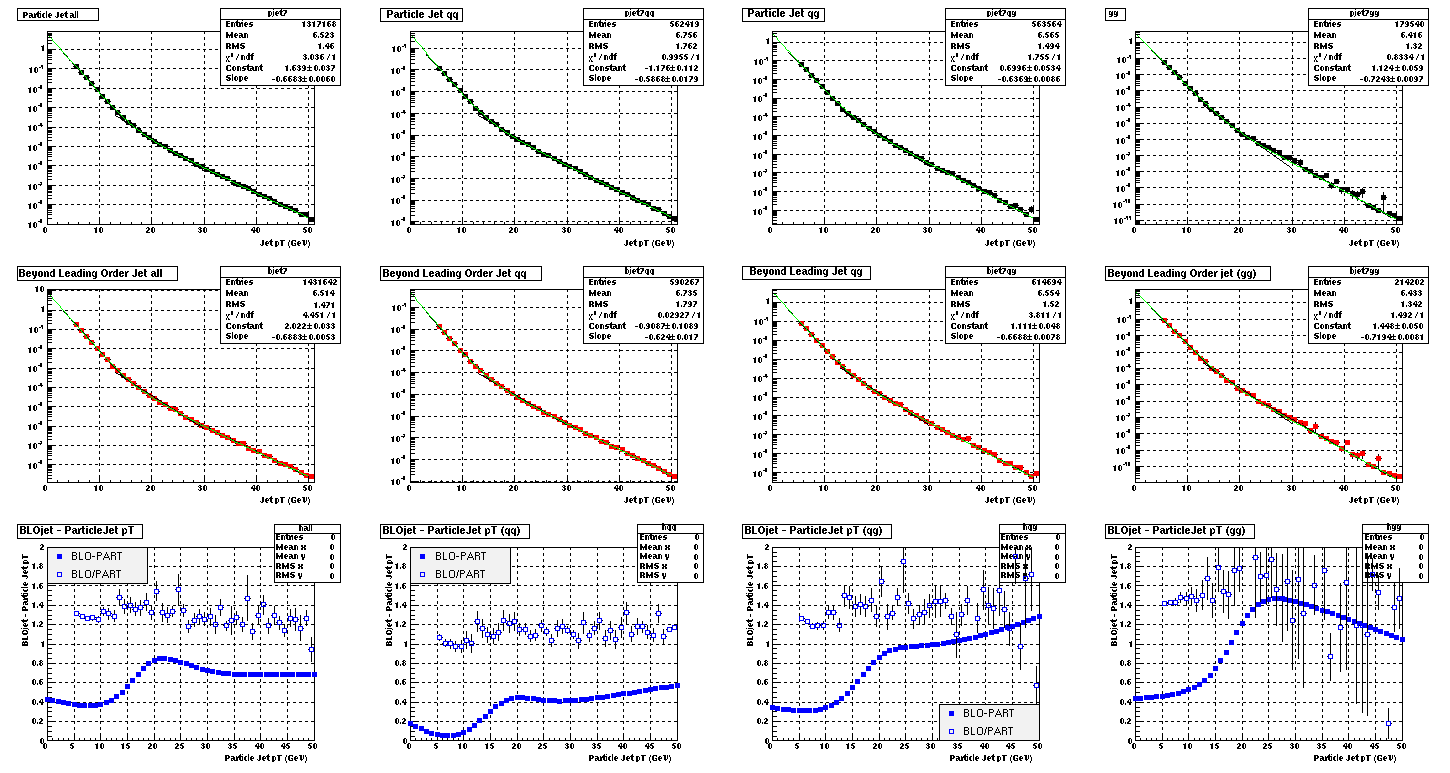
Figure 8:
This is the same as Figure 6 but with R=0.4 cone radius and 2005 cuts. The pT Shift effect is reduced at low pT and much more uniform in general, although still larger for gluons.
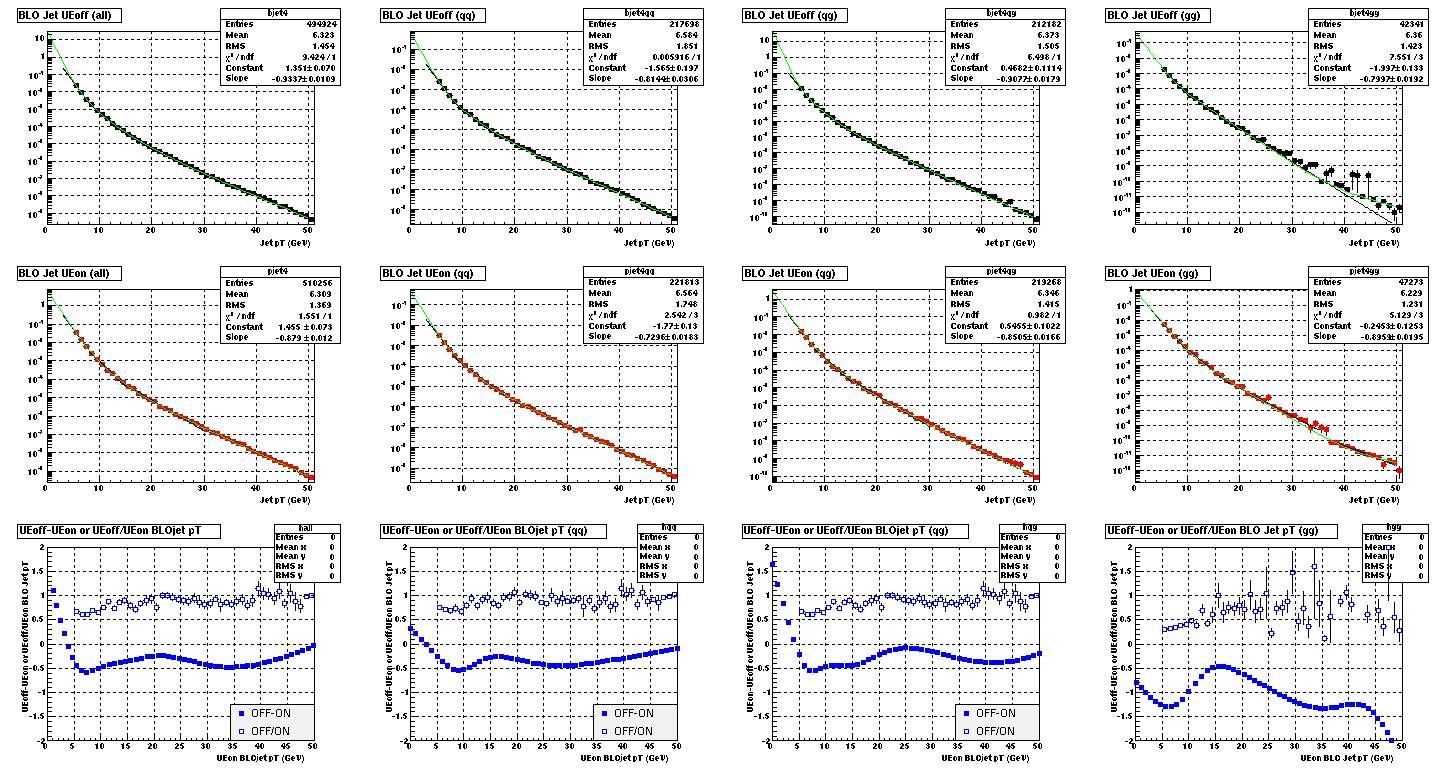
Figure 9:
Same as Figure 7 but for cone R=0.4 and 2005 cuts instead. As expected the out of cone effects increase for R=0.4 compared to 0.7, with the ratio of BLO/Particle increasing from 1.1 to 1.4 for quark jets and from 1.4 to ~2.0 for gluon jets.
CONCLUSION:
1) Due to subprocess dependence I propose we apply a systematic and not a correction.
2) I propose this systematic is pT and cone dependent and roughly follows the tables below (with #s I read of the plots):
| pT | UE | HAD | TOT |
| 5 | -1.0 | 0.4 | -0.6 |
| 10 | -1.6 | 0.4 | -1.2 |
| 20 | -0.75 | 0.8 | -0.05 |
| 30 | -0.6 | 0.75 | 0.15 |
| 40 | -0.5 | 0.7 | 0.20 |
| pT | UE | HAD | TOT |
| 5 | -0.5 | 0.9 | 0.4 |
| 10 | -0.5 | 0.8 | 0.3 |
| 20 | -0.25 | 1.2 | 0.95 |
| 30 | -0.5 | 1.25 | 0.75 |
| 40 | -0.5 | 1.2 | 0.7 |
- rfatemi's blog
- Login or register to post comments