Efficiency for the 1S,2S,3S Upsilon states - Pibero's data set
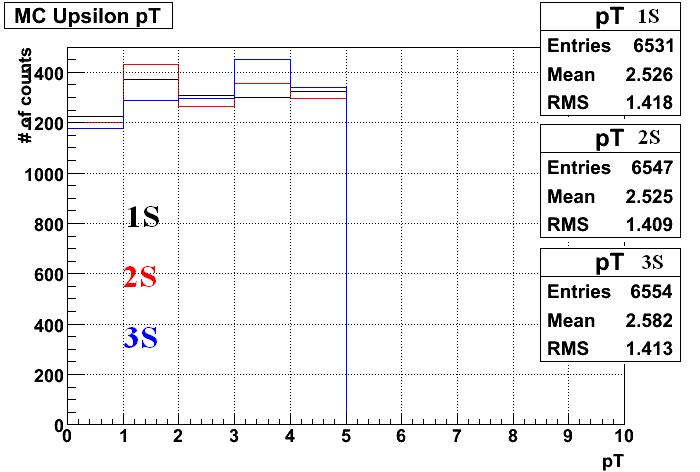
Figure 1. MC pT distribution of the 3 Upsilon states
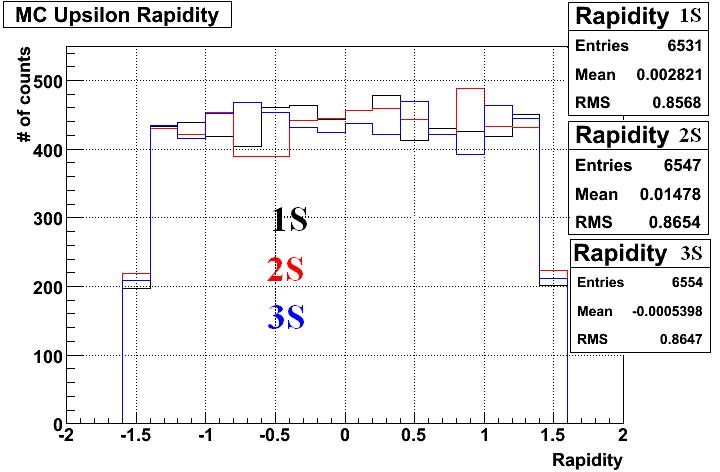
Figure 2. MC Rapidity distribution

Figure 3. MC pT distribution of Upsilon particles that passed Acceptance criteria. Criteria is that both Upsilon daughters leave at least 0.15 GeV in the BEMC.
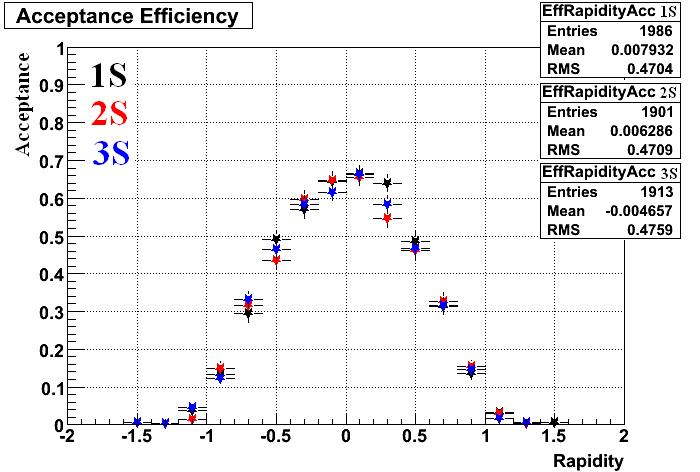
Figure 4. MC Rapidity distribtuion of Accepted Upsilons
I have not posted L0 distributions as they are >99% efficient for all three upsilon states.

Figure 5. L2 Efficiency for trigger 117602 versus MC pT
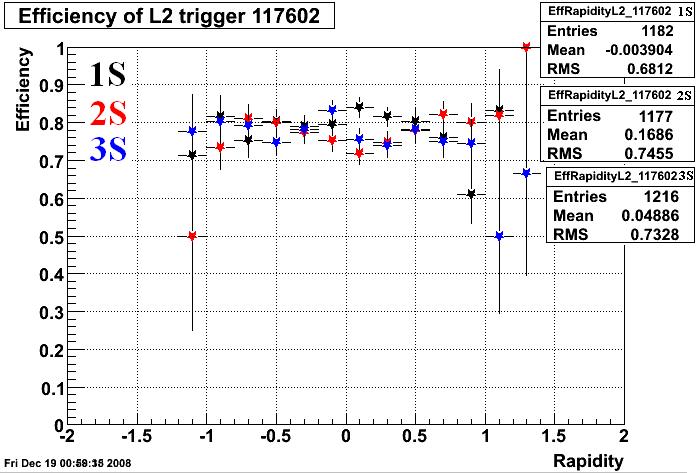
Figure 6. L2 Efficiency for trigger 117602 versus MC Rapidity
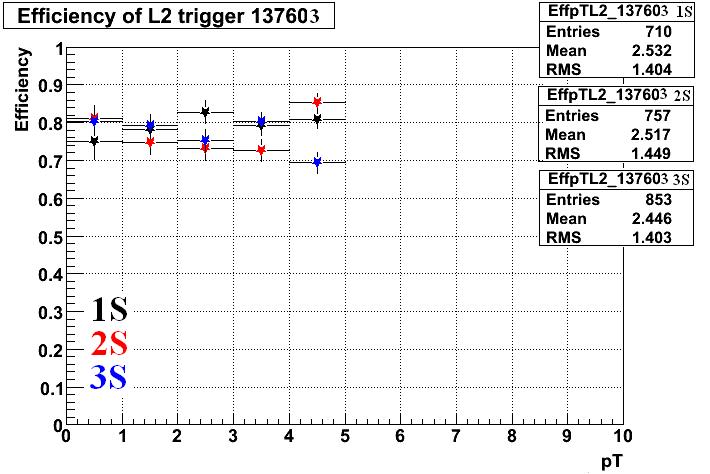
Figure 7. L2 Efficiency for trigger 137603 versus MC pT
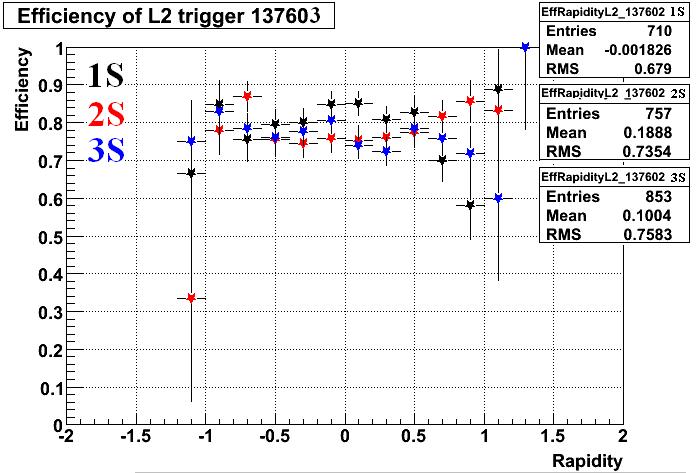
Figure 8. L2 Efficiency for trigger 137603 versus MC rapidity

Figure 9. Total Efficiency for trigger 117602 versus MC pT excluding cuts on E/p and dE/dx. This histogram should be all of the above efficiencies multiplied together, though since each denominator will cancel with the numerator above it, this was calculated simply by dividing the histogram of all the "found" upsilons by all the upsilons that we started with. This is why the error bars are smaller as the error bars of the initial distribution added in quadrature will yield a much smaller result than all of the error bars added in quadrature.

Figure 10. Total effiency versus MC rapidity for trigger 117602
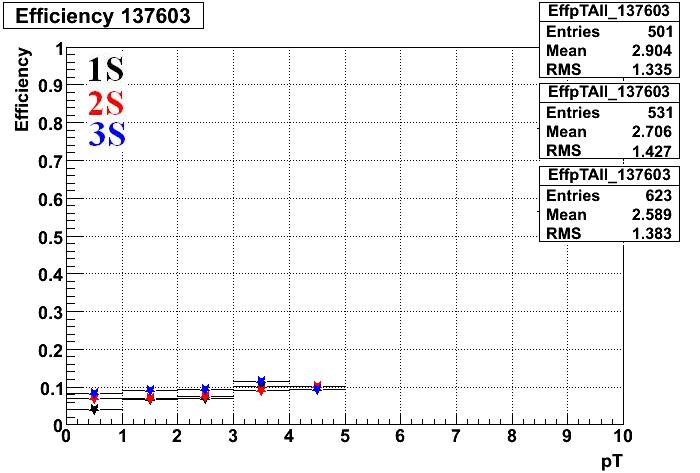
Figure 11. Total efficiency versus MC pT for trigger 137603
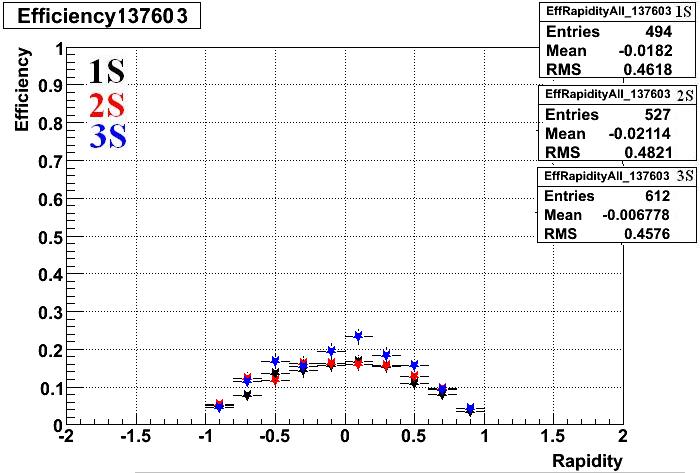
Figure 12. Total efficiency versus MC Rapidity for trigger 137603
- rjreed's blog
- Login or register to post comments