Upsilon in pp2006 P08ic - First look
.jpg)
Figure 1: Analysis of 1st attempt at calculating the upsilon cross section
The graph in the upper left hand side is calculated by subtrackting the red points from the black in the lower left hand side. The track quality cuts in the upper right hand were used. The curve in the upper left hand is a simply gaussian fit from 6 to 14 GeV/c^2. Obviously it doesn't describe the data well, but as I do not intend to stay with these cuts I did not try to fix it. There are several problems here. One is that every track that points to the 3x3 block surrounding either the L0 or the L2 trigger is used. This means that in an event with 2 tracks to L0 and 3 to L2 there will be 6 invariant masses calculated. However, these masses will be very similar if multiple tracks survive the additional cuts simply because it is assumed that each track has the high tower trigger energy.
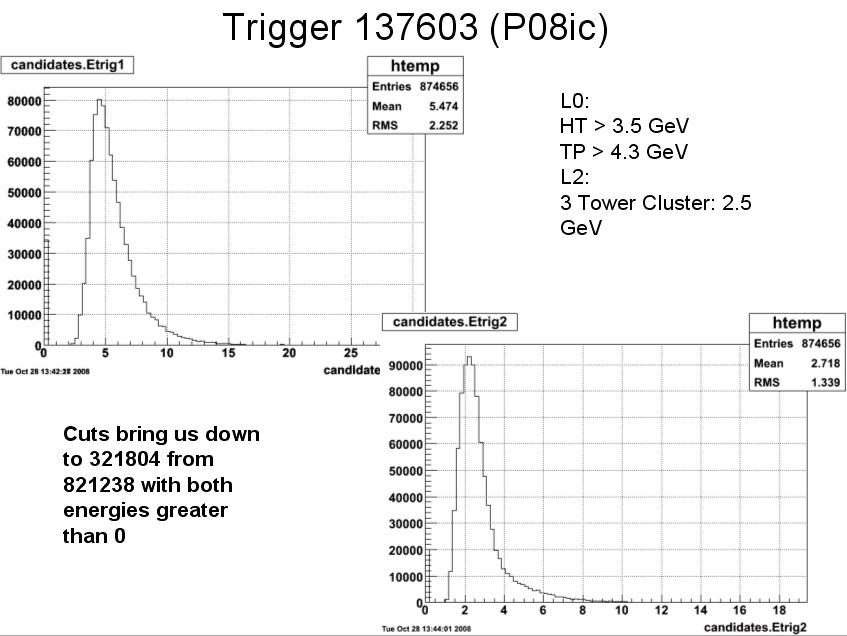
Figure 2: Energy distribution of the L0 and L2 high tower triggers. I am assuming that 0 enteries were removed after the fact due to masking and the like. I think the cuts on energy are too great here. We lose a lot of candidates that may be good. Also, I did not consider these cuts in my efficiency calculation using the embedding.
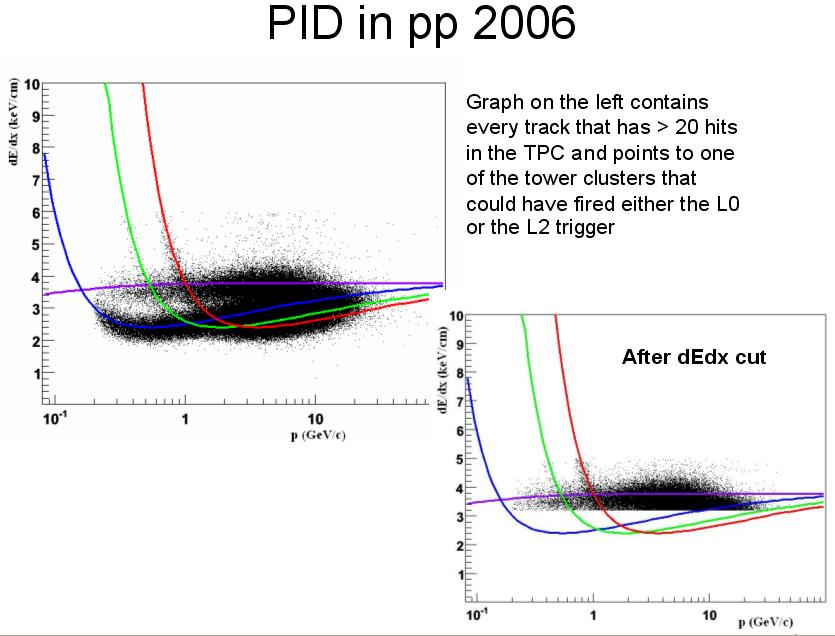
Figure 3: All particles which pass the track quality cuts and point to 3x3 area around L0 or L2. The lower right hand graph has a cut of dE/dx > 3.4 keV/cm. We can see that this cut removes a lot of the lower momentum pions. Further analysis of this cut will be done.
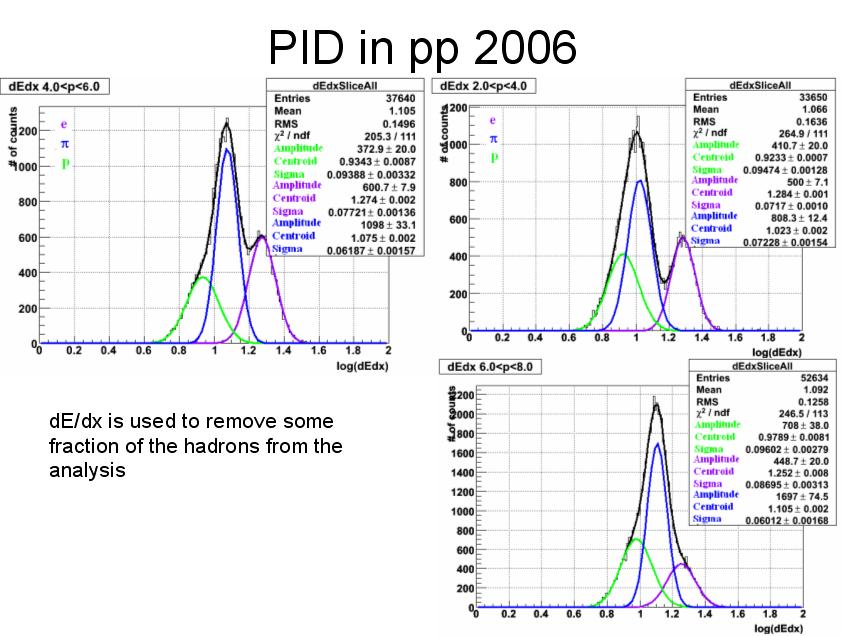
Figure 4: ln(dE/dx) fit with 3 gaussian curves. Past 8 GeV the overlap was large enough that fiting a curve was difficult. At some point I will return to this and do smaller momentum slices. The tracks used here passed the TPC track quality cuts.

Figure 5: Efficiency and purity calculated from graphs in figure 4. For a first approach, I chose a cut of 5>dE/dx>3.5 and assumed that the efficiency would scale linearly with momentum. Obviously this approach needs more work.
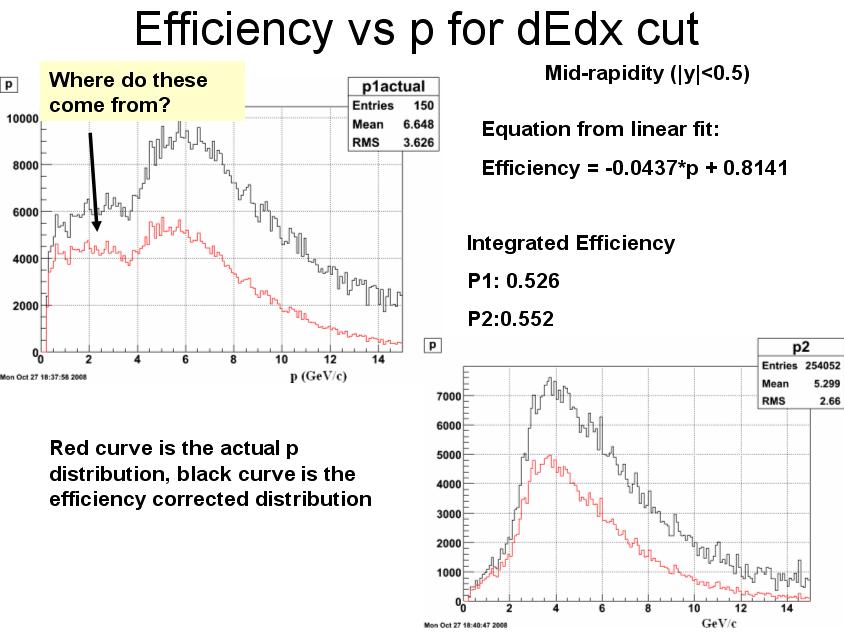
Figure 6: dE/dx cut efficiency verus momentum based on cut in figure 5. The upper left are tracks that point to the 3x3 area around L0 and the lower right are the tracks that point to the 3x3 area around L2. I do not understand the weird shape for the L0 tracks. The total efficiency in both cases was calculated by integrating the red curve and dividing it by the integral of the black curve.
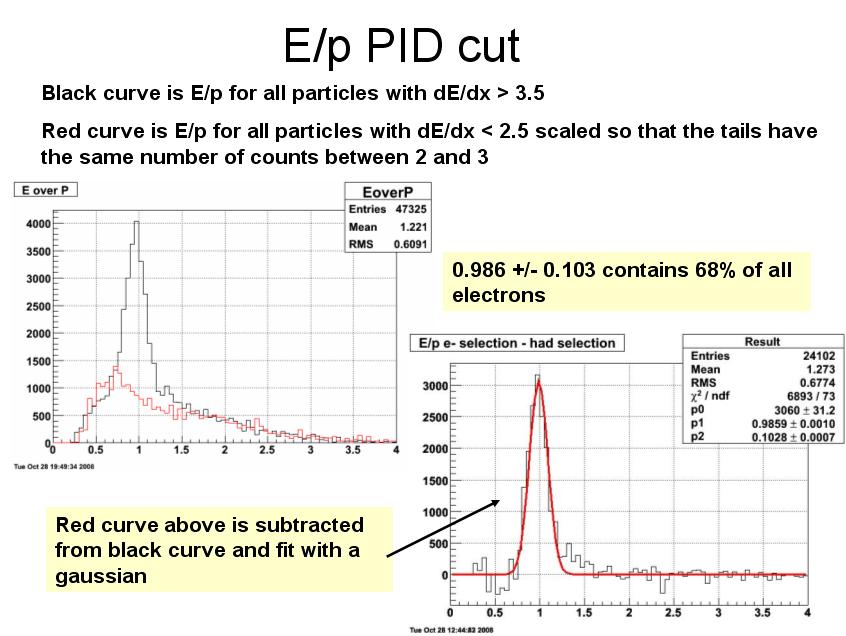
Figure 7: E/p cut on tracks that passed the dE/dx cut. Efficiency was based on the standard gaussian percentages.

Figure 8: Obviously wrong invariant mass plot. The fluctuations in the low mass region are too high, the number of upsilons (found by integrating the red curve) is too high, and there are many bins which do not have entries due to the tight cuts.

Figure 9: Mid-rapidity upsilon cross section calculation. The plots on the left are from the embedding done for QM2007, but the geometry was not quite right as it did not include the full BEMC. Once the proper geometry is available the embedding will be rerun.
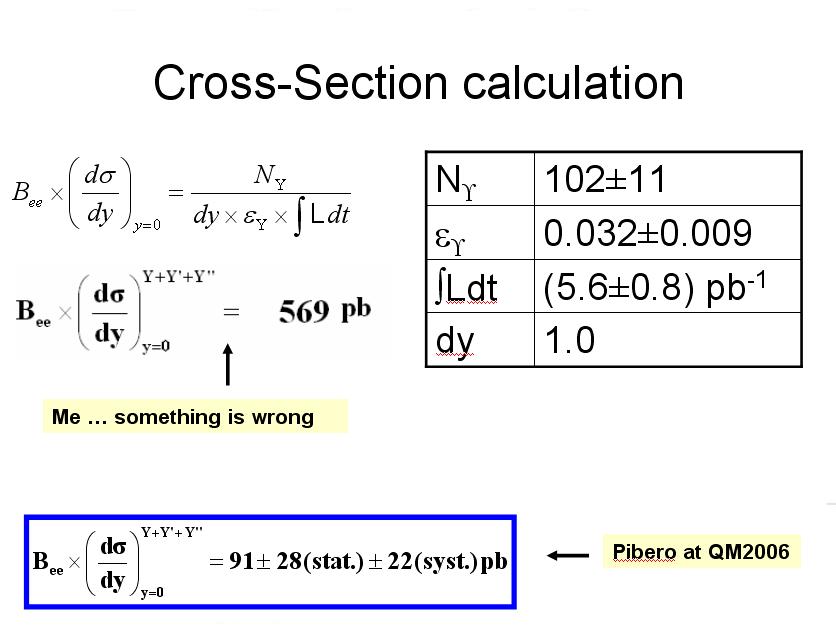
Figure 10: Total cross section, which is an order of magnitude too large. I believe it is due to the extra tracks included in this analysis that were not included in the previous analysis.
.jpg)
Figure 11: Number of tracks point to 3x3 L0 versus number of tracks pointing to 3x3 area around L2. An event with 3 L0 and 3 L2 tracks will have 9 candiate upsilons, which will all have similar inv masses. (This analysis was only done for 7951 Events.)
Numbers for the above histogram:
L0L2[1,1] = 3270
L0L2[1,2] = 1939
L0L2[1,3] = 243
L0L2[1,4] = 26
L0L2[1,5] = 1
L0L2[2,1] = 1201
L0L2[2,2] = 824
L0L2[2,3] = 113
L0L2[2,4] = 11
L0L2[2,5] = 2
L0L2[3,1] = 150
L0L2[3,2] = 112
L0L2[3,3] = 20
L0L2[3,4] = 4
L0L2[4,1] = 20
L0L2[4,2] = 12
L0L2[4,3] = 2
L0L2[4,4] = 1
Out of 7951 events, 3270 + 1939 +243 + 26 +1 +1201 + 150 +20 = 6850 do not have at least one track in L0 and L2 (~86%!). Out of the 1101 events which can have an invariant mass, 824 only have one track in each 3x3 area. 113+112 = 225 have two tracks in one trigger, leading to 550 more. 11+12 = 23 have 1 and 3, which leads to 69 more. 20 have 2 tracks in each trigger, leading to 80 more.
Essentially the number of duplicated entries is quite high compared to the number of entries that only have a single track in each trigger section.
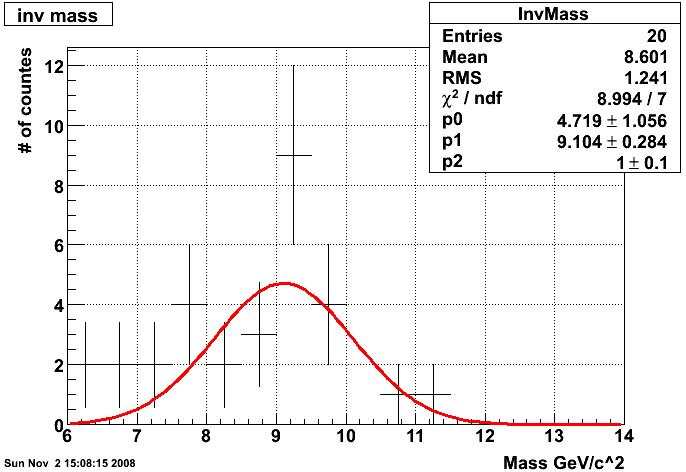
Figure 12: Invariant mass with the same cuts as before, but includes a cut only for events with a single track in L0 and a single one in L2. Obviously, this cut is not what we're going to want to use and combined with my much harsher PID cuts we've lost almost everything. But at least the statistics look right.
- rjreed's blog
- Login or register to post comments