Upsilon Trigger Efficiency Calculation for pp2006 triggers-> Acceptance
Using file list found here:
/home/rjreed/CurrentUpsTriggerEfficiency/upsilon1s600SeriesGeantRootFiles.list
which is 1S state upsilon pp embedded files from embedding run with weird rapidity distribution. These files contained 40695 events.
Only MC tracks were used in this part of the analysis. No reconstructed tracks were needed.
I started with the definition of acceptance as 1 hit in the BEMC for both the electron and positron.
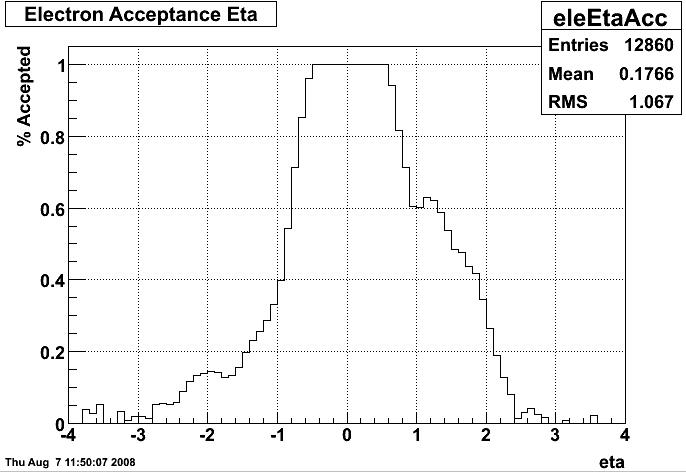
Figure 1: Accepted electrons with at least 1 hit in the BEMC.
As seen in Figure 1, the acceptance was asymmetric, which is unacceptable. (am I allowed to pun in my blogs?) The endcap is at the positive rapidity side. Hits may come from showers off of the endcap, which would cause many more y > 1 electrons to be accepted. Instead of hits, we decided to try a sum BEMC energy > X. Looking at the efficiency (for only one daughter particle), we have:

Figure 2: Electron acceptance efficiency versus cut in total energy deposited into the BEMC. Efficiency was calculated at the "found" number of electrons with |eta| < 0.8 divided by the total number of electrons with |eta| < 0.8. This plot should be done in terms of the parent upsilon for analysis meeting.
The red point at 0.25 GeV is where I decided to make my cut. The curve has flattened out there so the exact energy at that point is not important. The error bars are statistical. Looking at the acceptance for the electron, we get:

Figure 3: Electron acceptance where acceptance is defined by the daughter track leaving more than 0.25 GeV in the BEMC. This is nicely symmetric.
We want acceptance in terms of the upsilon pt and rapidity. I will only use the MC values of the upsilon for my calculations.
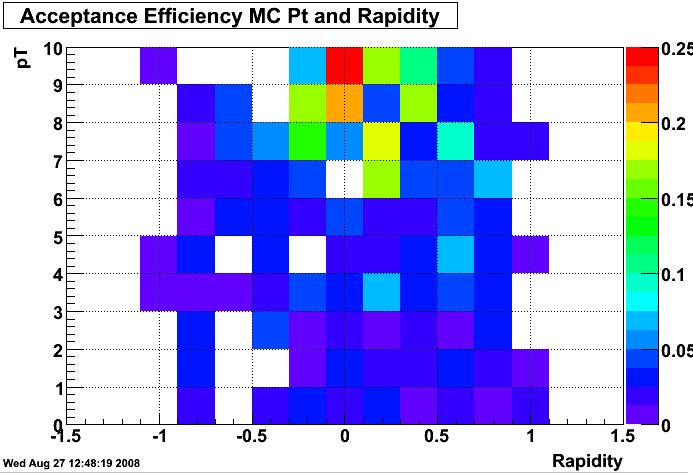
Figure 3: Acceptance based on upsilon rapidity and pT
Unfortunately the strange distribution of the upsilon embedded files does not allow me to populate y-pT space properly. 1D graphs will probably be easier to visualize, so here they are:
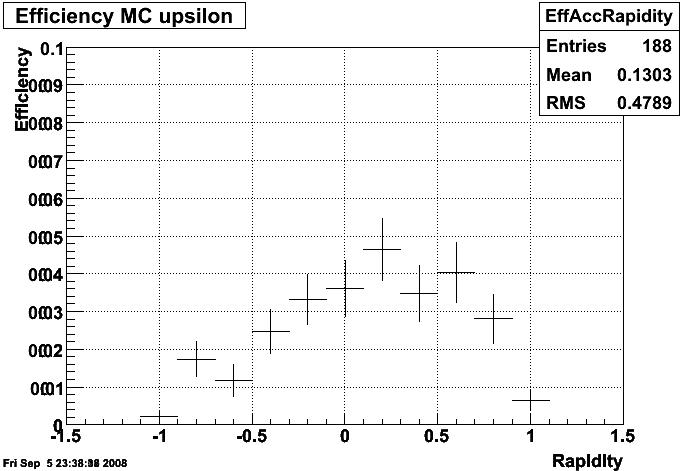
Figure 4: Acceptance Efficiency vs Rapidity for MC Upsilons. Error bars are binomial ... not entirely accurate at this low of a percentage.

Figure 5: Acceptance Efficiency versus Pt. Error bars are binomial.
Total Acceptance Efficiency = 188/40695 = 0.46% +/-0.03%
Acceptance Efficence for |y| < 1 = 184/7009 = 2.6% +/-0.2%
Acceptance Efficence for |y| < 0.8 = 169/5265 = 3.2% +/-0.2%
These seem really low. Figure 1 has 2447 found electrons, out of 40695 ~6%. So 6%^2 is ~0.36% which matches above. I am concerned by the low number at mid-rapidity.
Previously when calculating efficiency for the Esum, I had used |upsRap|<0.8 and eleEsum > 0 as the denominator, which I didn't directly above. Only 2096 Events passed this cut, which means that the efficiency percentages were much higher at the top of this page because the denominator was so low. My rational in including the eleEsum > 0 in the denominator is that I did not want to include reconstruction effects in the acceptance efficiency. The piece of code that calulates eleEsum (or posEsum) for a particular StMuTrack is:
{
StMcCalorimeterHit* MaxCalHit = 0;
double maxEnergy = 0;
double sumE = 0;
short unsigned int MaxRecoADC = 0;
int MaxSoftId = 0;
for (size_t i=0; i<mcTrack->bemcHits().size(); ++i) {
StMcCalorimeterHit* calHit = mcTrack->bemcHits()[i];
int modN = calHit->module();
int etaN = calHit->eta();
int subN = calHit->sub();
float dE = calHit->dE();
Float_t eta = 0;
Float_t phi = 0;
StEmcGeom *geomBemc = StEmcGeom::getEmcGeom(1);
geomBemc->getEta(modN,etaN,eta);
geomBemc->getPhi(modN,subN,phi);
// factor to convert adc -> GeV
sumE = sumE + dE*scaleFactor(eta);
if (dE*scaleFactor(eta) > maxEnergy){
maxEnergy = dE*scaleFactor(eta);
MaxCalHit = calHit;
}
}
if (isele)
eleEsum = sumE;
else
posEsum = sumE;
}
Now I'm not certain that this is appropriate based on the way I calculate the trigger efficiencies. First I cut on eleEsum > 0.25 and posEsum > 0.25 to get the number of upsilons that passed the acceptance. This number is the denominator when I calculate the trigger efficiency, with the numerator being the number of upsilons that were triggered on. So, later when I find the offline efficiencies of the daughter tracks by looking at the daughters of the upsilons that have passed the trigger, I've already taken the tracks where eleEsum or posEsum == 0 out of the basket. So, I believe that these need to be taken care of in the acceptance.
I am slightly worried about what this would mean for calculating the L0 trigger efficiency. Since this fires only on a single tower, it's not important that both daughters have the chance to leave energy in the BEMC, only one needs to in order for this trigger to fire. This is something we (I?) need to think about.
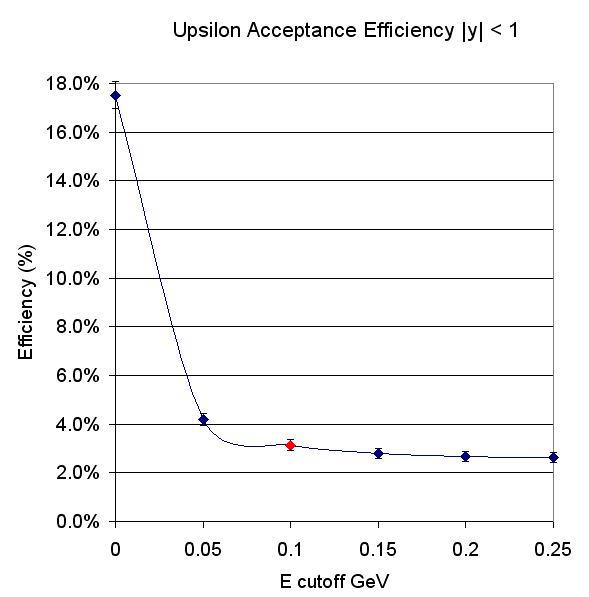
Figure 6: Upsilon Acceptance Efficiency vs. Esum cut off. The denominator is |upsRap|<1, the numerator is |upsRap|<1 and eleEsum > X and posEsum > X where X is the E cutoff. The error bars are statistical.
Based on the shape of Figure 6, it appears that a cutoff energy of 0.1 GeV will work for the acceptance criteria. Repeating the three graphs above with the new criteria gives:
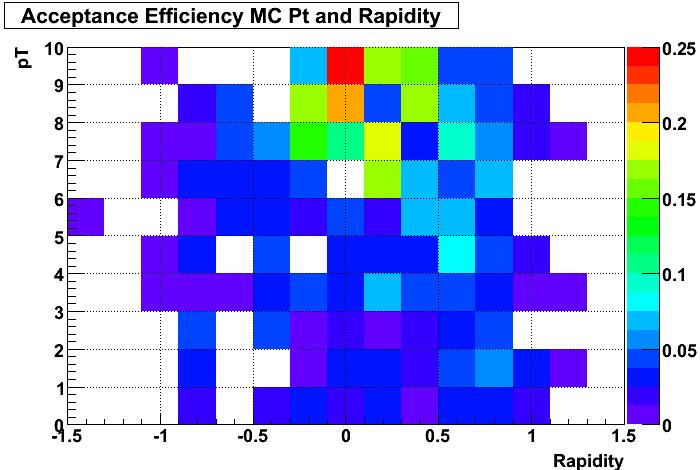
Figure 7: Acceptance Efficiency vs MC upsilon rapidity and pT with acceptance = eleEsum > 0.1 and posEsum > 0.1

Figure 8: Acceptance Efficiency vs Pt (no cut on y)

Figure 9: Acceptance Efficiency of MC upsilon vs y (no cut on Pt)
Acceptance Efficiency is 233/40695 = 0.573 % +/-0.038%
Acceptance Efficiency midrapidity (|Uy|<1) is 220/7009 = 3.14% +/-0.22%
- rjreed's blog
- Login or register to post comments