PID in the upsilon pp 2006 data set
Some defintions:
nHitsFit = # hit points in the TPC used for the fit
nHitsPot = # of possible of hit points in the TPC
PID is done using cuts on dE/dx and E/p. Previously I cut the tracks so that I only kept tracks with 5>dE/dx>3.3 keV/cm.
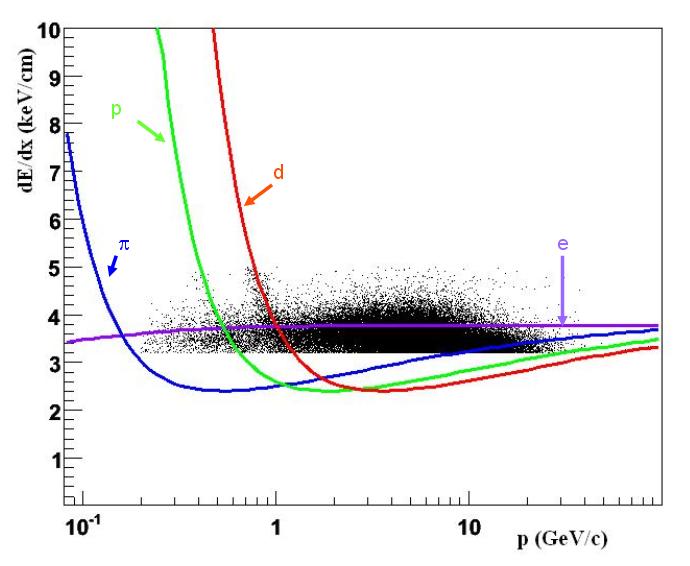
Figure 1: Tracks with nHitsFit>20, nHitsFit/nHitsPos>0.52, pT > 0.2 GeV that point in the 3x3 tower section around the L2 or L0 trigger. A cut of 5 > dE/dx > 3.3 keV/cm was applied. The curves were created using the Bichsel parameterization. As seen above, it is not possible to completely seperate the electrons only using a dE/dx cut.
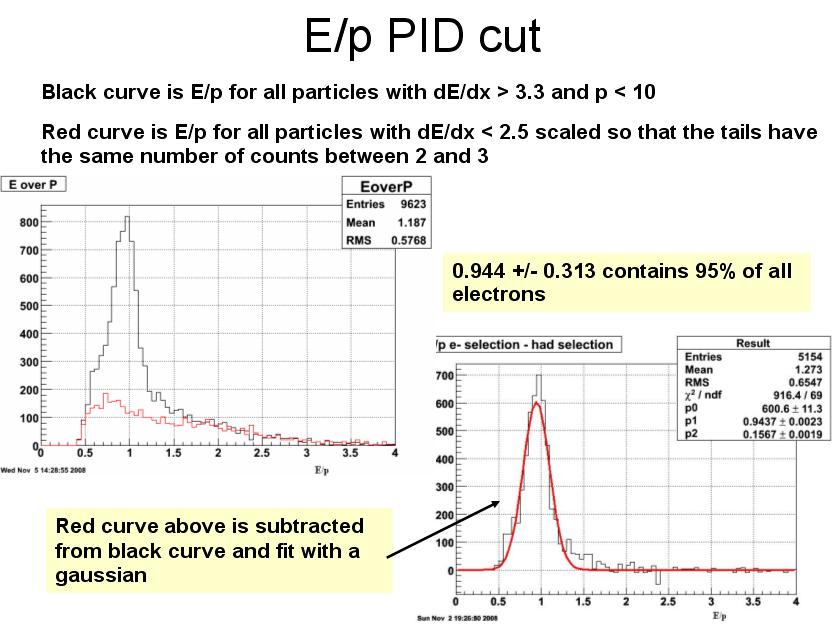
Figure 2: Previous method of selecting electrons. These tracks had the same cuts applied in Figure 1. The energy is the high tower energy from the BEMC.
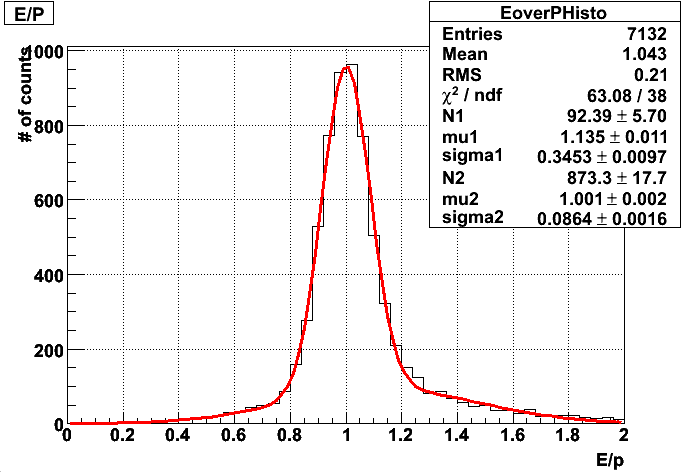
Figure 3: E/p from embedding. Tracks passed same track quality cuts as Figure 2 and 3. The momentum comes from the reconstructed track momentum. The energy is the energy of the three highest towers in the barrel calorimeter.
Based on the graph above, I had decided to do a cut on 1.15 > E/p > 0.85 in the data, where E would also be the 3 tower energy cluster and p would be the momentum in the TPC. However, when I applied this to the data, it killed the signal.
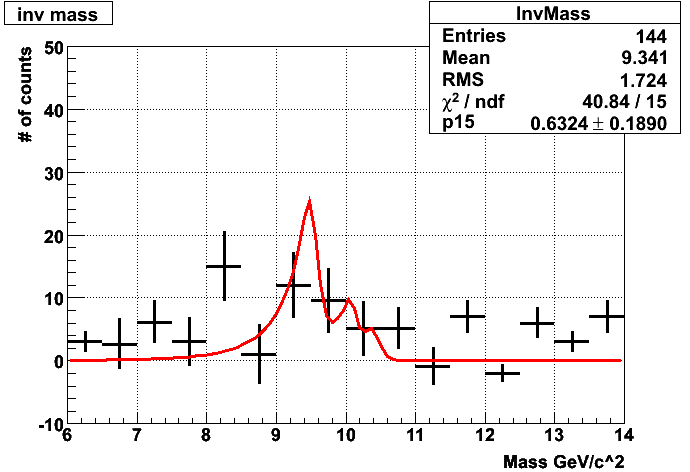
Figure 4: Invariant mass using particles that passed the above cuts, and were within d = 0.04 in eta-phi space.
I investigated further. One would expect that an E/p cut would diminish the # of hadrons in a plot of dE/dx for a particular momentum slice.
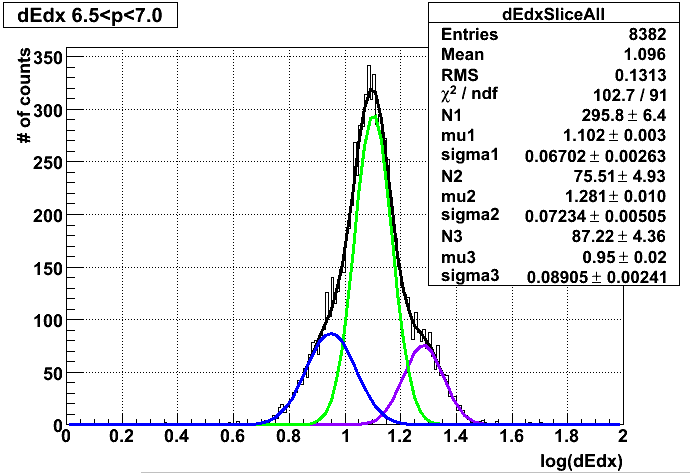
Figure 5: log(dE/dx) for tracks with 7 > p > 6.5 GeV which passed track quality cuts and pointed to either the L2 or L0 trigger cluster
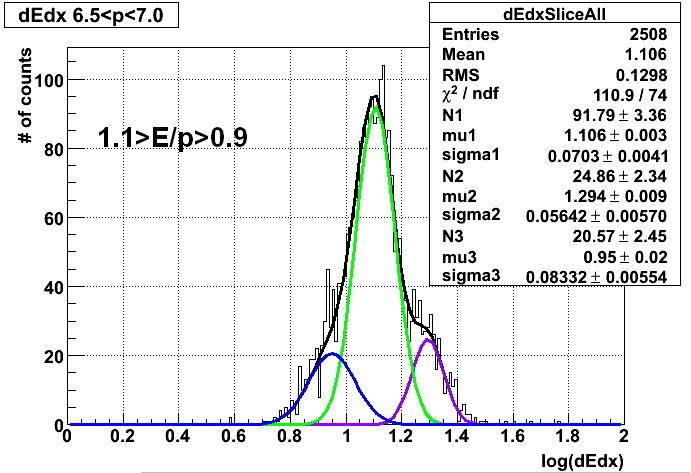
Figure 6: Figure 5 after 1.1 > E/p > 0.9 cut. The ratio of electrons (in purple) to hadrons (mostly pions, in green) is essentially the same, so it doesn't look like this cut actually improved the quality of the sample. This does not seem to make sense.
After I had seen Figure 4, I started to set up code so that I could do an effective signal calculation. Obviously, I was going to need to adjust the E/p cut, and it would be poor science to adjust it by looking at the upsilon signal. So, my plan was to fit a function that was a combination of a function fit from the hadrons (red curve in Figure 2) and the E/P from the embedded electrons. I would then see how an E/P cut would effect the ratio of background to signal.
.bmp)
Figure 7: E/p of tracks with dE/dx < 3.3 keV/cm which otherwise pass all other track quality cut. 10>p>4 for these tracks. E is the 3 tower cluster energy. The data was fit with a gaussian from 0 < E/p < 1 (Amplitude = p0, mu = p1, sigma = p2). An expontential fit was used from 1 < E/p < 2 with amplitude set to be the same as the gaussian and exponential constant = p3. Oddly enough, the shape of this curve does not appear to be the same as the one in Figure 2. (The amplitude wouldn't be because the curve in Figure 2 was scaled.)
In order to determine what was going on, I decided to concentrate on the range 7 > p > 6.5 GeV.
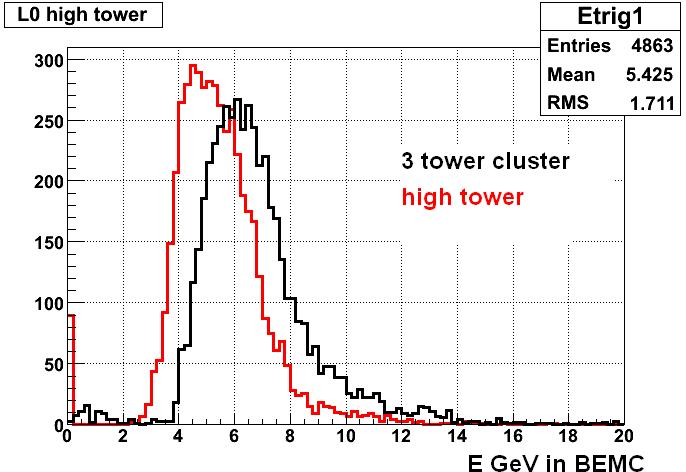
Figure 7: For the momentum slice 7 > p > 6.5 the difference in barrel calorimeter energy for using a high tower versus cluster for L0 tracks that passed track quality cuts and were from events where the number of tracks pointing to the triggers is only one to avoid double counting.
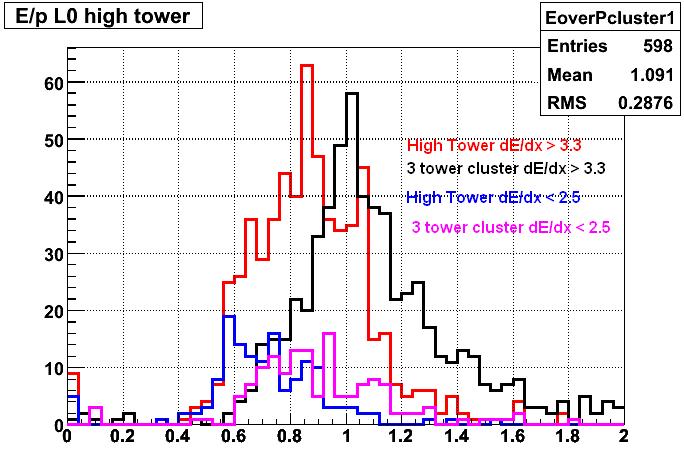
Figure 8: E/p for postively charged particles in 7 > p > 6.5 (only 1 track to each trigger).
So, it looks like the E/p definitely shifts for both the hadrons and the electrons by using 3 towers instead of one tower.
My plans for the immediate future are to look at nSigma electron. Also I will fit a curve (ERF function + exponential) to the hadrons (charge+) then fit that and gaussian to ele+had (fit from E/p > 0.8) and see how the cuts work.
- rjreed's blog
- Login or register to post comments