- stevens4's home page
- Posts
- 2014
- 2013
- 2012
- 2011
- December (1)
- November (2)
- October (1)
- September (1)
- August (2)
- July (3)
- June (7)
- May (2)
- April (2)
- March (5)
- February (2)
- January (2)
- 2010
- November (1)
- October (1)
- September (3)
- August (3)
- July (3)
- June (1)
- May (1)
- April (3)
- March (4)
- February (4)
- January (8)
- 2009
- December (4)
- November (3)
- October (4)
- September (5)
- August (1)
- July (2)
- June (2)
- April (1)
- March (1)
- February (2)
- January (1)
- 2008
- My blog
- Post new blog entry
- All blogs
Run 8 Pions - Correlations
Correlations with Invariant Mass
Data Set1: STAR 2008 pp data
- I used the following query conditions in the file_catalog for this study:
trgsetupname=ppProduction2008,production=P08ie,filetype=daq_reco_MuDst,filename~st_physics,tpc=1,sanity=1
Trigger: etot-mb-l2
Trigger Simulator: L2Gamma from 2006
The analysis was done using the same algorithm and cuts used in Weihong He's final analysis of the Run 6 data.
Data Set 2: STAR 2006 pp data
- I used a subsample of Weihong's final pi0 trees to make the same correlation plots for the 2006 data.
Summary:
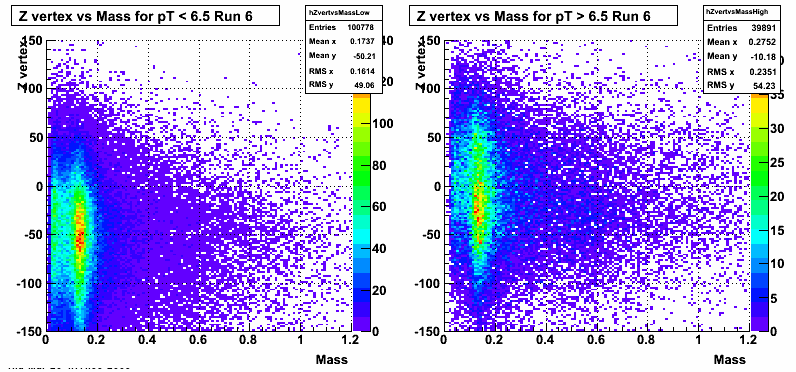
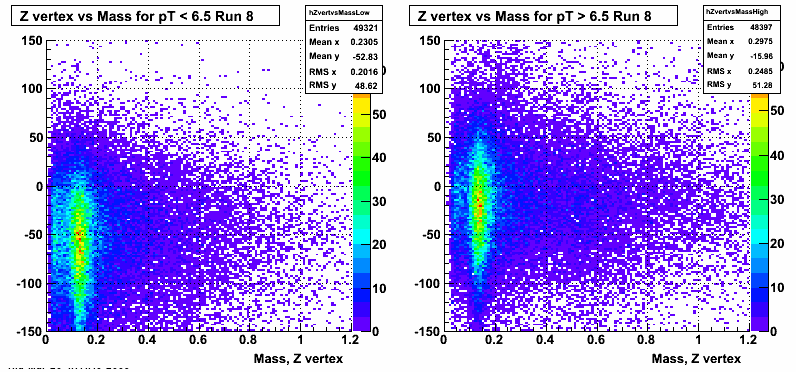
In my previous posts there has been some discrepancy in the width of the mass peak for the pions between run 6 and run 8 data. In order to understand this better, I made some correlation plots as well as 1-D distributions of some of the contributing factors. Hopefully we can see something from these. The plots are divided into 2 pT bins with ~half of the statistics in each for the 2008 data.
Figure 1: EEMC Detector Eta vs. Mass
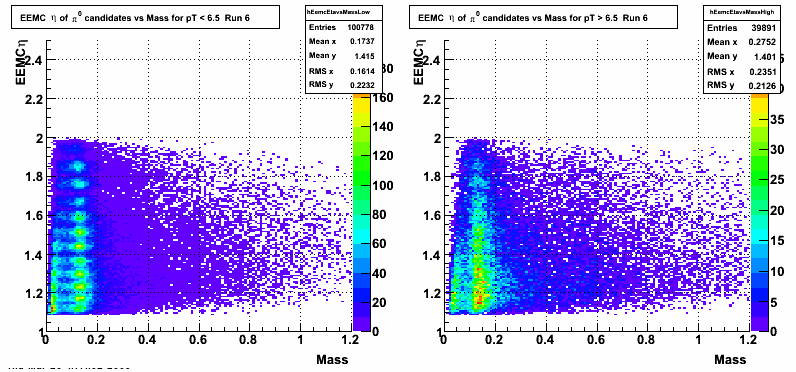
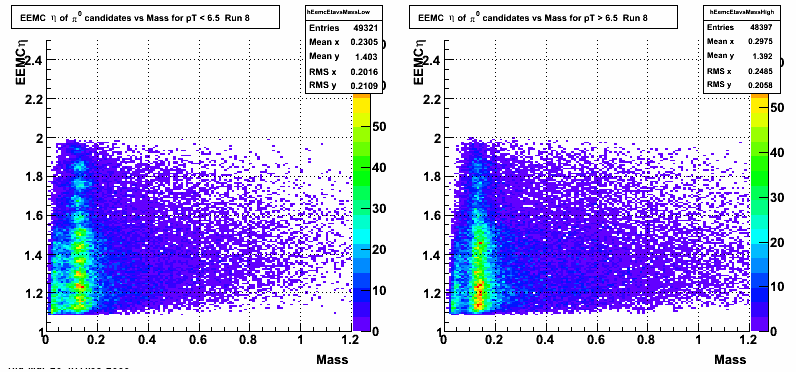
Figure 2: Physical Eta vs. Mass
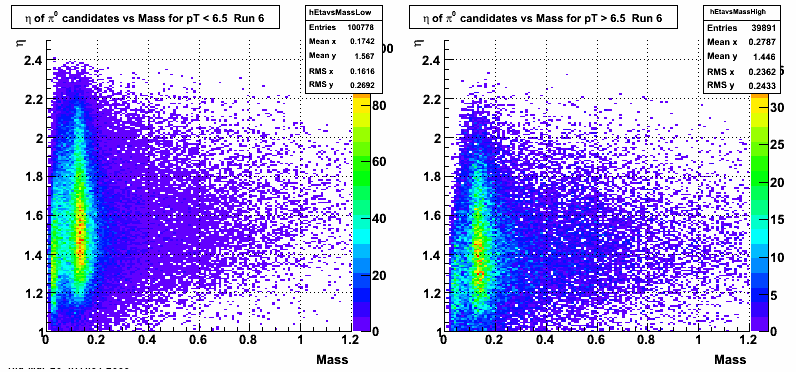
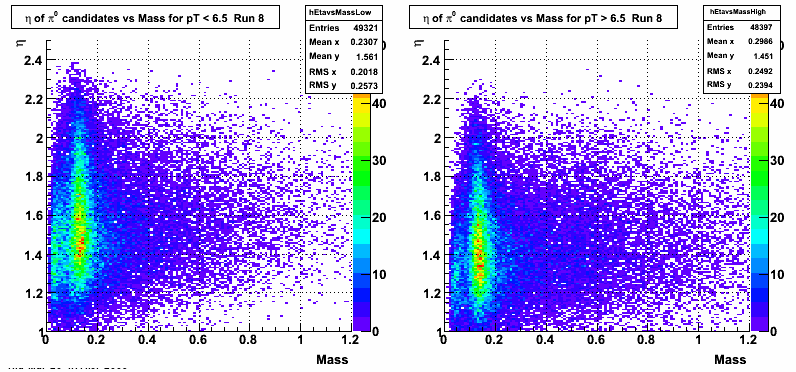
Figure 3: Zgg vs. Mass
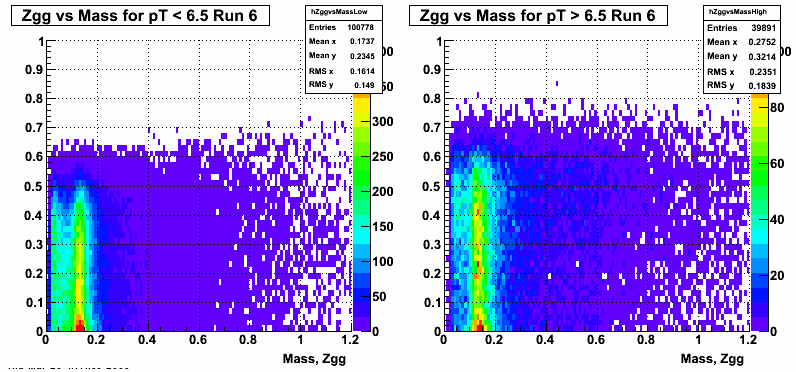
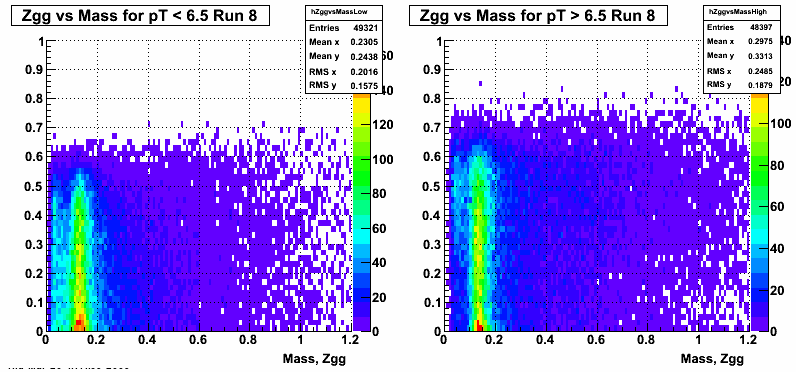
Figure 4: Phigg vs. Mass (note different y scales)
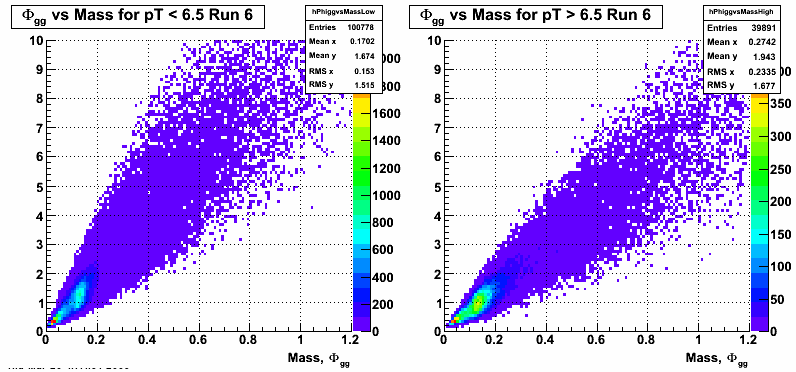
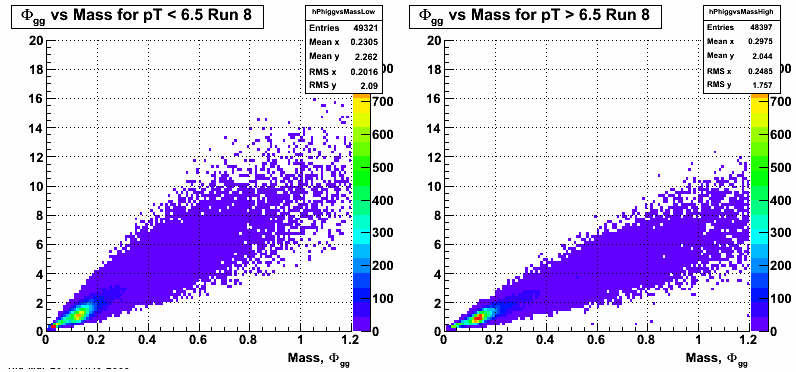
Figure 5: Z vertex vs. Mass
From here on the entire run 6 data set is used for comparison and the run 8 data is normalized to the run 6 samples.
Figure 6: Zgg Distribution ( Run6 all pT => black : Run8 all pT => blue: Run8 pT < 6.5 => red: Run8 pT >6.5 => green : Run 6 pT < 6.5 => yellow: Run6 pT > 6.5 => magenta)
.png)
Figure 7: Point Et Distribution ( Run6 => black : Run8 => red )
run 6 points = 14675345 and run 8 points = 14571573
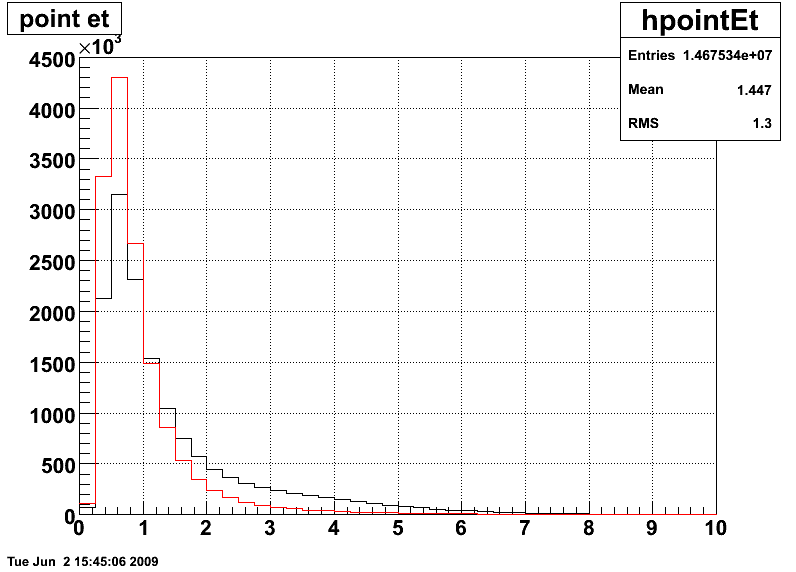
Figure 8: Pion Energy Distribution ( Run6 => black : Run8 => red : Run8 with L2 Gamma => green)
run 6 pions = 853595 and run 8 pions = 98457
.png)
Figure 9: Pion Pt Distribution ( Run6 => black : Run8 => red : Run8 with L2 Gamma => green)
run 6 pions = 853595 and run 8 pions = 98457
.png)
- stevens4's blog
- Login or register to post comments
