Drop in <ADC> for a few runs
Throughout this blog, I use plots accessible through the RunLog browser. You can find them at e.g. https://online.star.bnl.gov/runPlots/20081001.shift.pdf
Starting around run number 20081005, you can notice a slight decrease in <ADC> of West PP8 TT22 compared to just a few runs before:
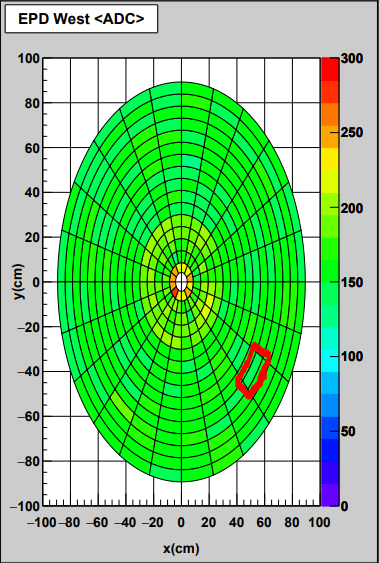
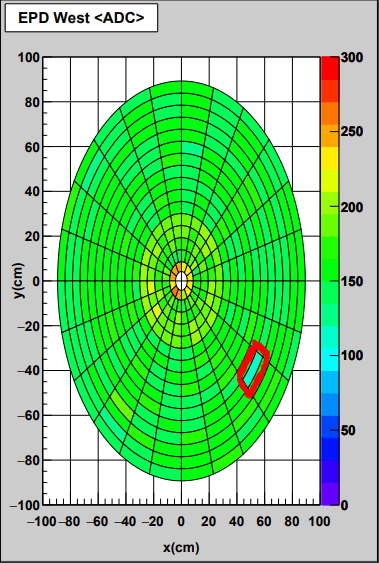
This seems like no more than a fluctuation, but it continually gets worse of the next few runs, until run 20081009, after which it plateaus.
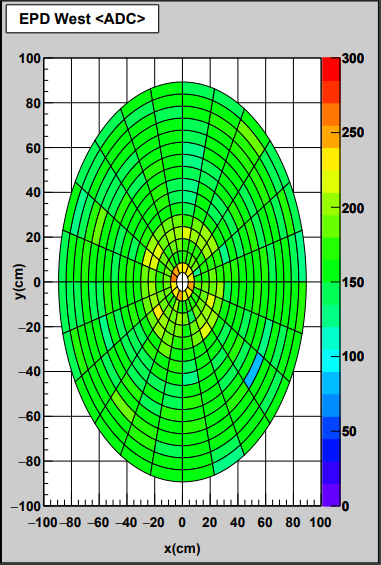
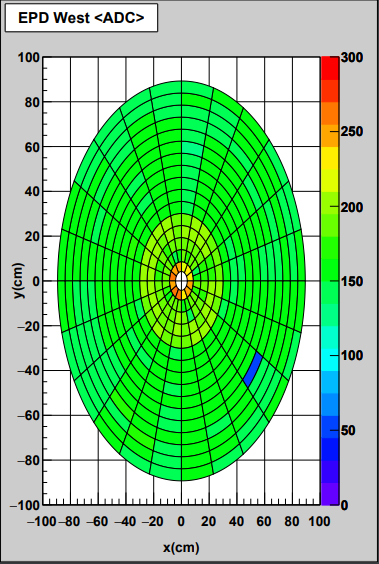
Between runs 20081021 and 20081025, pedestals were taken and the problem went away.
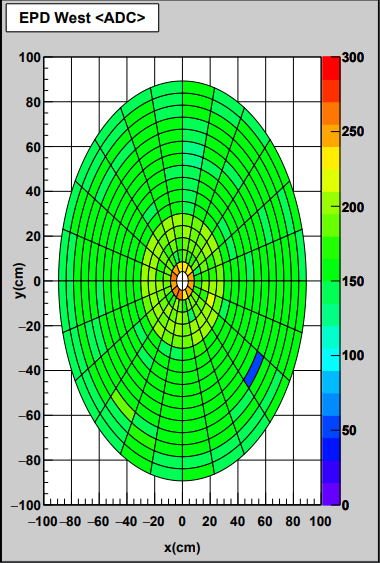
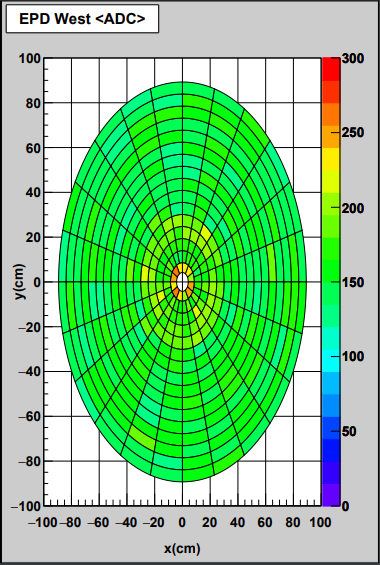
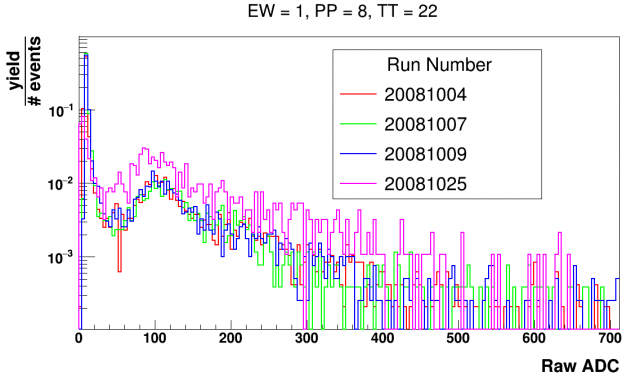
Looking at the raw ADC distributions for a few of these "bad runs", there is no noticeable change, even as the tile becomes more blue (although FastOffline has few statistics so it is hard to tell). Once the pedestals are taken, the ADC distribution looks much better.
NOTE: The plot below is incorrect; the histograms are normalized by their areas rather than by the number of events, contrary to the y-axis label.
This is not a serious issue, and has only happened once so far in the run. I don't believe it's worth investigating unless it happens at least a few more times.
April 24, 2019
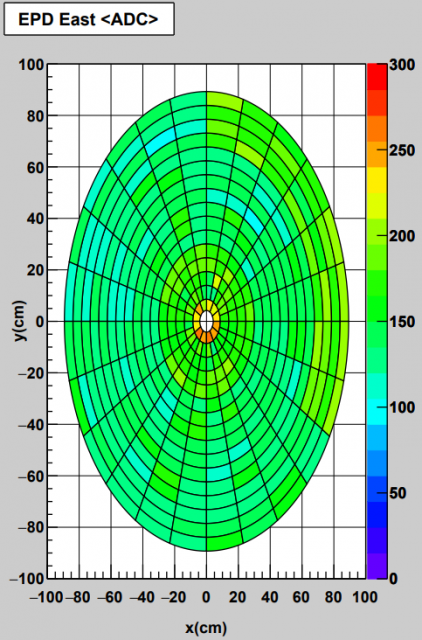
This started appearing again a few nights ago. Starting in run 20110001, there is a low <ADC> in a few tiles on the East, which persists through run 36.
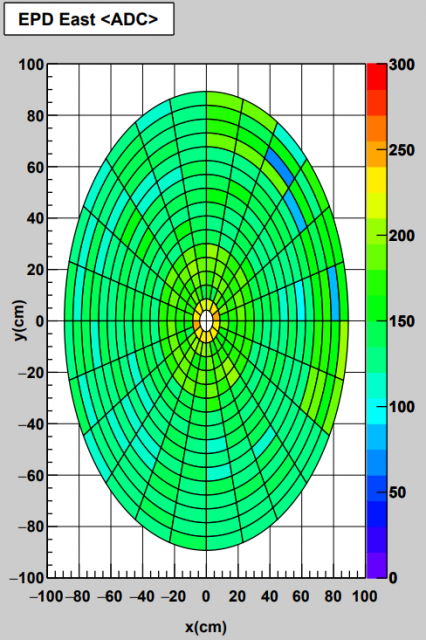
After this run, pedestals are taken and in the subsequent run, 38, the issue is no longer there.
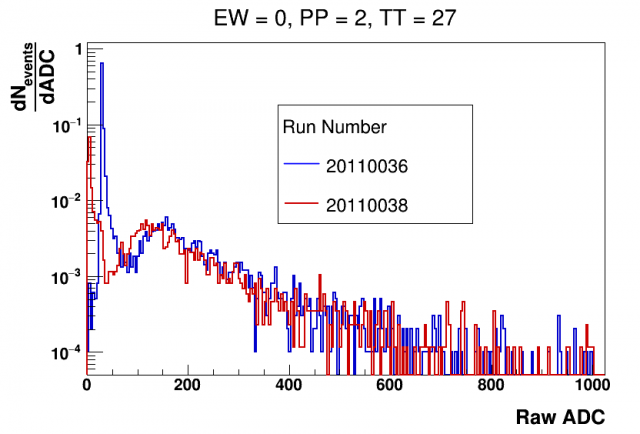
Looking at the ADC distributions (this time properly normalized so that the y axis label is to be believed), we see that the most-blue tile is noisier before the pedestal, but a MIP peak is still discernible.
This presents itself again, starting in run 20112026, with two more tiles.
Fitting these with Landau distributions and looking at the MPV, we see a shift in ADC of 28.7 +/- 7.5.
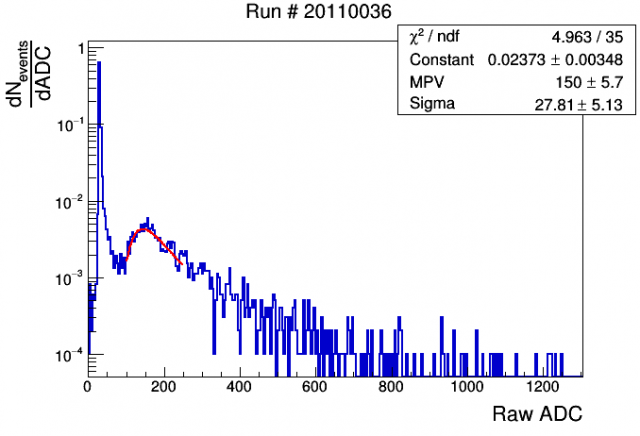
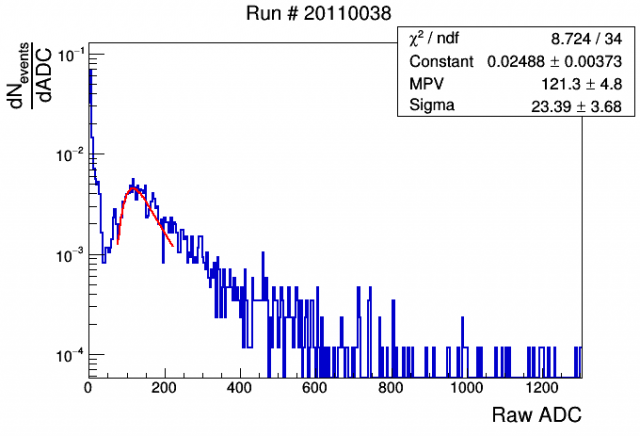
The peak in the noise shifts by an ADC of 27 (from 30 to 3), which is consistent with the shift in MPV, and the widths of the two distributions are consistent with each other.
- adams92's blog
- Login or register to post comments
