Psi1 distribution evolution in the EPD
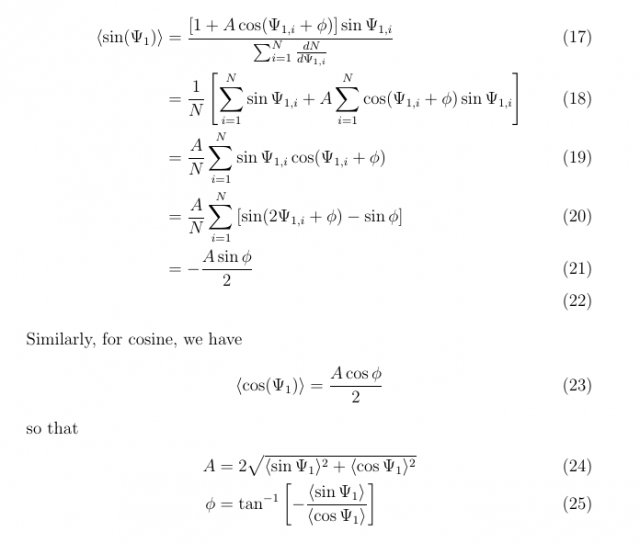
In order to avoid correlating important observables (e.g. Lambda spin), whose measurements may already have dependencies on detector non-uniformities, with non-uniformities in the event plane distribution as measured by the EPD, it is important to have consistently flat event plane distributions. Furthermore, non-uniformities on either side of the EPD will affect the measurement of the resolution in a ways not corresponding to the actual resolution. It is therefore important to know the important time scales for flattening, whether it be runs, fills, days, etc. We can investigate this by looking at the flatness of the raw Psi1 distribution over time. We can extract the amplitude and the phase of the normalized distributions through the average sine and cosine of the event plane angles:
I am looking at 2018 27 GeV Au+Au data, and my event cuts are:
- Reject runs marked as "bad" in the run-log browser
- Only use minimum-bias triggers (610001, 610011, 610021, 610031, 610041, 610051)
- Only use events with |v_z| < 50 cm
- Only use events with |v_{z, TPC} - v_{z, VPD}| < 2.5 cm
- Only use events with |v_T| < 2 cm
- Only use events with TOF multiplicity > 1
- Reject events with a difference between positive and negative eta track count greater than 5
- Reject 80-100% centrality events
When using the EPD, I calculate the Q vectors with nMIP, which is set to 0 if less than 0.3 and set to 2 if greater than 2.
If we plot the amplitude and phase for both sides of the EPD, we see significant evolution over time.
 Figure 1: Evolution of the amplitude of Psi_1 for the East EPD. The x axis corresponds to time, but is not linear.
 Figure 2: Evolution of the amplitude of Psi_1 for the West EPD. The x axis corresponds to time, but is not linear.
 Figure 3: Evolution of the phase of Psi_1 for the East EPD. The x axis corresponds to time, but is not linear.
 Figure 4: Evolution of the phase of Psi_1 for the West EPD. The x axis corresponds to time, but is not linear.
We can see jumps in amplitude and phase of these distributions by many sigmas on a run-by-run basis. It seems hard to believe that the jumps would be so significant, so we look within consecutive runs to be sure:
 Figure 5: Evolution of the amplitude and phase of Psi_1. The x axis in this case is linear.
We can see in Figure 5 a strong time dependence even within runs, which is consistent with Figures 1-4. The cause may be the change of beam conditions, such as a "walking" of the beam, change in luminosity, or change in "beam cleanliness". It would be interesting to look at these for each ring, but I don't plan on doing this. In any case, it is apparent that flattening all runs simultaneously is not good enough. When we look at the amplitude and phase throughout a run, compared with the run average, we see that (at least in the few runs investigated) the values are consistent with the overall mean:
 Figure 6: Evolution of the amplitude of Psi_1 for the East EPD. The x axis is linear.
 Figure 7: Evolution of the amplitude of Psi_1 for the West EPD. The x axis is linear.
 Figure 8: Evolution of the phase of Psi_1 for the East EPD. The x axis is linear.
 Figure 9: Evolution of the phase of Psi_1 for the West EPD. The x axis is linear.
Because the amplitude and phase within each of these runs are consistent with the mean value for their respective runs, I argue that we should flatten on a run-by-run basis.
- adams92's blog
- Login or register to post comments