Shower Shape Studies from Run11 data: Preliminary Progress Report 1
This report describes the steps taken by the author (at PSU, under Prof. Heppelmann) to study the shower shapes using the Run 11 data. As of now, we are just beginning to look at a few cells (small) of the FMS detector.
From the hits in each cells of the detector, and the calibation factors applied to the cells, we get the amount of energy deposited in each of the cells (for each event). Shower shapes are then used to reconstruct these events. The amount of match in the reconstructed events is a good indication that we got our calibration and shower shape information correct.
Data Selection
We look at the shower shapes produced by high energy photons from likely Eta events. To do this, we first create a sample of likely Eta events with the following cuts: (maximum cluster separation of 0.09 radians, energy sharing (Z)<0.75, pseudorapidity between 3.5 and 3.9). Currently, we are looking at Eta events within the energy range 60 to 90 GeV (Epair). While doing shower shape studies, I also do an additional selection that there be a minimum distance between the high energy photon in a likely Eta event and the other photons in the events (currently, taken to be 12cm); this ensures that the top 5 high towers do not include much contributions form photons other than the high energy photon.
The selection of high towers from each event
Cell class files for each cell are created in a data2 folder inside CodeSmall in the standard root12fms code, with the above mentioned sample of likely eta events. Then, a script cellEDist.C is used to create high tower data. Here is what it does for each event in the cell class.
- read the energy matrix by calling FillFMSEnergy(NSTB), which gives the energy distribution across the cells with the current calibration corrections applied.
- run the Yiqun reconstruction (note that a shower shape has to be used in this) and get the number of photons NPh, and the high energy photon. The reconstructed energy of the high energy photon is used to get the fraction of the energy deposited in the high towers.
- scan a 5x5 region around the current cell, and determine the first 5 high towers; fill these information in a tree and do this for each event in the cell class.
- other (perhaps) useful information are added to the tree as well: Those include: Mcell, high tower positions, Yiqun photon hit positions etc.
Example
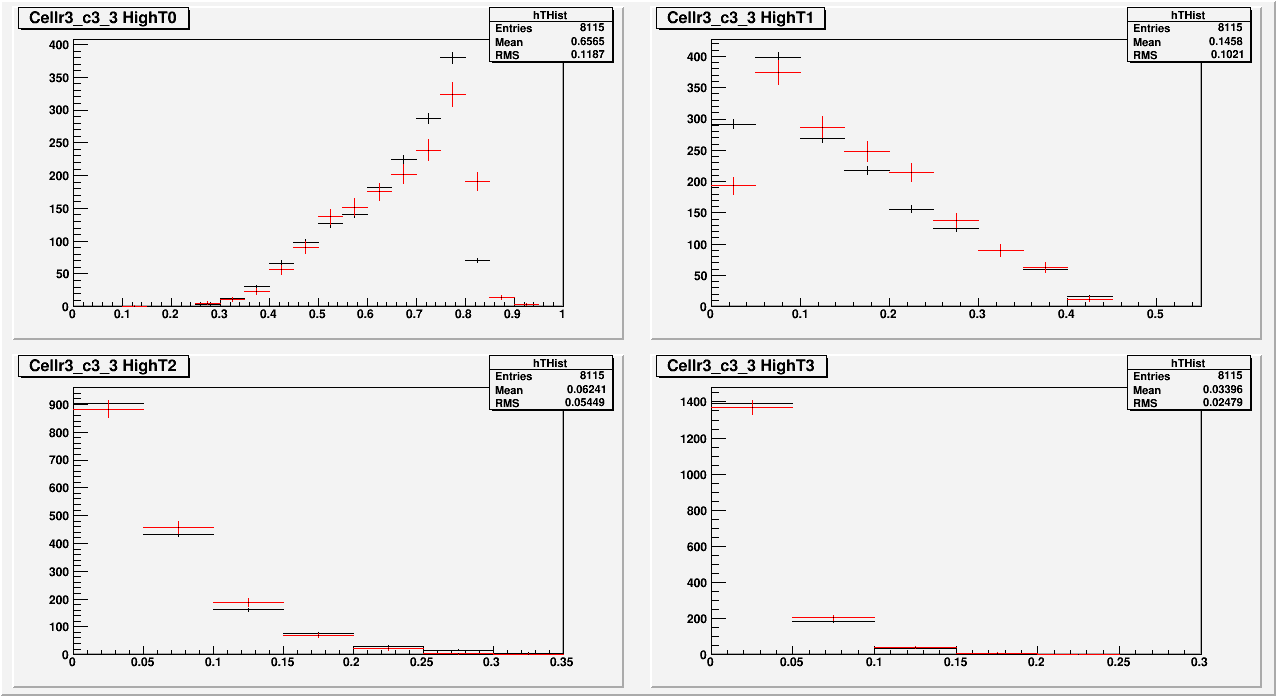
The following plot shows the first four high tower data (20 bins); the red is the data and the black is constructed using five times as many photons sampled randomly across the cell using the following shower shape parameters.
a = {0.85, 0.2, -0.05}
b = {0.6, 0.1, 7.6}
These values are modified only slightly from the default parameters {0.8, 0.3, -0.1,0.8, 0.1, 7.6}.

Clearly, we can see there is a good agreement between the MC and the data. The (r3,c3,3) cell was chosen partly because that it is not very close to the edges and it does not have a dead cell very close by as well (as can be seen by a plot of Y1:X1).
Fitting
The above values of a's and b's were guessed at by doing minor modifications to the default values. The task that I am working on at the moment is to fit the data by using Minuit minimization and obtain the six parameters a's and b's of the shower shapes and study how they change over the detector. As we know, these values should depend on the angle at which the incident photon strikes a cell, and therefore on the location of the cell. An update on this should follow shortly (in a matter of days, hopefully).
UPDATE
I just created some plots similar to that of above for some more number of cells. These include only small detectors (r%_c%_2) and (r%_c%_3) for small values of r and c.
The plots can be found in the attachment highTEplots.pdf
- adhikari's blog
- Login or register to post comments
